Omnilogy is an observability and security services company and a Dynatrace partner. With over ten years of Dynatrace experience, Omnilogy specializes in custom software development for observability. When they realized that many Dynatrace customers struggle with observing their CI/CD pipelines, they decided to build a custom solution for this problem on top of Dynatrace and AppEngine. The Omnilogy solution allows customers who have standardized their observability needs on Dynatrace to see everything in one place, including their CI/CD pipeline, while simultaneously reducing tool sprawl.
This blog post explores how customers and partners benefit from the Dynatrace platform’s openness and extensibility. We’ll further learn how Omnilogy developed a custom Pipeline Observability Solution on top of Dynatrace and gain insights into their thought process throughout the journey.
The impact of limited visibility in CI/CD pipelines
The journey for Omnilogy started when a customer explained that they needed a way to monitor and improve the performance of their CI/CD pipelines with Dynatrace. As modern agile software development relies heavily on automated CI/CD pipelines to swiftly build and deploy releases multiple times daily, these pipelines must be reliable and high-performing. However, observability across different CI/CD pipeline vendors remains inconsistent, making it difficult to understand the reason behind slow-downs or pipeline failures. This lack of comprehensive visibility into the performance of CI/CD pipelines poses a significant challenge, as they’re vital to the software delivery process. Without detailed insights, organizations risk encountering development downtime and pre-production delays due to slow builds or increased failure rates. Consequently, troubleshooting issues and ensuring seamless software deployment becomes increasingly tricky.
Build a custom pipeline observability solution
With these challenges in mind, Omnilogy set out to simplify CI/CD analytics across different vendors, streamlining performance management for critical builds. The goal was to develop a custom solution that enables DevOps and engineering teams to analyze and improve pipeline performance issues and alert on health metrics across CI/CD platforms. Faced with these requirements, Omnilogy carefully evaluated the following two options for implementing a solution to the pipeline observability challenge.
Option 1: Build a custom solution using several (open source) frameworks
Do-it-yourself (DIY) was the only option before composable enterprise software platforms became popular. With all the data readily accessible via the CI/CD tool vendor’s APIs, it’s easy to conclude that building a custom solution from scratch is straightforward. But DIY projects require extensive planning and careful consideration, including choosing the right technology stack, outlining the application’s framework, selecting a design system for the user interface, and ensuring everything is secure, compliant, and scalable to meet the requirements of large enterprises.
Omnilogy soon realized that creating a Pipeline Observability solution from scratch also involved additional risks such as:
- The framework and APIs are dynamic and will evolve, requiring regular maintenance and updates to ensure continuous operation. Addressing vulnerabilities becomes challenging when dependencies in third-party libraries or solutions are unclear.
- A secure access management system for code repositories and pipeline configurations is necessary, as these are among the organization’s most valuable assets and must be protected from accidental access. Additionally, security requirements such as data encryption both in transit and at rest need to be implemented.
- Finally, the cost of maintenance and administration can significantly increase due to the administrative overhead, which includes managing user access, ensuring compliance with security protocols, performing regular updates, and addressing any issues that arise from dependencies on third-party libraries or solutions.
Such an approach would have resulted in an inconsistent experience, ultimately adding another tool for the customer. Considering all factors, it became clear that, despite initial temptations, building a custom pipeline observability solution outside Dynatrace was not their best option.
Option 2: Build on top of the Dynatrace platform
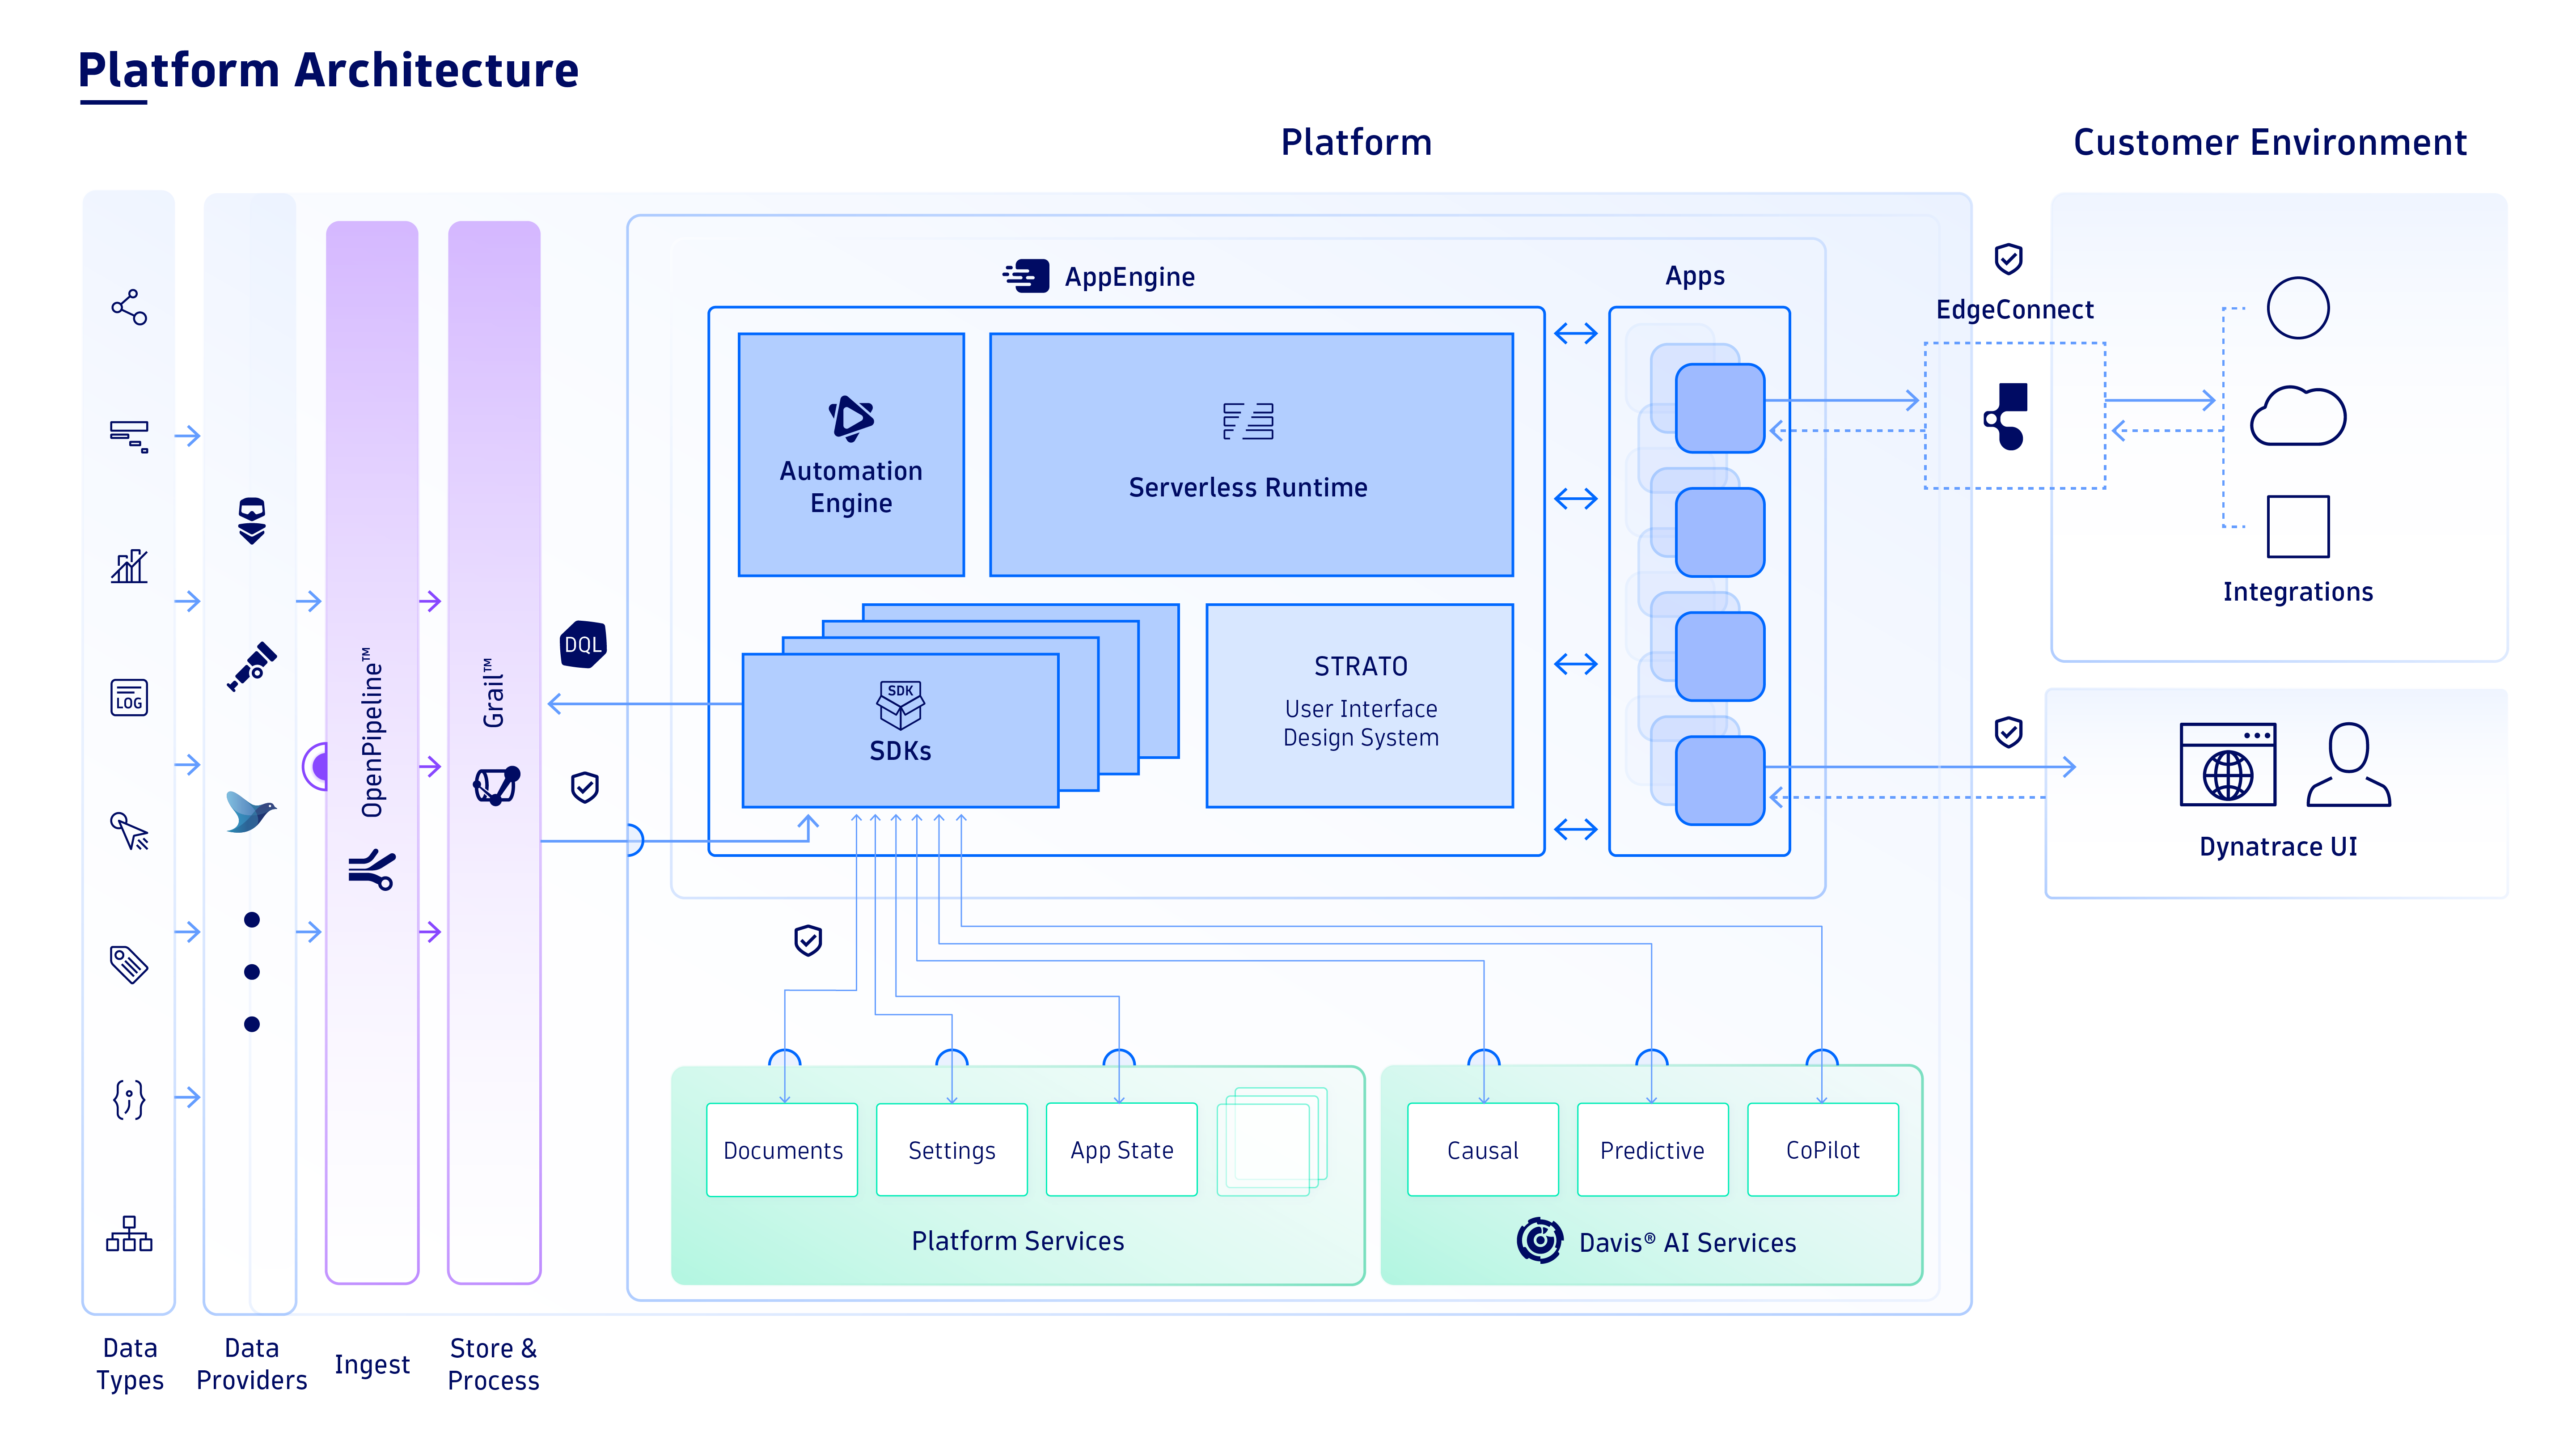
Instead of the cumbersome do-it-yourself approach, Omnilogy decided to build a Dynatrace® App (see image below), utilizing ready-made enterprise platform components such as AppEngine, AutomationEngine, Grail™, Davis® AI, or Strato.

Thanks to the open and composable platform architecture and the provided toolset, building a custom app that runs natively within Dynatrace was straightforward and efficient. Figure 2 provides an overview of Dynatrace’s core platform components which customers and partners can leverage to build custom apps.
Developers can automatically ensure enterprise security and governance requirement compliance by leveraging these components.

Requirements
Pipeline monitoring typically consists of several steps: data collection, pre-processing, routing, getting real-time insights, and ensuring data quality. This led to a list of functionalities they wanted to cover in their app:
- Ingest from different data sources: Jenkins, Azure DevOps, GitHub Actions, ArgoCD, GitLab.
- Normalization of data on ingest.
- Traceability: Present executed pipeline as trace.
- Same DQL semantics across all CI/CD vendors’ data.
- Intents: Ability to use Notebooks for drill-downs and Ops-specific investigations.
- Standardized reporting across all CI/CD vendors for easy comparison, including jobs/Errors/Duration charts for Pipelines/Stages/Steps.
- Protection of Omnilogy’s IP in this area
- Davis AI for anomaly detection (TBD)
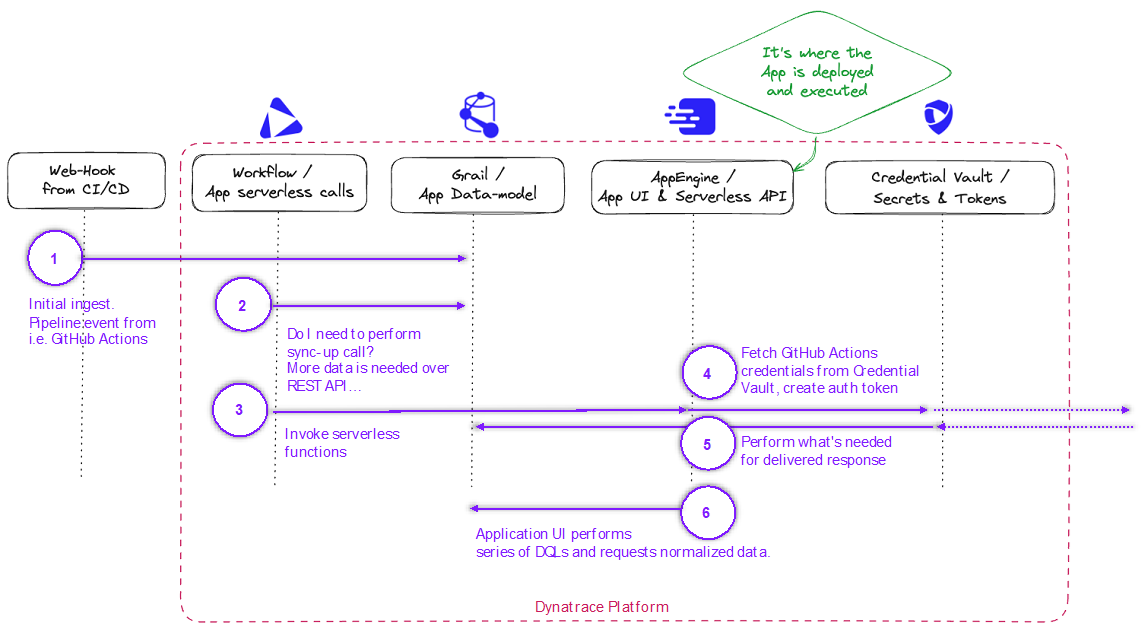
To better understand the background, let’s look at a simplified architecture that illustrates the Dynatrace components in use, as well as the data flow and processing mechanisms (Figure 3)

Outcome: A fully integrated custom app streamlined CI/CD performance management
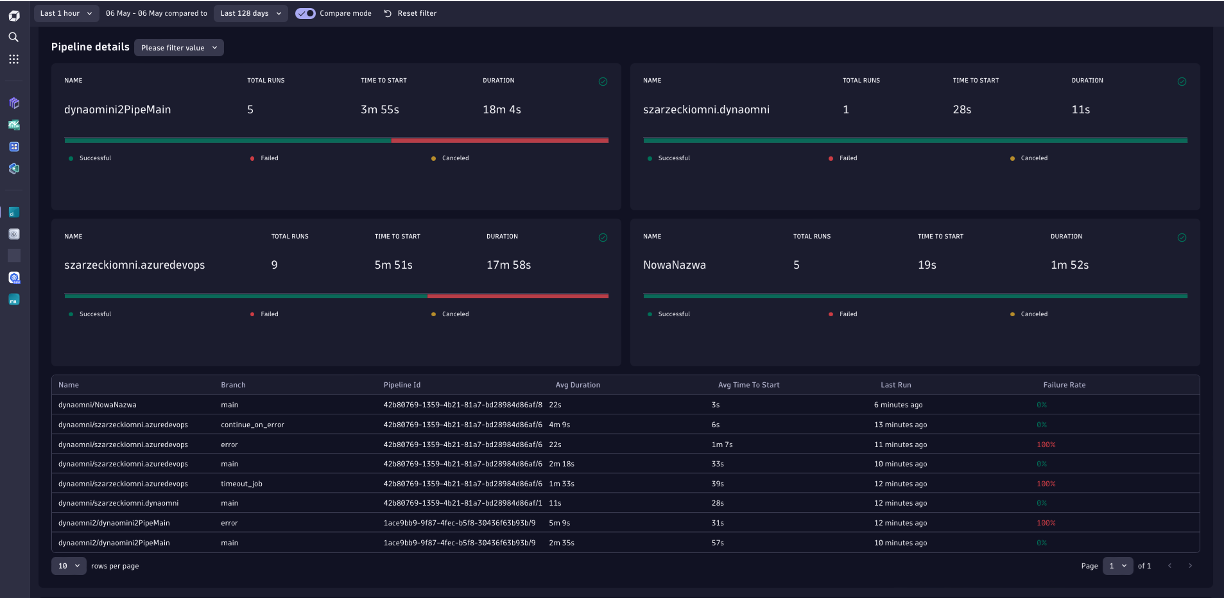
Omnilogy built the app using the provided toolchain (Developer portal, sample apps, Strato design system, VS Code extensions) and platform components without any further support from Dynatrace. The final app allows DevOps and engineering teams to track overall reliability, identify critical CI pipelines, and determine which pipeline most impacts delays. Drill-downs into details from the overview page allow comparing different CI/CD vendors and offer further insights to analyze and fix bottlenecks.
With this app, Omnilogy provides a single source of truth for their customers. It enables data-driven conversations between dev- and ops teams, making it easy to identify performance issues, errors, and the reason for failed deployments.

Summary
From the customer perspective, the advantages of implementing this custom solution as a Dynatrace App rather than adopting a do-it-yourself approach are evident:
- Get more out of your existing Dynatrace investment; no additional tools or software needed
- Dynatrace is already a trusted and vetted vendor with fine granular controls for privacy, security, and data access
- Dynatrace as a single source of truth for dev and ops teams
- Shorter time to market and time to adoption as opposed to DIY
As we have seen from this example, Dynatrace can easily handle custom requirements that are not supported out of the box. As all apps run in the Dynatrace environment, they automatically meet enterprise requirements without the need to build or manage infrastructure.
What’s next
This is just one of many examples. For more insights, check out our other custom solution blog posts or visit the Custom Solutions Spotlight to see what community members have already created.
To learn more about Omnilogy, visit their Hub partner page or the Pipeline Observability App on Dynatrace Hub.


Looking for answers?
Start a new discussion or ask for help in our Q&A forum.
Go to forum