Dynatrace has added support for the newly introduced Amazon Virtual Private Cloud (VPC) Flow Logs for AWS Transit Gateway. This new service enhances the user visibility of network details with direct delivery of Flow Logs for Transit Gateway to your desired endpoint via Amazon Simple Storage Service (S3) bucket or Amazon CloudWatch Logs.
What is AWS Transit Gateway?
AWS Transit Gateway is a service offering from Amazon Web Services that connects network resources via a centralized hub. This is accomplished by acting like a router and ensuring the connection is made only one time, simplifying your network.
What is VPC Flow Logs
VPC Flow Logs is a feature that gives you the capability to capture more robust IP traffic data that traverses your VPCs. Flow log data can be published to Amazon CloudWatch Logs or Amazon S3 after which you can retrieve and view its data in the Dynatrace Intelligent Observability Platform.
What can you expect from VPC Flow Logs for Transit Gateway
There are five network internet protocol (IP) characteristics that are captured within each of the Transit Gateway Flow Logs for each log source. These include Source IP, destination IP, transport protocol, source port, and destination port. There is robust metadata that is also captured as part of the flow logs and can be used for further filtering in correlation with your tracing. A full list of metrics can be found here and include dimensions such as the following:
- Packets. The number of packets transferred during the flow.
- Resource type. Type of flow log resource, Transit Gateway, or Transit Gateway attachment.
- Start. The timestamp when the first packet of the flow was received within the aggregation interval.
Why Dynatrace?
Dynatrace is a leader in cloud observability. When it comes to logs and metrics, the Dynatrace platform provides direct access to the log content of all mission-critical processes. This includes Transit Gateway. You can create custom log metrics for smarter and faster troubleshooting as well as understand log data in the context of the full stack. This includes real user impact.
Dynatrace log monitoring also allows you to automate your cloud-related log tasks so you can accomplish the following:
- Automatically see precise root cause in real time to simplify cloud complexity.
- Automate cloud operations and trigger remediation workflow to enhance efficiency.
- Automate ingestion of logs, metrics, and traces, and see continuous dependency mapping with precise context across hybrid and multicloud environments.
The Dynatrace problem-detection-and-analysis advantage
Dynatrace uses your data and its sophisticated AI causation engine Davis® to automatically detect performance anomalies in applications, services, and infrastructure. Dynatrace-detected problems are used to report and alert on abnormal situations. For example, performance degradations, improper functionality, or lack of availability (that is, problems that represent anomalies in baseline system performance). Problems have defined lifespans and are updated in real time with all incoming events and findings. Once Davis® detects a problem it lists the issue on your Problems feed.
Combining the context of Transit Gateway logs data with the correlation of our AI engine creates a new dimension of network-specific information. Teams can use this new information to identify additional problem areas and improvement candidates, as well as understand the impact of network contribution to overall application and user impact health.
The Dynatrace VPC Flow Log analysis capability
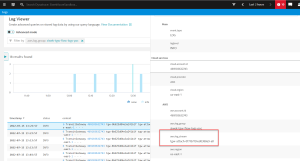
- Log Viewer. A feature that enables you to present log data in a filterable table that is easy to work with. You can also browse log data within a certain timeframe using detected aspects of the log content.

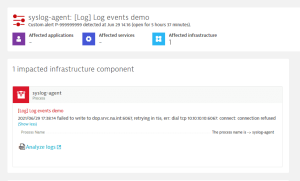
- Log Events. Relevant log events that are associated with problems are then factored into problem root-cause analysis.

- Log Metrics. Metrics from log data or log metadata that allow you to add to a dashboard or create custom alerting from each metric created.
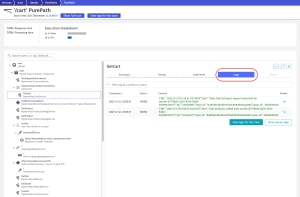
- Purepath. The ability to check log records in the full context of a transaction by combining logs with distributed traces.

Conclusion
The newly introduced VPC Flow Logs for Transit Gateway service brings a new network dimension to application monitoring. This service is a step forward in giving users and adopters the tools necessary for understanding, improving, and troubleshooting network-related traffic within the context of their digital assets. Dynatrace is committed to innovation and leading the way in cloud computing. We are proud to support this feature at launch and look forward to continuing being the leader in Intelligent Observability and to build software that works perfectly.
Resources
Check out our Power Demo: Log Analytics with Dynatrace.
Learn more about how Dynatrace and AWS are “better together.”
We invite you to experience the power of the Dynatrace Software Intelligence Platform and sign up for a free 15-day trial.


Looking for answers?
Start a new discussion or ask for help in our Q&A forum.
Go to forum