No matter how well-built your applications are, countless issues can cause performance problems, putting the platforms they are running on under scrutiny. If you’ve moved to Node.js to power your applications, you may be at risk of these issues calling your choice into question. How do you identify vulnerabilities and mitigate risk to take the focus off troubleshooting the technology and back where it belongs, on innovation?
There is no doubt that Node.js is one of today’s leading platforms of choice for microservices and gluing tiers, connecting the heavy lifting business logic with modern offerings like single page applications. Intuit and PayPal showed how the Node initiative of a small team of “company outlaws“ can grow into a whole organization and transform how things are done.
Adding a new technology to a stack also brings challenges, even more when crucial transactions run through its tier. Each new technology also adds more people to the table and it gets harder to find out who to call when things go wrong. Those boundaries between tiers are not only technological, as the figure shows, it’s also boundaries between generations of developers and philosophies: The JavaScript developer working on the Angular front end will most likely have a different mindset than the DBA of the db/2 database on the mainframe.
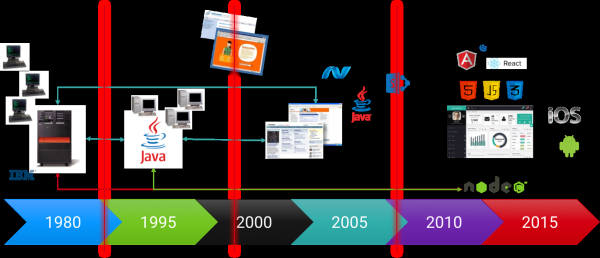
In previous posts I showed how to track down CPU and memory issues and while this is still relevant, I found that in many cases the root cause of problems doesn’t lie within Node.js but in services further down the stack.
Still those problems often surface in Node.js easily and the people in charge of it might be blamed first when things start to fail and proactively defending the boundaries to other tiers is crucial.
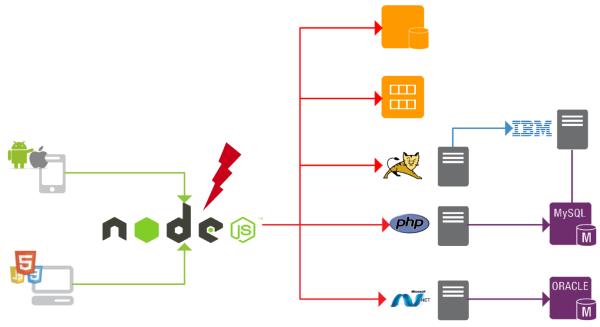
Vertical vs. Horizontal Complexity
In the past most applications were monoliths. The application logic was heavily interconnected and complex.
Changing one part could have various unexpected effects on other parts. Platforms like Java or .NET allowed the creation of threads to parallel control flow and offload work, but also introduced thread deadlocks or pooling problems, and complex object hierarchies were a challenge for the garbage collector.
Monitoring such vertically-complex applications requires tools that let you drill down to code level, discover dependencies between objects, inspect threads and analyze memory allocations.
Today’s application architectures are moving towards lean, composable, loosely-connected components, called microservices. By definition one service should provide just one piece of functionality, like fetching a customer from a back end. Compared to monolithic applications, the complexity shifts from a vertical to a horizontal dimension. Dependencies and messages between objects are now http calls on the network, threads are now separate services spread over multiple machines or cloud instances, and the code complexity of one single service is mostly trivial compared to the logic needed to manage this swarm-like architecture.
When monitoring such deployments drilling down into the code of a service is far less relevant than tracing through all transactions for all services involved as this reveals interdependencies, and instantly shows bottlenecks that degrade performance and affect users. If it turns out that the problem originates in a slow-legacy back end or a database problem, we can still drill down into the code.
The Top Two Node.js Performance Problems
Dan Shaw is a well-known and respected authority in the Node space, and with his company NodeSource he helps enterprises with their Node initiatives.
Recently I asked him which problems they are seeing most frequently at their clients, and how often Node is really the culprit. He told me that most of the time it’s massive string operations and back pressure causing problems:
Massive String Operations
“The biggest performance issues we’re seeing right now is with the non-streaming rendering of complex templates. The anti-pattern is to collect all the data points for an entire template and then attempt to synchronously render the entire blob. This puts enormous pressure on the event loop and essentially blocks execution of all Node.js operating tasks during this work. It’s relatively easy to mitigate by leveraging streaming or making small tweaks to the service architecture.”
Dan Shaw
Back Pressure
“This is related to your assertion that it’s usually not node’s fault. In fact, it’s not node’s fault at the inception of this issue. It’s frequently a data tier issue. However, when the data tier backs up and requests back up inside Node.js, that becomes an issue. You can get undetermined behavior, blank or truncated responses and other cascading failure states. Most of these issues are programmer resolvable, but the conditions tend to occur so rarely that many applications are not hardened to handle these conditions effectively.”
Dan Shaw
The first problem can be tackled by monitoring CPU and memory and taking snapshots if a process oversteps its thresholds. For smaller applications this functionality can be built into your code. In larger environments I recommend using dedicated solutions like N|Solid that, among many other features, provides all the tools needed for enterprise grade Node.js process monitoring. N|Solid is tested against Dynatrace and we are currently working on an even tighter product integration. Contact me to learn more and to be part of our early access program.
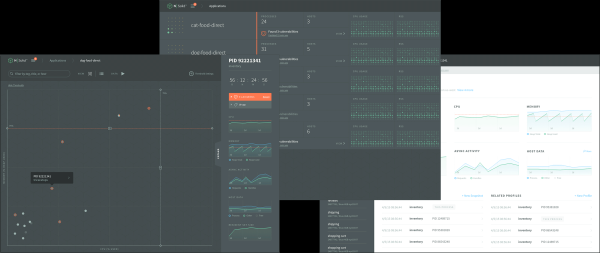
The second problem clearly shows the importance of protecting the boundaries of your tier because, though Node.js is not to blame, it might start to show erroneous behavior.
How to Protect your Boundaries?
If consuming slow services can affect Node’s behavior, we should find a way to monitor all outbound calls from Node.js and quantify them by their speed.
The naïve way – and I’ve seen it a few of times – is to try to manually log metrics for all transactions in question.
As the example shows, this means adding plenty of timing and logging code for every single outbound request. Still, you won’t be able to tell where the transaction originally came from, if and how many users experienced a degraded overall quality, and which tier down the stack was really the cause for the error or slowdown.
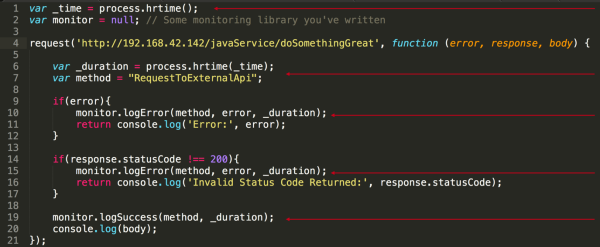
This is a viable solution if you just want to contribute to the blame game by telling that it’s at least not you, but is this really how we should approach problems?
No technology is an Island, we need a holistic view
In modern environments, teams frequently operate very independently. They choose which technology to use, how they test, and when to deploy. Still the overall performance of a system is the sum of its parts. One badly performing service may degrade the whole user experience, and end-to-end monitoring is the only way to trace down problems to its root cause and to fix them fast.
To monitor a multi-tier or microservice architecture end-to-end, we need a way to automatically discover all communication between processes and services, whether on one host, in multiple datacenters, or in the cloud.
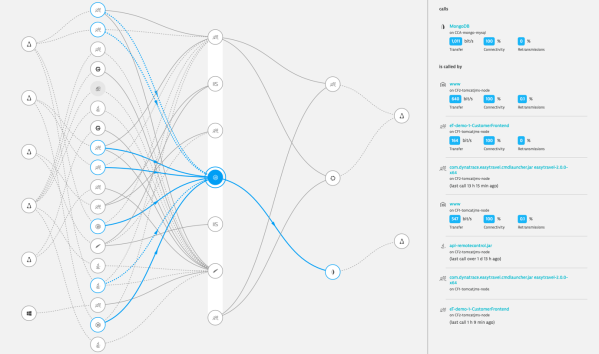
Knowing which processes on which hosts communicate with each other can help us to discover infrastructural problems like services highly dependent on each other while the network connection between them is slow.
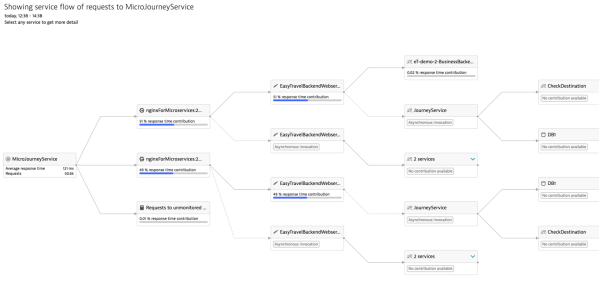
A service flow focuses on transactions passing through all tiers, and can reveal architectural problems like a service directly accessing the database and circumventing an API.
We see that looking at those details helps us to better understand the overall architecture of a system, but even those simple examples show that determining if our Node.js service is to blame for a performance degradation can be a daunting task. There are a lot of dependencies, and we’d need to analyze and correlate them all to find the cause.
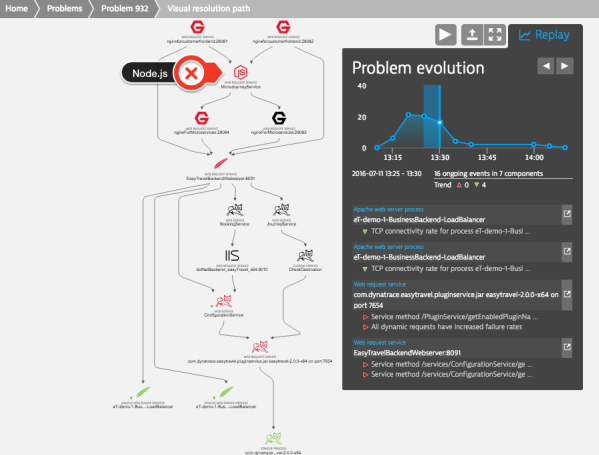
Dynatrace takes that pain from us and applies artificial intelligence to detect anomalies and trace down the problem as it occurs. Even if Node.js is involved as figure 7 shows, it will lead us directly to the real root cause.
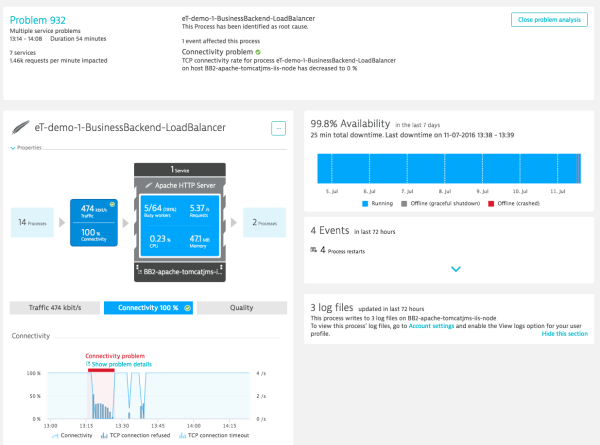
Figure 8 shows the problem analysis that identified network connectivity problems on the server hosting the Tomcat process as root cause for all subsequent degradations.
This exact class of problems can cause the Node.js process to error out. With Dynatrace in place the blame game stops and the problem can be solved quickly.
Conclusion
- Node.js is a young technology and adding it to the mix might trigger an overall paradigm shift.
- When crucial transactions pass through Node.js implementing proper monitoring is key.
- Even if Node.js shows errors, the root cause may be somewhere else.
- Use Dynatrace to protect your boundaries and holistically monitor your full stack to pinpoint the real root cause.
- Use dedicated solutions like N|Solid to get deep process analytics for your Node.js team
Visit our dedicated webpage about Node.js monitoring to learn more about how Dynatrace supports Node.js. Please feel free to contact me anytime if you have questions about my blog posts or how to instrument node. You can reach me on Twitter at @dkhan.


Looking for answers?
Start a new discussion or ask for help in our Q&A forum.
Go to forum