For updated information regarding Dynatrace support for W3C Trace Context, please see the more recent blog post Dynatrace W3C Trace Context support provides more interoperability between monitoring environments.
What is distributed tracing?
Distributed tracing is used to understand control flow within distributed systems. Especially in dynamic microservices architectures, distributed tracing is an essential component of efficient monitoring, application optimization, debugging, and troubleshooting.
Basically, it’s all about seeing how different services are connected and how your requests flow through those different services. It allows for the finding of cause-effect relationships between events, for instance, identifying which user action in a browser caused a failure in the business logic layer.
Distributed tracing—done completely automatically—has been a core component in Dynatrace from the very beginning. The value of Davis®, the Dynatrace AI causation engine, is built upon the quality of the data we collect. As such, understanding all the interdependencies among services through end-to-end tracing is key to us.
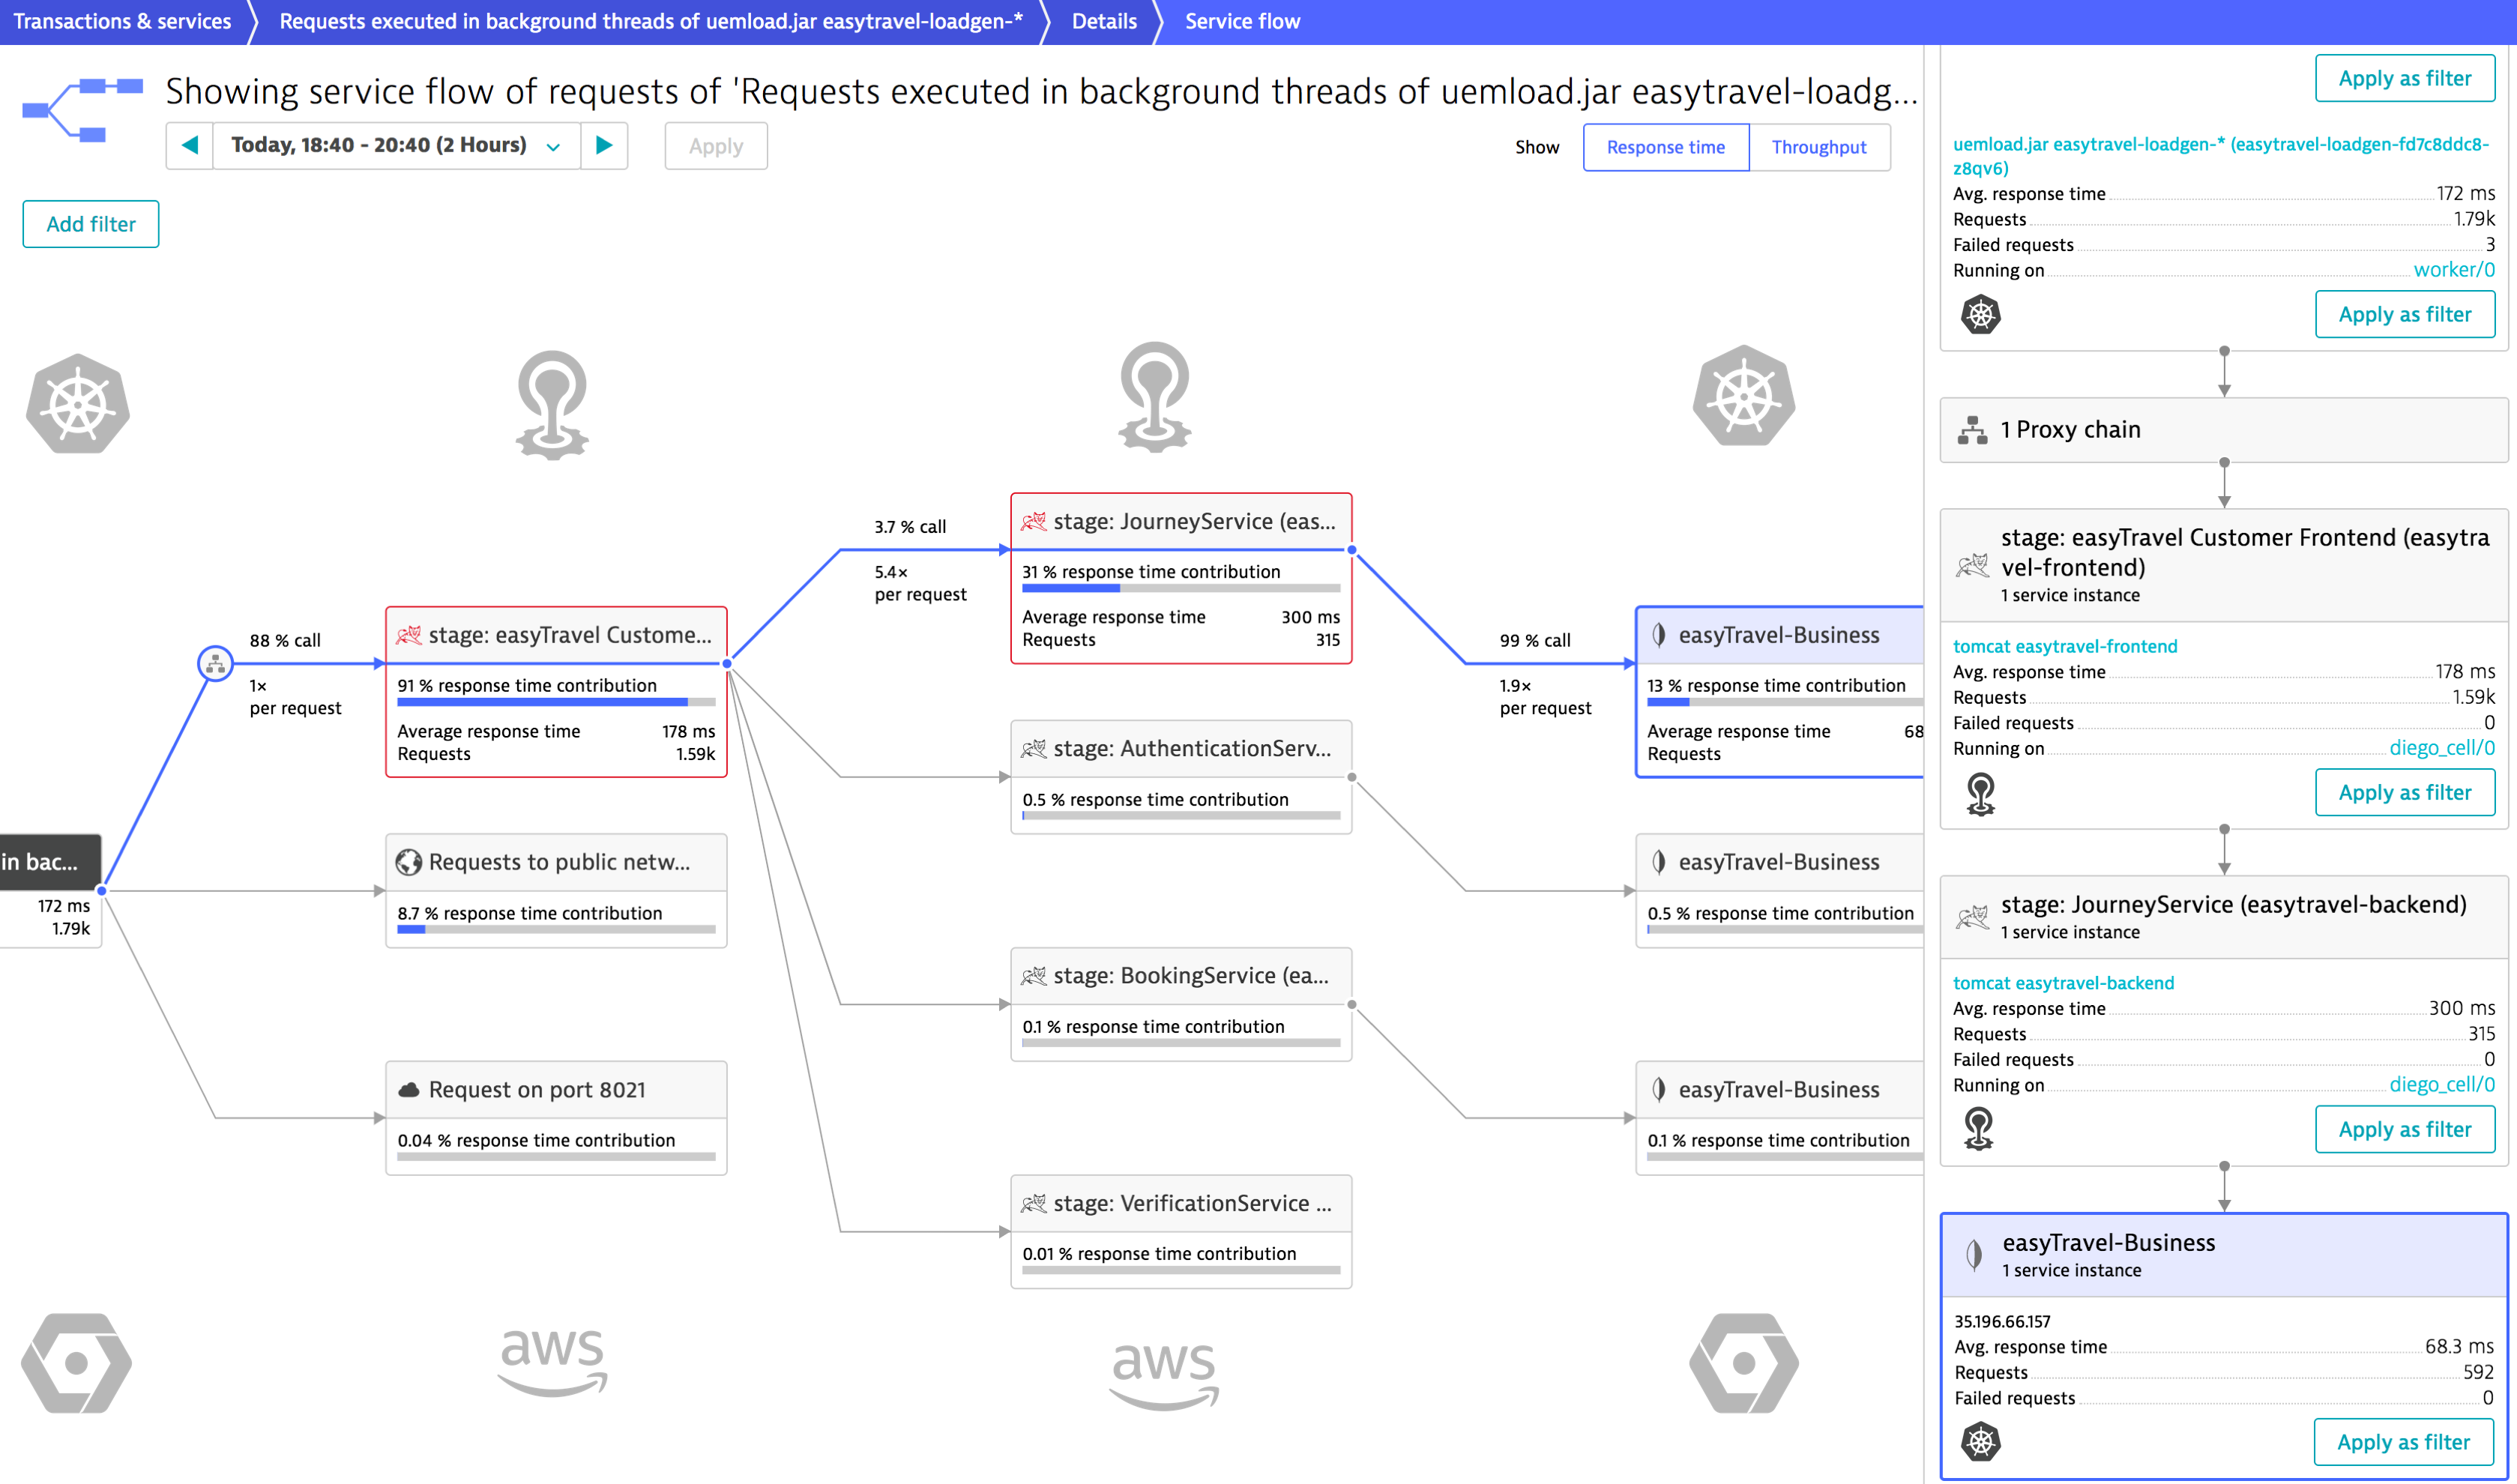
Dynatrace drives a new set of W3C standards to tackle known limitations
There are some known limitations to distributed tracing as it exists right now. Up to now, APM vendors and open source tools used their own defined HTTP headers (for example, x-dynatrace at Dynatrace) for distributed tracing. There were situations where end-to-end visibility would break, for example, when middleware (such as an API gateway) didn’t automatically forward the custom HTTP headers to a called service.
For the last year, my colleagues Alois Reitbauer (chair of the W3C Distributed Tracing Working Group), Christoph Neumüller, and Daniel Khan have been working with the community (open source tool providers and commercial vendors) on a set of standards called the W3C Trace Context specification that defines a unified approach to context and event correlation required for distributed tracing. Trace Context is now a candidate recommendation from the W3C, and we expect cloud vendor services and framework developers to comply with this standard in the future. This will result in fewer broken transactions and, therefore, more end-to-end visibility for our users.
Without W3C Trace Context
APM vendors and open source tools use their own defined HTTP headers for context propagation. These headers aren’t always transported by third-party components such as middleware, which can result in broken transactions.

With W3C Trace Context
While Dynatrace is the first vendor supporting W3C Trace Context, other vendors will have to follow and also open source tools will support the same standardized set of HTTP headers (trace parent and trace state) as defined in the Trace Context specification. Middleware and frameworks will then be empowered to forward the headers standardized by the W3C and propagate them to outgoing calls, thereby avoiding the breakage of end-to-end monitoring of individual requests.

If you’re interested in learning more about the concepts of distributed tracing, context propagation, and the related challenges, take a look at this excellent article by Alois Reitbauer.
Introducing W3C Trace Context support in Dynatrace – get even more precise answers
We’re happy to announce the Early Adopter Release of W3C Trace Context support in Dynatrace. Openness is in the DNA of our software intelligence platform. Supporting the W3C Trace Context will provide significant value to our customers as Davis, our AI-engine, provides even more precise answers with the improved end-to-end visibility, not just more data as traditional monitoring solutions.
End-to-end tracing through cloud services
Along with Microsoft, Google, and others, Dynatrace is a co-editor of the W3C Trace Context standard. Dynatrace is committed to implementing Trace Context into its services. Microsoft has already introduced Trace Context support in some of their services, including .NET Azure Functions, API Management, and IoT Hub.
Up to now, when a request went through an unmonitored .NET Azure Function, the transaction would break and Dynatrace only detected the outgoing web request to the Azure Function:


With Trace Context support in Dynatrace, end-to-end tracing will work out of the box, with no configuration required. The unmonitored Azure Function will be displayed as a proxy between the monitored services Producer and Receiver:

To install OneAgent on Azure and start monitoring Azure Functions, check out our Azure Site Extension for installing OneAgent on Azure Functions.
Interoperability with OpenTracing and OpenCensus
As the popularity of microservices architecture increases, many more teams are getting involved with the delivery of a single product feature. What if a team doesn’t yet use Dynatrace but has manually added instrumentation to their code using an SDK such OpenTracing or OpenCensus and they use an open source tool to help debug code across microservices, such as Jaeger?
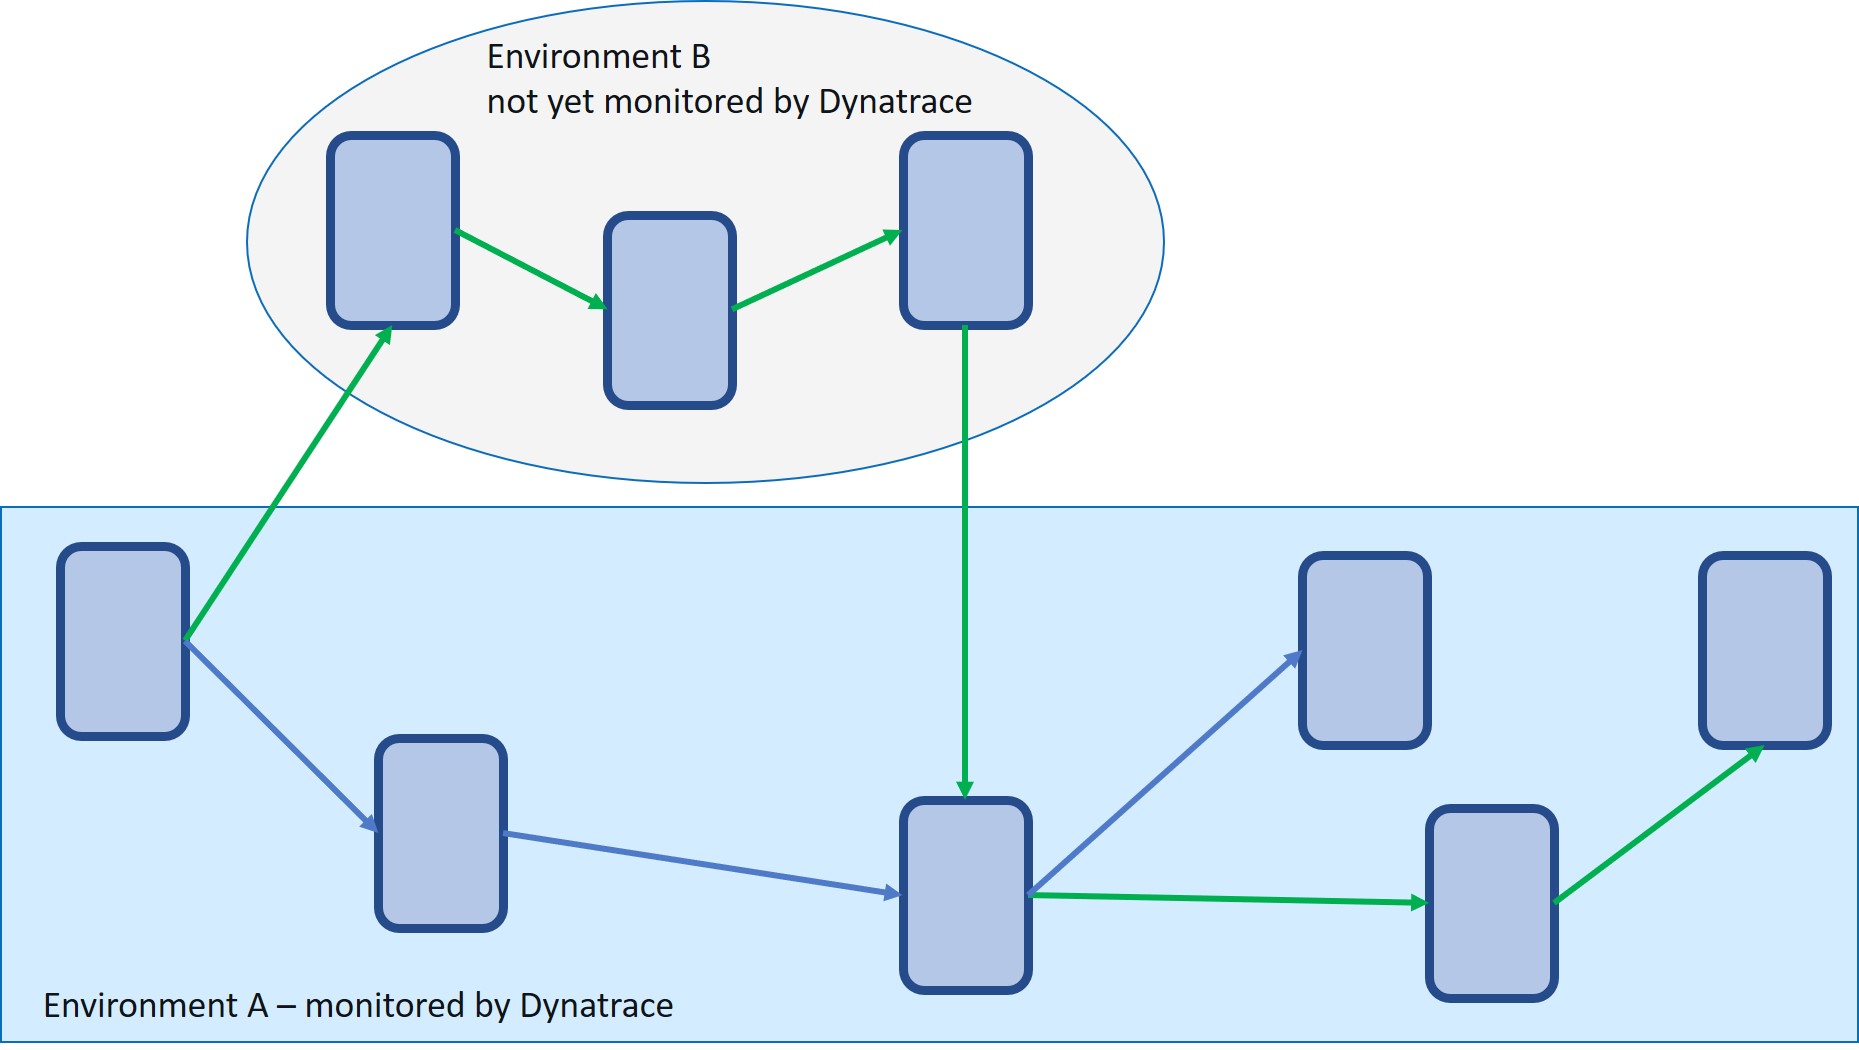
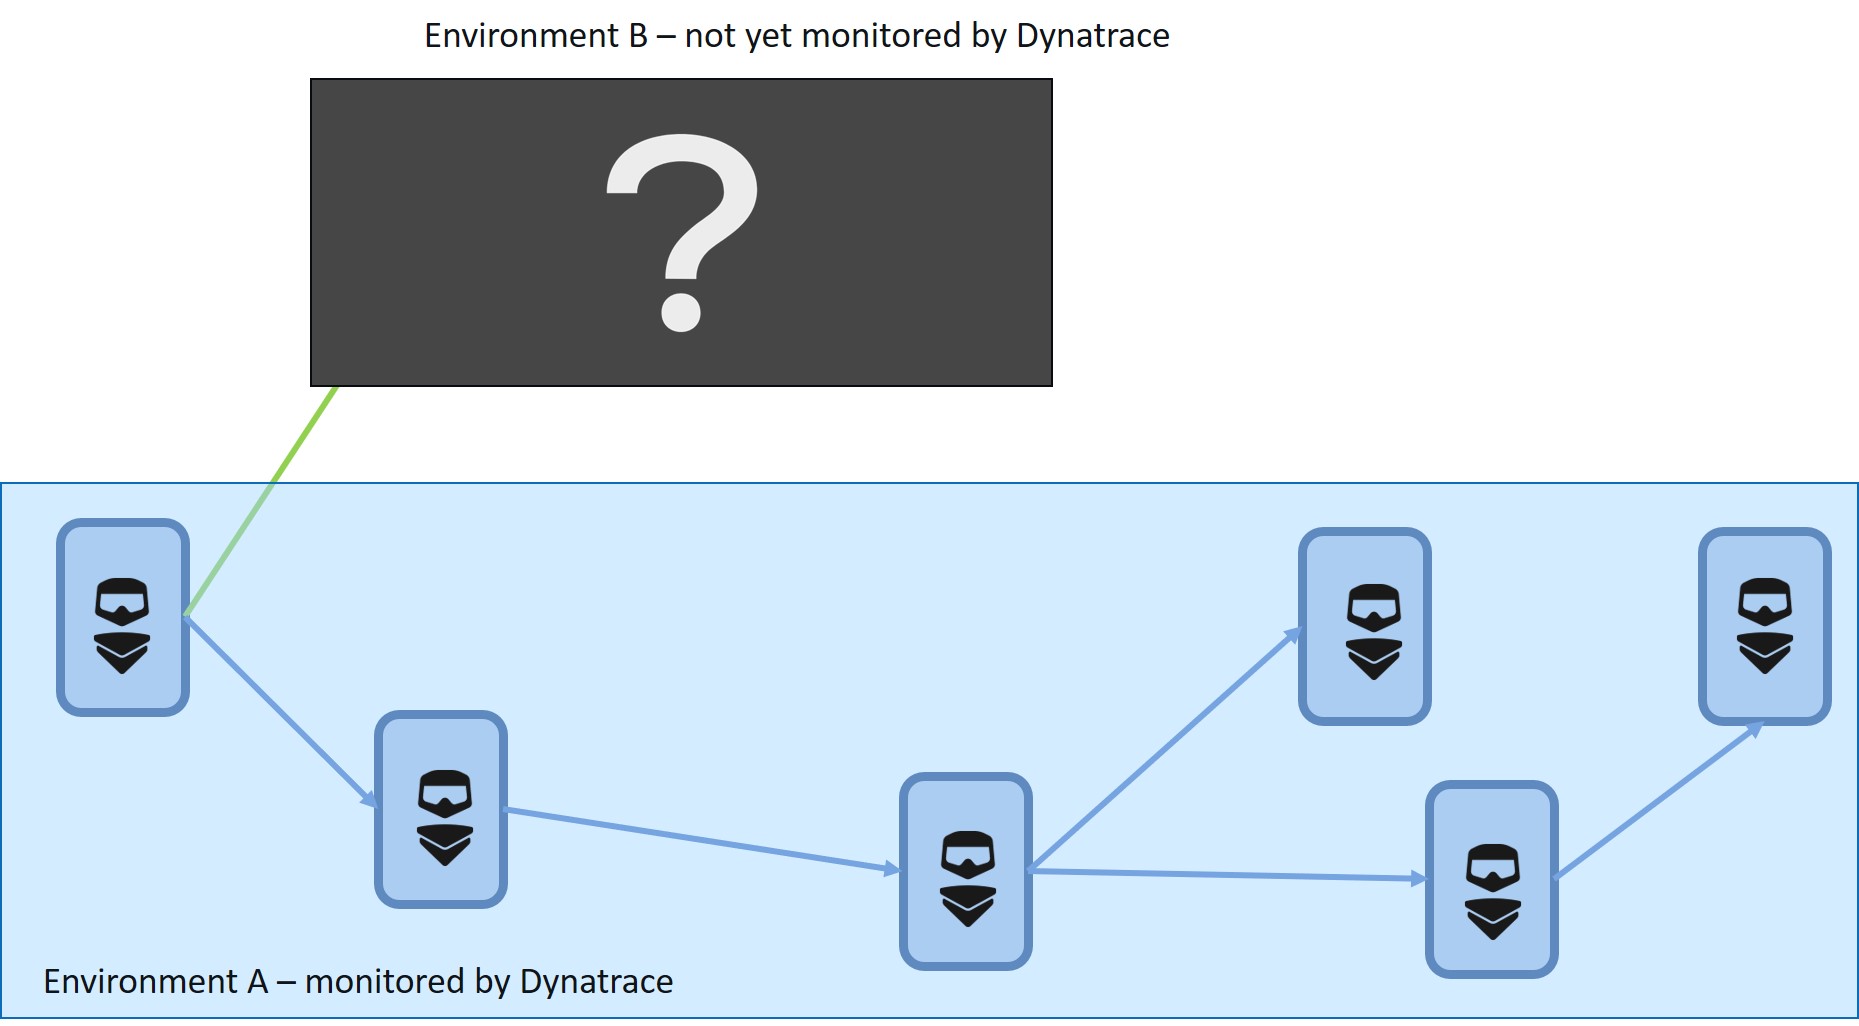
Up to now, transactions would stop with the boundary of environment A.
With Trace Context support, you will no longer lose end-to-end visibility even if an unmonitored service from another team is being called in the middle of your transaction, as the same trace ID (contained in the trace parent header) will be shared by all services, provided the library that the developers are using already supports the new W3C Trace Context standard.
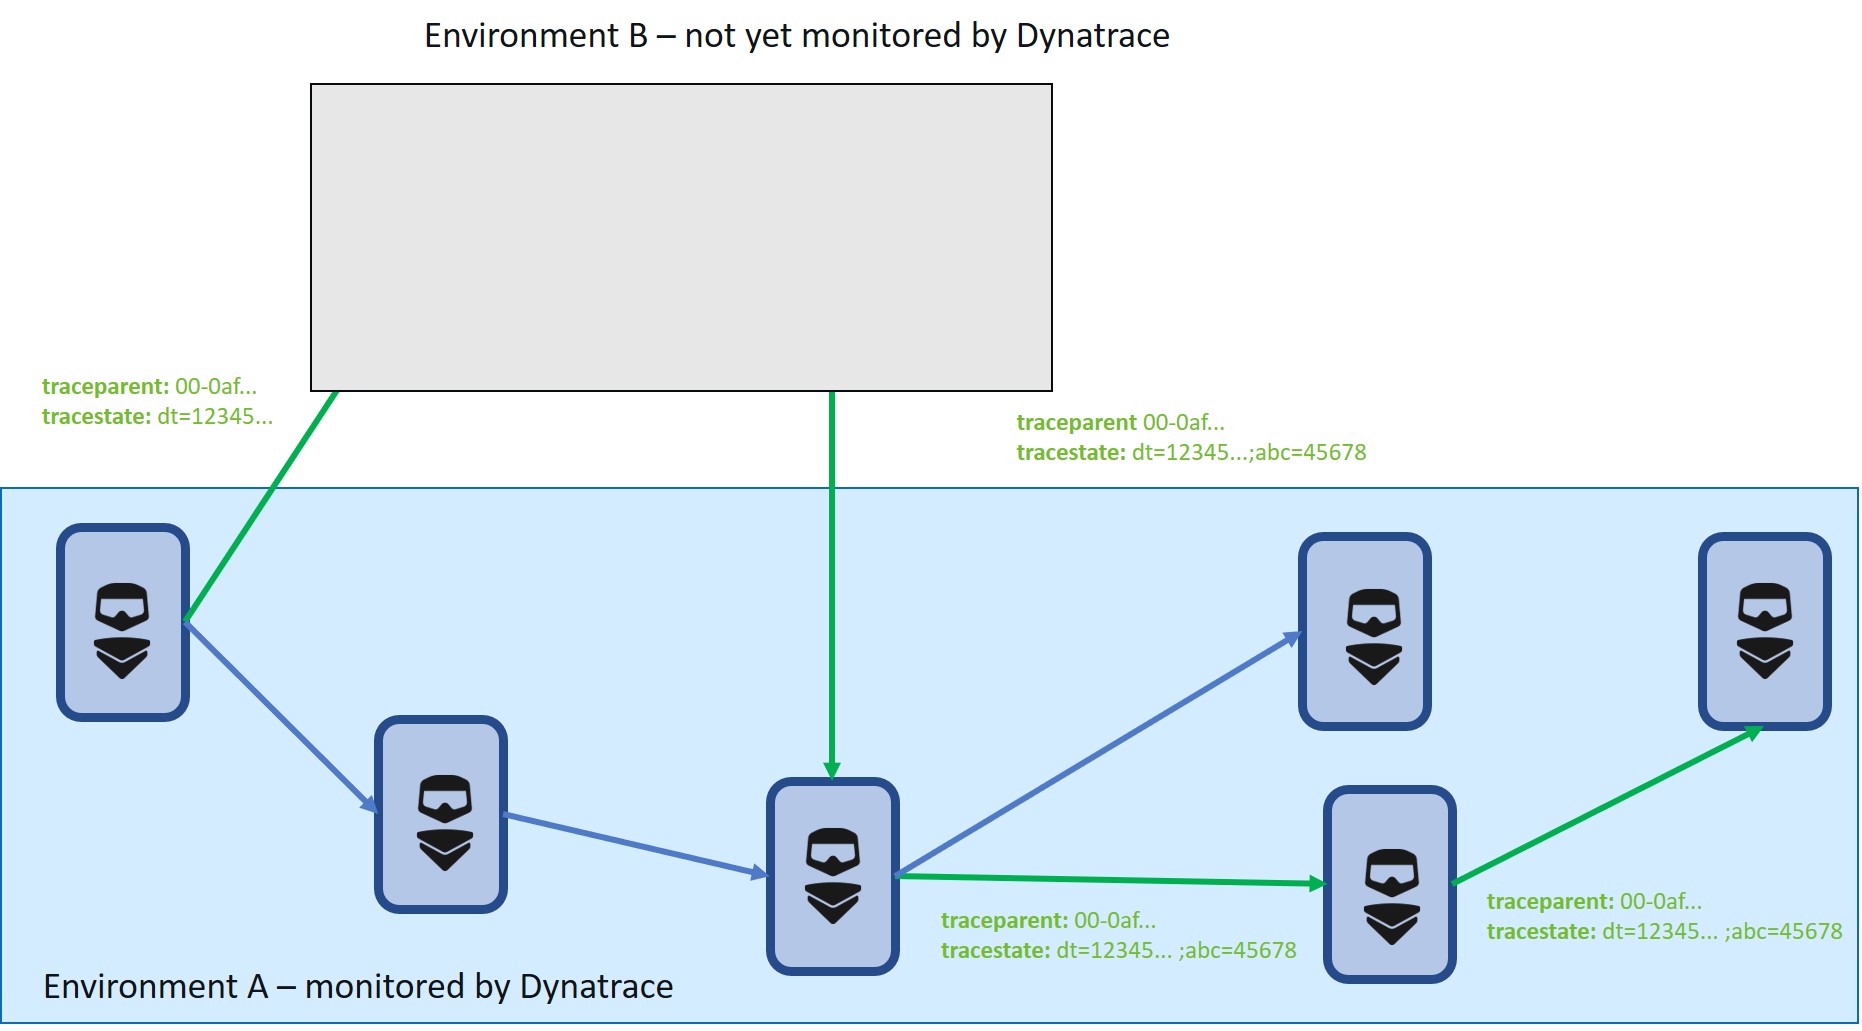
If Dynatrace detects in environment A that the unmonitored services in environment B are the root cause of an issue, you will be able to look in the debugging tool used by the developers in environment B for more information about that exact transaction simply by using the trace ID displayed in the PurePath details of environment A:
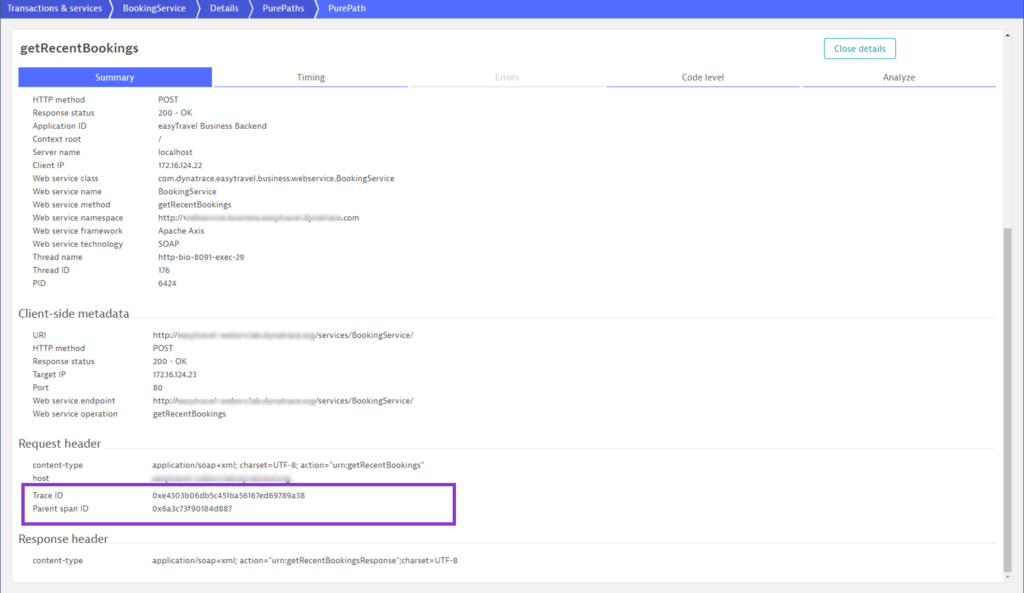
And of course, if the developers want to look at the transaction in Dynatrace, they can use the trace ID as a filter in PurePath view:

Trace Context support will enable teams to easily migrate to Dynatrace without breaking end-to-end visibility.
How can I get this feature?
- W3C Trace Context support is available as an Early Adopter Release (no registration required) beginning with Dynatrace version 1.180.
- You can enable this support in the Dynatrace web UI at Settings > Server-side service monitoring > Deep monitoring > Distributed tracing.
What’s next
Trace Context support is a first step that will enable us to support more and more distributed tracing use cases, such as:
- Support for Open Telemetry, the new, unified set of libraries and specifications for observability telemetry resulting from the merging of the OpenTracing and OpenCensus projects as an alternative to our OneAgent SDK
- Increased end-to-end tracing in Kubernetes and Cloud Foundry environments with support for Envoy/Istio.
- Correlation of transactions and logs
- Support for tracing through multiple Dynatrace environments


Looking for answers?
Start a new discussion or ask for help in our Q&A forum.
Go to forum