There are many ways your business can interact with your customers in the digital world. Monitoring user experience and behavior in your web and mobile applications is a great way to get started with digital experience monitoring; Dynatrace easily detects and monitors these touchpoints automatically using Dynatrace OneAgent. However, your business likely has many other digital touchpoints where your customers interact with your brand that are also key to the success of your business. With Dynatrace OpenKit instrumentation, Dynatrace has closed the gap between the automated instrumentation provided by OneAgent and manual instrumentation. By providing you with a set of open source libraries, Dynatrace OpenKit enables you to instrument all other digital touchpoints in your environment, whether or not they’re traditional rich client applications, smart IoT applications, or even Alexa skills.
As part of our beta program, we’ve introduced a new application type called custom applications to encapsulate the monitoring data sent via Dynatrace OpenKit. The Dynatrace OpenKit libraries are available on GitHub. We currently have Java and .NET versions available. C++ and JavaScript versions will follow soon.
Get started with Dynatrace OpenKit
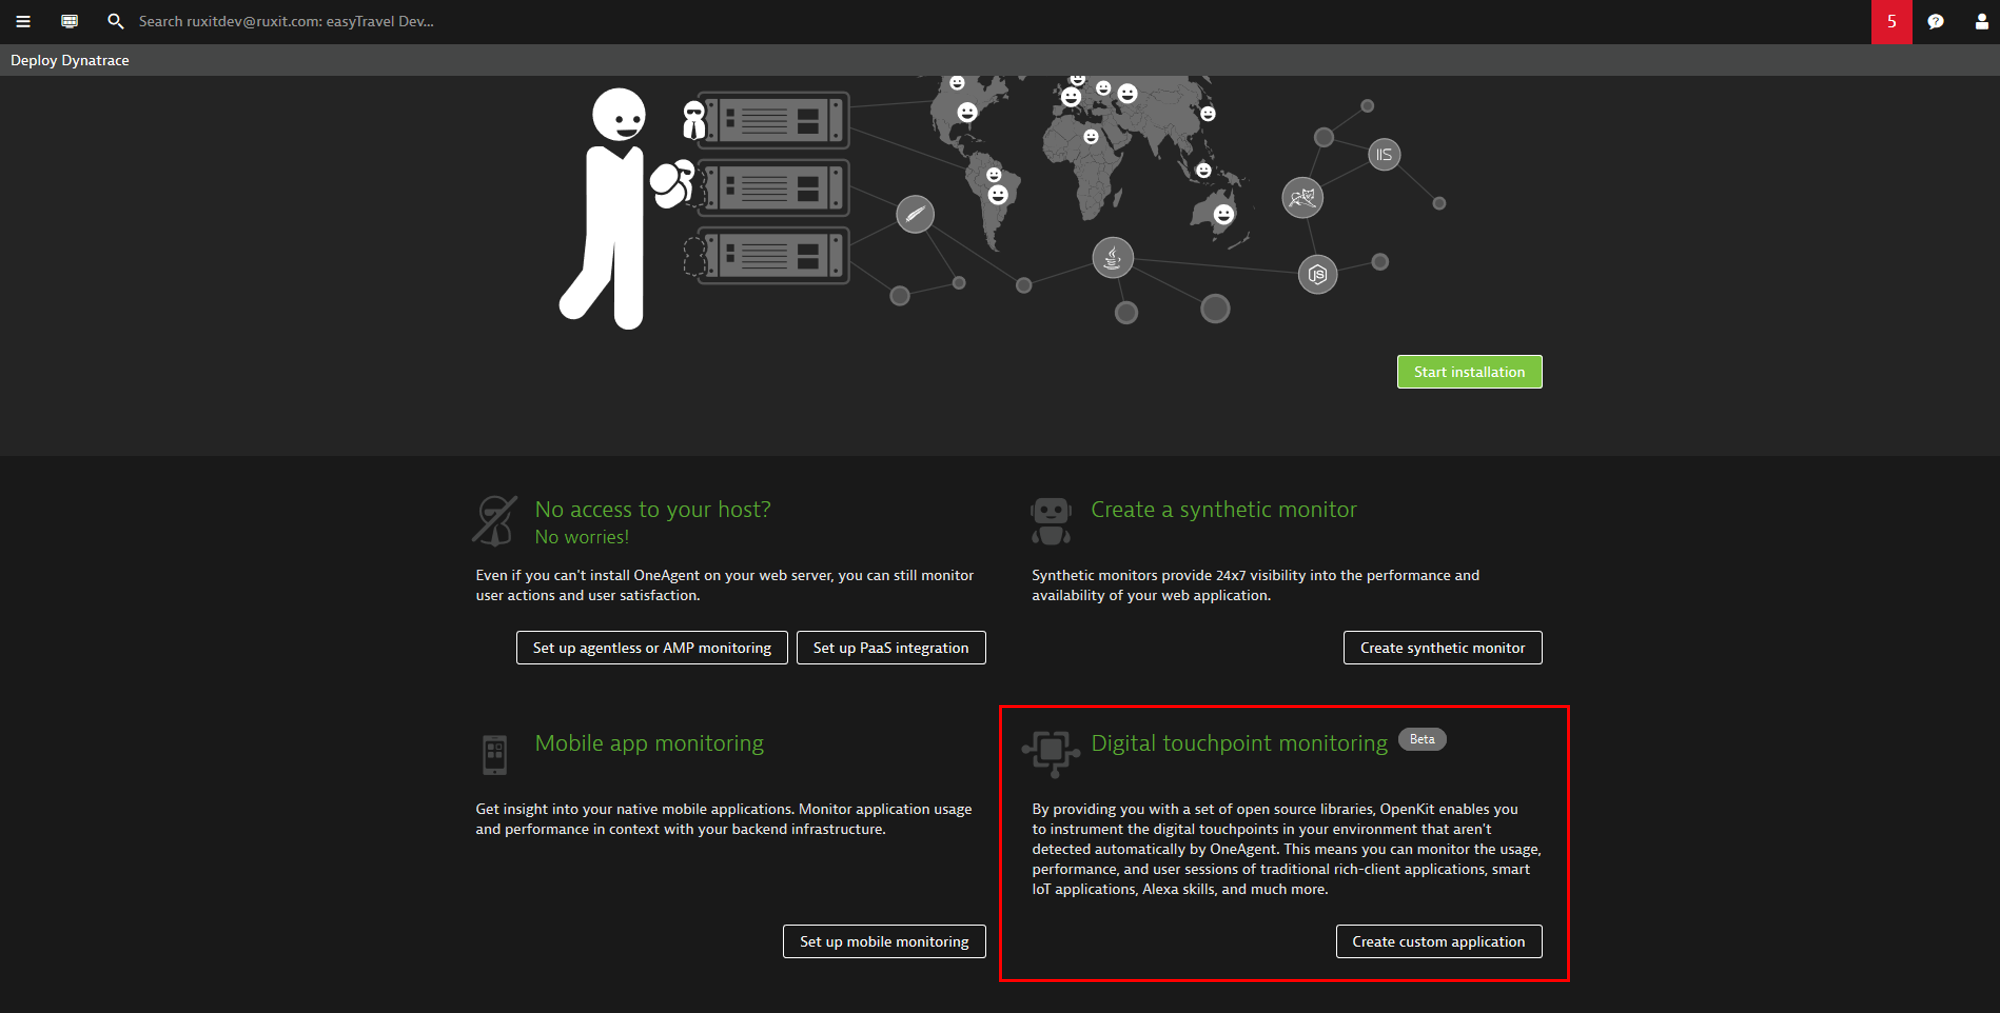
- From the navigation menu, select Deploy Dynatrace.
- Within the Digital touchpoint monitoring section, click the Create custom application button.

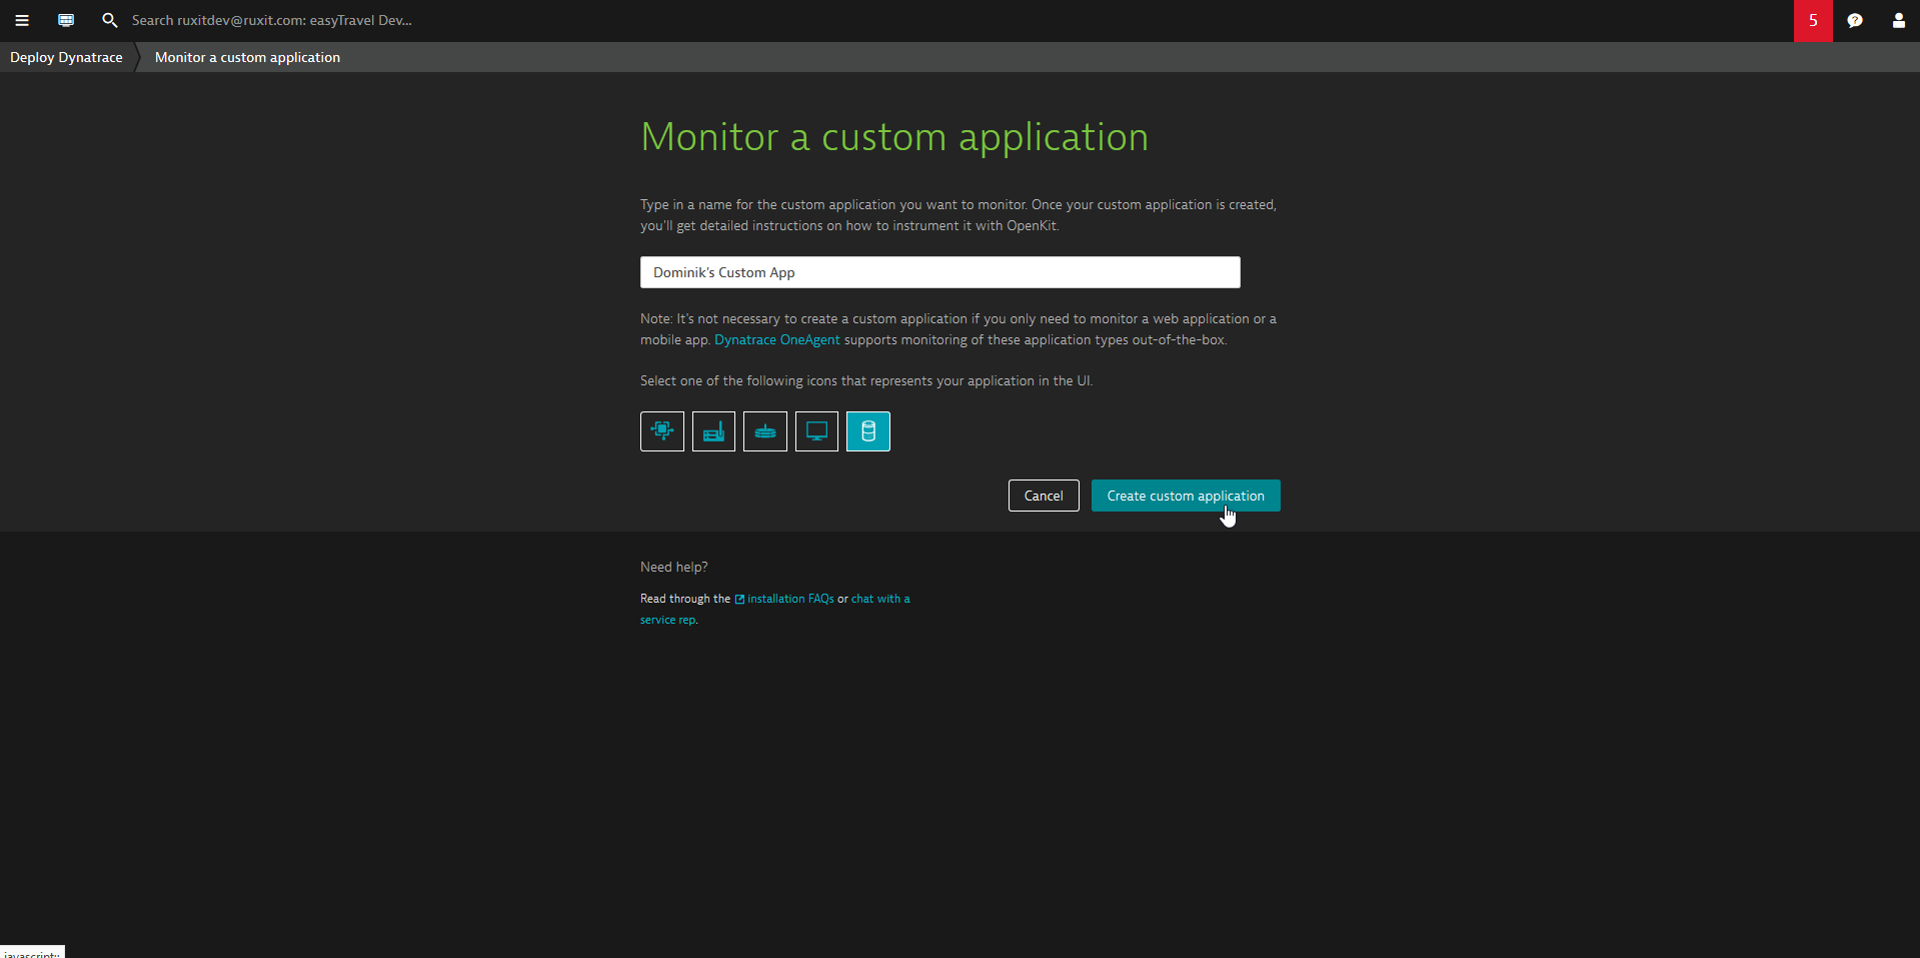
- Type a name for your custom application.
- Select an icon to visually represent your custom application in the Dynatrace UI.
- Click the Create custom application button.

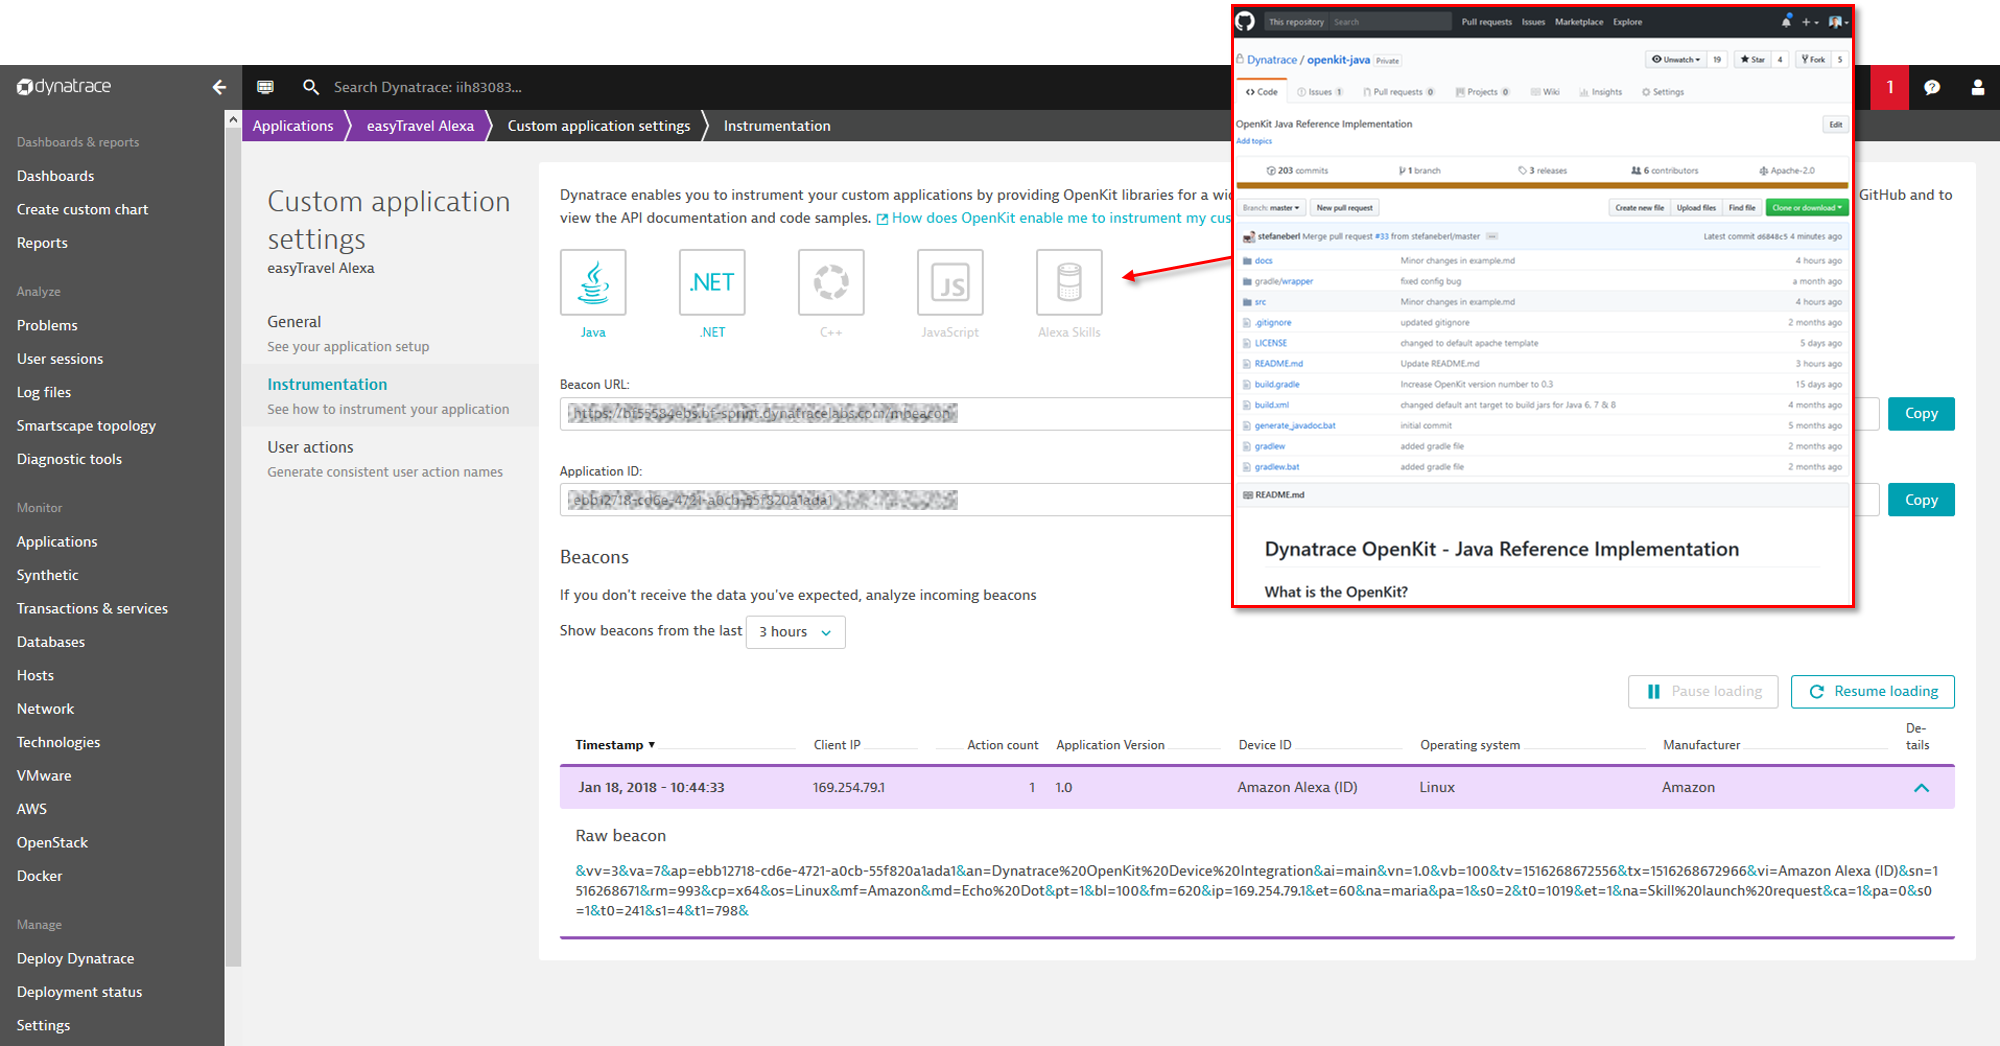
- You’ll be directed to the Instrumentation page of your new custom application.
From here, you can download Dynatrace OpenKit from GitHub and instrument your application using the providedBeacon URLandApplicationID.
The Beacons view below is especially handy as shows you incoming beacons as they arrive, with only a couple of seconds delay. This view also provides information about potential problems.

- Once your custom application begins to send monitoring data to Dynatrace, you can analyze the data just like any other application. Have a look at the example Custom IoT application page below.

- You can view all your user actions by selecting the View all user actions button in the Top actions section (see above).

- From here you can continue to the list of user action instances and view detailed timings for a single user action

Dynatrace OpenKit libraries on GitHub
The following Dynatrace OpenKit libraries are currently available for download so you can begin instrumenting your custom applications:
Basic instrumentation example
Here’s a basic Java example that shows how to use Dynatrace OpenKit to send monitoring data to Dynatrace:
public static void main(String[] args) {
    String applicationName = "My OpenKit application";
    String applicationID = "application-id";
    long deviceID = 42;
    String endpointURL = "https://tenantid.beaconurl.com";

    OpenKit openKit = new DynatraceOpenKitBuilder(endpointURL, applicationID, deviceID)
            .withApplicationName(applicationName)
            .withApplicationVersion("1.0.0.0")
            .withOperatingSystem("Windows 10")
            .withManufacturer("MyCompany")
            .withModelID("MyModelID")
            .build();

    openKit.waitForInitCompletion();

    String clientIP = "8.8.8.8";
    Session session = openKit.createSession(clientIP);

    session.identifyUser("jane.doe@example.com");

    String rootActionName = "rootActionName";
    RootAction rootAction = session.enterAction(rootActionName);

    String childActionName = "childAction";
    Action childAction = rootAction.enterAction(childActionName);

    childAction.leaveAction();
    rootAction.leaveAction();
    session.end();
    openKit.shutdown();
}
For more details, see Dynatrace Help.


Looking for answers?
Start a new discussion or ask for help in our Q&A forum.
Go to forum