The ability to recover quickly in case of a sudden IT outage is crucial for business resilience. This blog is part of a series that explores how organizations can maintain business resilience by having the right capabilities to recover quickly from an IT outage.
On July 19th, 2024, countless organizations had their operations disrupted by a routine software update from CrowdStrike, a popular cybersecurity software. The resulting outages wreaked havoc on customer experiences and left IT professionals scrambling to quickly find and repair affected systems.
A wide variety of companies and industries have suffered the effects of this incident, from delayed flights to disruptions in healthcare, insurance, and the financial industry. The ripple effects on the global supply chain have been equally significant. The crisis has emphasized the importance of having a strategy for maintaining stability and performance.
Time is of the essence in any crisis—so is having the right tools and capabilities. Although Dynatrace can’t help with the manual remediation process itself, end-to-end observability, AI-driven analytics, and key Dynatrace features proved crucial for many of our customers’ remediation efforts.
Following are some of the critical capabilities many of our customers relied on to recover from the CrowdStrike update crisis in just hours.
1. Real-time monitoring with out-of-the-box features
Real-time data and monitoring are crucial for maintaining situational awareness of IT environment stability and performance, especially during a crisis. Knowing what’s offline and which dependencies connect to mission-critical services is key to determining the impact of an incident and determining where to start remediation. Dynatrace offers various out-of-the-box features and applications to provide a high-density overview of system health for all hosts and related metrics in a single view.
Smartscape topology mapping
Dynatrace Smartscape® provides a dynamic, real-time visualization of the entire application topology so teams can quickly identify and address issues. Understanding application dependencies helps teams prioritize what to address first. For example, a good course of action is knowing which impacted servers run mission-critical services and remediating those first.
Problems application
The Problems application automatically identifies issues, collects the context behind them, and presents their root cause and impacts in a single view. Powered by Davis® AI, the app helps teams immediately see the problem’s duration, root cause, and business impact.
Dashboards and visualizations
Standard dashboards and visualizations also provide situational awareness out of the box. The following honeycomb visualization shows a healthy environment before an incident and after the incident starts. All the problems, offline hosts, databases, and failing services appear in red.


Dynatrace OneAgent full-stack and Foundation and Discovery modes
Dynatrace OneAgent provides automatic discovery and monitoring. In addition to using OneAgent for full stack monitoring of the most critical applications, Dynatrace offers OneAgent Foundation and Discovery mode. This lightweight alternative provides full coverage of an environment in scenarios where teams need cost-effective yet comprehensive monitoring. Foundation and Discovery provide essential metrics and topology discovery, making it useful to quickly identify and recover affected hosts.
Together, these technologies enable organizations to maintain real-time visibility and control, swiftly mitigating the impact of incidents and efficiently restoring critical services. They also enable companies to measure the effectiveness of their remediation activities to ensure that recoveries proceed as expected.
How out-of-the-box monitoring features helped one company recover from the CrowdStrike outage within hours
A US-based pharmaceutical company recovered its most critical systems within hours of the CrowdStrike incident using out-of-the-box real-time monitoring features. Dynatrace automatically found the hosts that were unavailable or having problems. The key information displayed on the standard Dynatrace Problems app and the Infrastructure and Operations App became the basis of their team’s remediation plan. The company was back to normal business operations as other companies continued to struggle with recovering days after the initial software push.
2. Synthetic monitoring
Synthetic monitoring is a critical tool for ensuring application reliability and performance, especially during a crisis. By simulating user interactions and running tests from various locations worldwide, synthetic monitoring provides a comprehensive view of application performance and availability. This proactive approach allows organizations to detect and resolve issues early, optimize performance, and maintain a high-quality user experience.
Organizations can use synthetic monitoring to continuously monitor API endpoints and ensure that critical user journeys perform well and meet service level agreements (SLAs). This awareness can help reduce downtime and minimize disruption, enabling swift action if an incident occurs.
Many businesses rely on third-party services, such as payment processors, content delivery networks (CDNs), and ticketing systems to get through their day-to-day operations. Even if the business isn’t directly affected by a crisis, their third-party suppliers may be, which can still disrupt their operations.
How synthetic monitoring helped one company get an early warning of the CrowdStrike impact
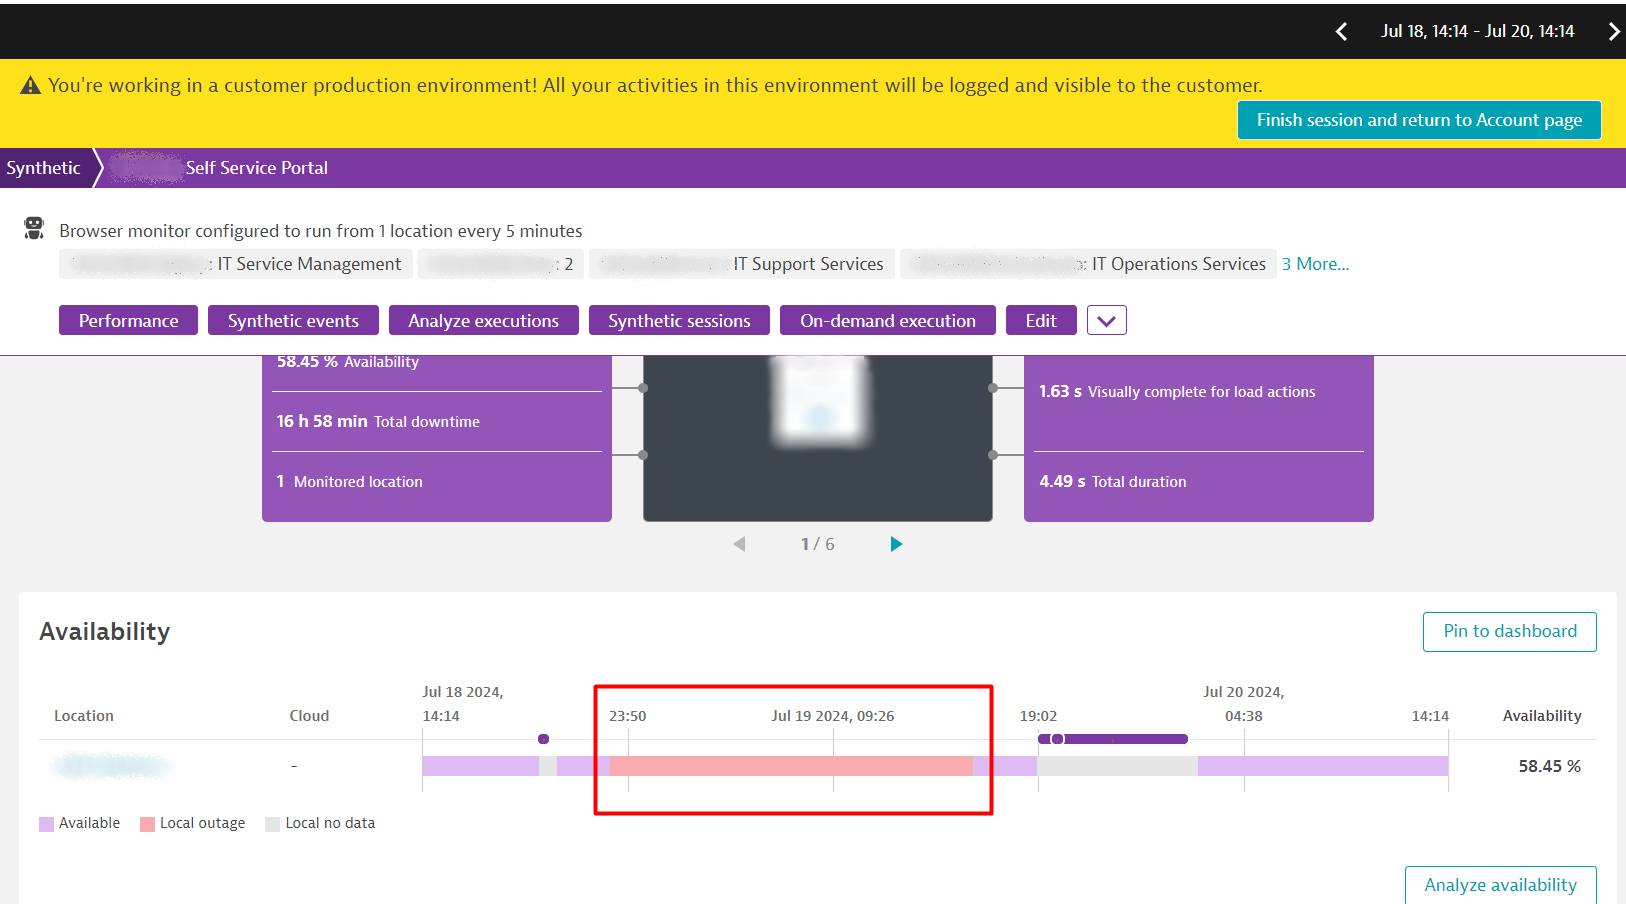
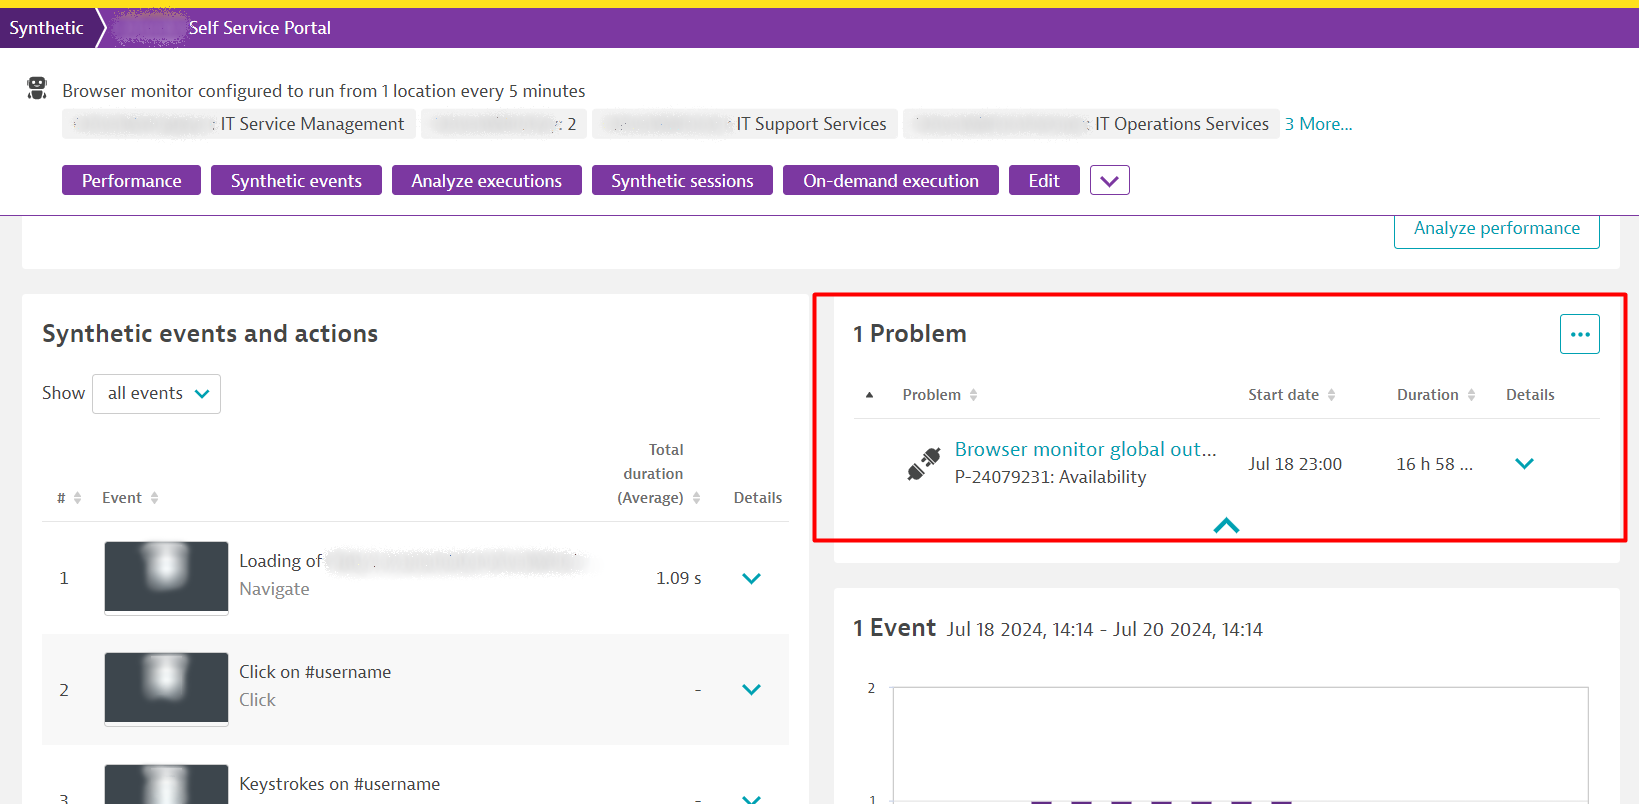
During the recent CrowdStrike crisis, a US life insurance provider was impacted indirectly through its third-party ticketing system. The Dynatrace synthetic monitors they used to monitor the performance of this critical third-party application immediately detected the outage when the CrowdStrike software affected the vendor’s servers.
Dynatrace created a problem notification and Davis AI determined the root cause on the vendor’s side, hours before the company publicly announced the CrowdStrike incident affected it. This advanced warning allowed the life insurance provider to execute a contingency plan and course of action much earlier than if they had to wait for the third-party provider to notify them of the problem.


3. Dynatrace Query Language (DQL)
Dynatrace Query Language (DQL) is a structured syntax for exploring, querying, and processing observability data in Dynatrace. It allows users to chain commands together to filter, manipulate, and analyze data efficiently.
As a data query tool, DQL provides flexibility and customization, allowing organizations to tailor their investigations to meet specific needs, addressing unique challenges and optimizing performance.
Using DQL, investigators can find specific answers so they can quickly identify and respond to issues, which is crucial during crises like the CrowdStrike incident.
Dynatrace Notebooks is an interactive capability that enables users across the organization to collaborate using code, text, and rich media to build, evaluate, and share insights for exploratory analytics. This ability to track and collaborate on issue details is a crucial capability in a crisis.
How DQL and Notebooks helped companies pinpoint affected systems and prioritize remediation
During the CrowdStrike crisis, a North American telecommunications provider used DQL and a notebook to create custom charts filtered by application. This helped the company prioritize remediating its most critical servers first, restoring essential services promptly.

When a major US airline began experiencing the CrowdStrike outage, its IT team also used DQL and Dynatrace Notebooks to identify which systems were no longer forwarding logs back to Dynatrace. This newfound visibility enabled the kiosk management team to focus their recovery efforts effectively.
To see an example of how to use DQL to find when BSOD issues are being written to Windows system logs, see the blog Crowdstrike BSOD: Quickly find machines impacted by the CrowdStrike issue by Dynatrace Principal Solutions Engineer Josh Wood, Ph.D.
4. Real user monitoring to understand business impact
Real User Monitoring (RUM) offers comprehensive insights into user experiences across web, mobile, and custom applications. By capturing user sessions, RUM provides a detailed view of user journeys, helping businesses understand critical actions for conversions.
When an incident occurs, Dynatrace automatically generates a problem notification. Davis AI analyzes details from the front end to the backend to identify the root cause, severity, and impact of the issue.
Dynatrace RUM also tracks application downtime, enabling organizations to calculate the cost of business interruptions and account for lost revenue. RUM offers flexible options for tracking and reporting key information, such as conversion goals. Examples include successful checkouts, newsletter signups, or demo requests. By monitoring conversion rates, businesses can estimate expected revenue to better understand the financial impact of an incident and help organizations account for lost revenue.
How Dynatrace RUM helped one company identify the business impacts of the CrowdStrike outage
For example, during the CrowdStrike crisis, a North American mortgage provider received an alert for unexpected low traffic. The problem card helped them identify the affected application and actions, as well as the expected traffic during that period. This allowed them to prioritize remediation efforts on their most critical services.

5. Using SLOs to verify recovery
Service level objectives (SLOs) are essential for maintaining and enhancing the performance of applications and services, especially during and after a crisis. Dynatrace makes it easy to create, capture, and visualize SLOs in real time. Establishing and monitoring SLOs can play an instrumental role before, during, and after a crisis.
- Before a crisis. Setting up SLOs for mission-critical services helps establish and maintain standards for availability and performance. Dynatrace AI continuously monitors these benchmarks, allowing teams to identify and address potential issues proactively.
- During a crisis. SLOs provide real-time monitoring and immediate feedback on service performance. Dynatrace AI can quickly pinpoint the root cause of issues, enabling swift resolution and minimizing user impact.
- After a crisis. SLOs ensure that application performance returns to the same standard of performance as before the incident. They play a crucial role in post-incident analysis, helping teams understand the business impact of the incident and implement improvements to prevent future occurrences.
By implementing Dynatrace SLOs, organizations can ensure robust performance management before, during, and after a crisis, leading to more resilient and reliable services.
Prepare for any crisis with observability and the right capabilities
The recent CrowdStrike crisis has highlighted the critical need for robust monitoring and observability tools. For organizations navigating disruptions, observability is crucial for rapid detection and remediation. Dynatrace offers comprehensive solutions with real-time data, synthetic monitoring, DQL querying capabilities, real user monitoring, and SLOs. These tools empower organizations to maintain stability, swiftly identify and resolve issues, and ensure the continuity of essential services.
The real-world examples of our customers demonstrate how Dynatrace monitoring solutions have enabled organizations to recover quickly and maintain operational stability, ultimately safeguarding their customer experiences and bottom lines. As we continue to lean heavily on technology for day-to-day operations, observability will be essential for navigating the complexities of an increasingly digital world.
Using Dynatrace, organizations can not only react fast to mitigate the immediate impacts of crises but also be proactive and build resilient IT infrastructure that’s prepared for future challenges.
Contact us to learn how you can gain the same situational awareness and responsiveness that enabled these customers to recover so quickly from the CrowdStrike outage.


Looking for answers?
Start a new discussion or ask for help in our Q&A forum.
Go to forum