Dynatrace custom dashboards can now be cloned and shared. Time-frame selection and support for simultaneous use of multiple dashboards are now also available.
Different needs, different dashboards
Modern digital businesses are application-based. Businesses rely on applications to deliver services and to automate and optimize sales, marketing, customer relations, and more. The thing is, every application is different. They feature varying components, resources, connected services, and infrastructure deployments. Not to mention, every application development and operations team is different. This is why Dynatrace has long offered a fully customizable home dashboard.
Multi-dashboard support
Dynatrace dashboard management is simple. You’ll find a new Dashboards entry in the Dynatrace menu. This link takes you to your Dashboards page where you can easily create, modify, delete, and switch between dashboards.
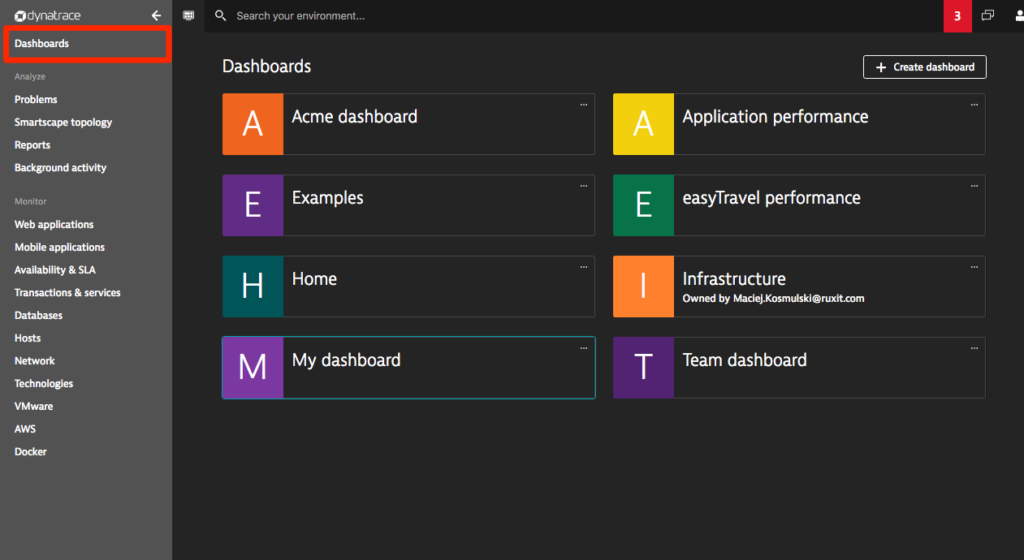
To create your own dashboard, click Create dashboard, type a name for the dashboard, and click Create.
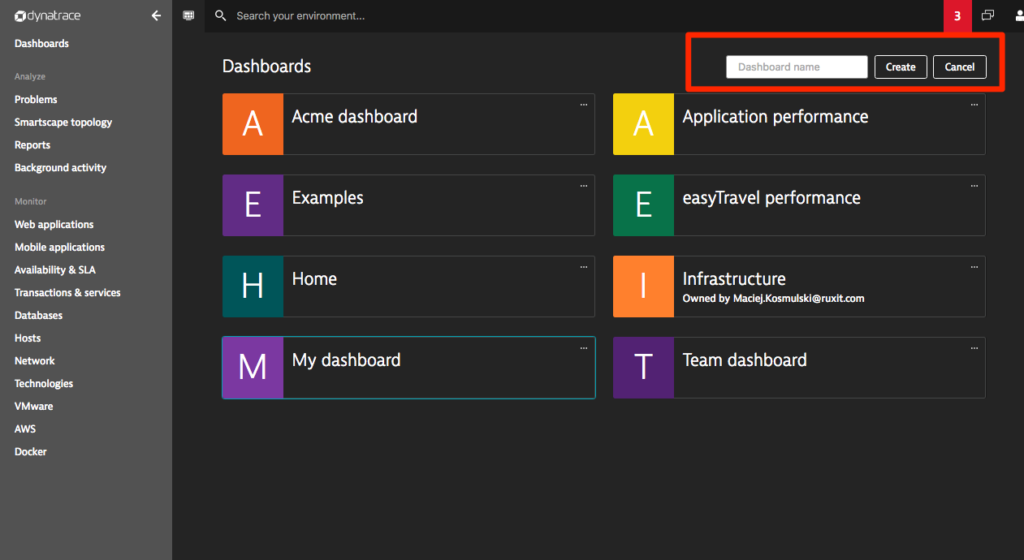
Here’s an overview of the major changes:
- The new Time frame selector enables you to switch between different time frames. You can set a different default time frame for each dashboard.
- Dashboards can be shared or cloned.
- You can operate multiple dashboards in multiple browser tabs at the same time.
- The Add tile and Add section buttons have been moved into the dashboard context menus.
Time frame selector
You’ll find dashboards to be even more useful now that you can adjust the analysis their time frames. The new Time frame selector enables you to select a specific analysis time frame for each dashboard.
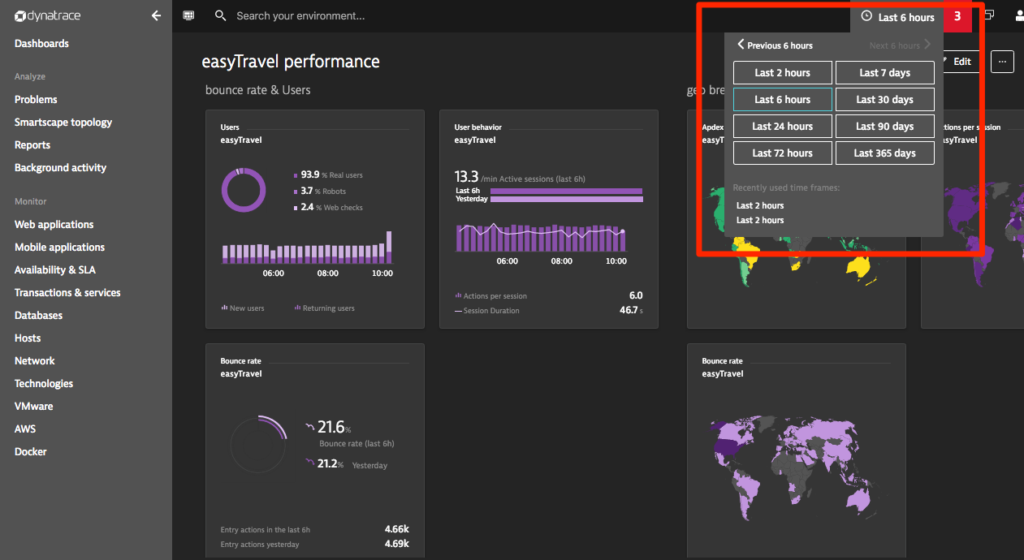
You may need varying default analysis time frames for your dashboarding purposes. For example, you can set a default time frame of Last 7 days for your Real user monitoring dashboard and Last 2 hours for your Infrastructure health monitoring dashboard. You’ll find each dashboard’s Default time frame button when in edit mode.
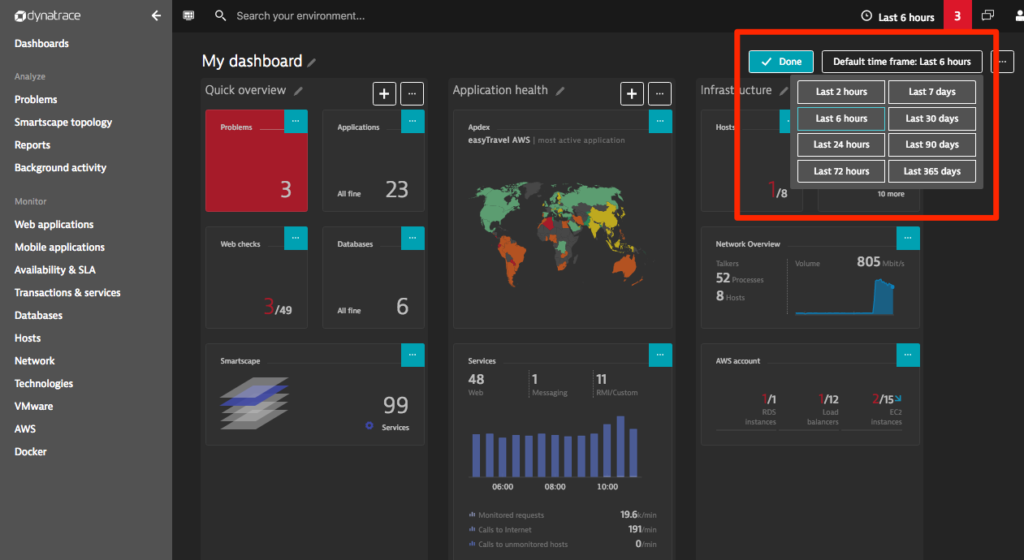
But that’s just the beginning! Read more about the new Time frame selector.
Share your dashboards
Ever wanted to share a custom dashboard with your team or management? Now you can. Just select Share dashboard from the context menu, copy the provided link, and share the link with team members who are logged into their own Dynatrace accounts within the same Dynatrace environment. Dashboards cannot be shared publicly or across environments.
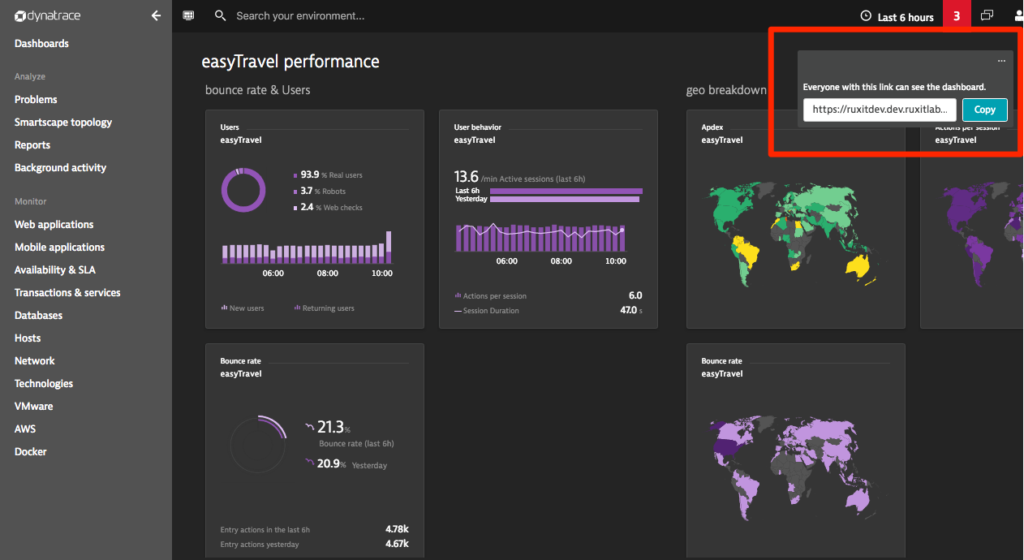
Only dashboard owners can modify and delete dashboards, so you don’t have to worry about other team members changing your shared dashboards. Team members only have read-access, which enables them to clone dashboards.
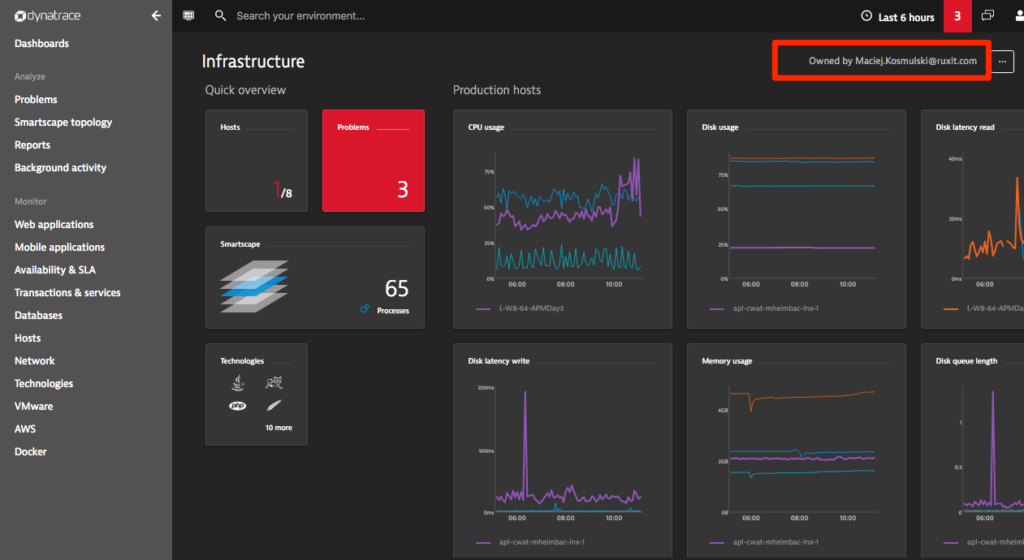
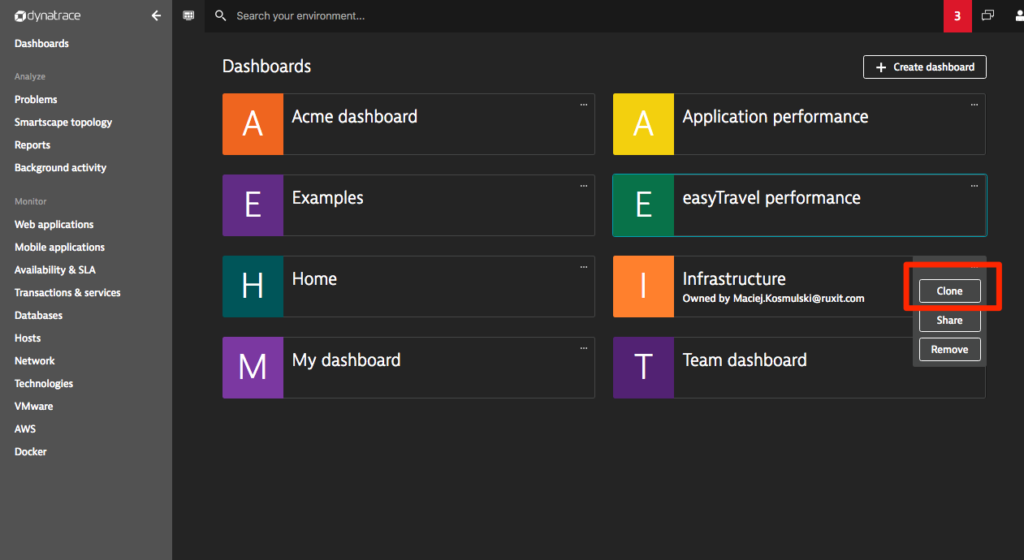
When you receive a custom dashboard that you want to modify, clone the dashboard. As the owner of the cloned dashboard, you can now modify it any way you want.
Multiple dashboards, multiple tabs
With a few dashboards at your fingertips, you may feel the urge to have all your dashboards available at once in multiple browser tabs. Go for it! This is perfectly okay.
Home dashboard
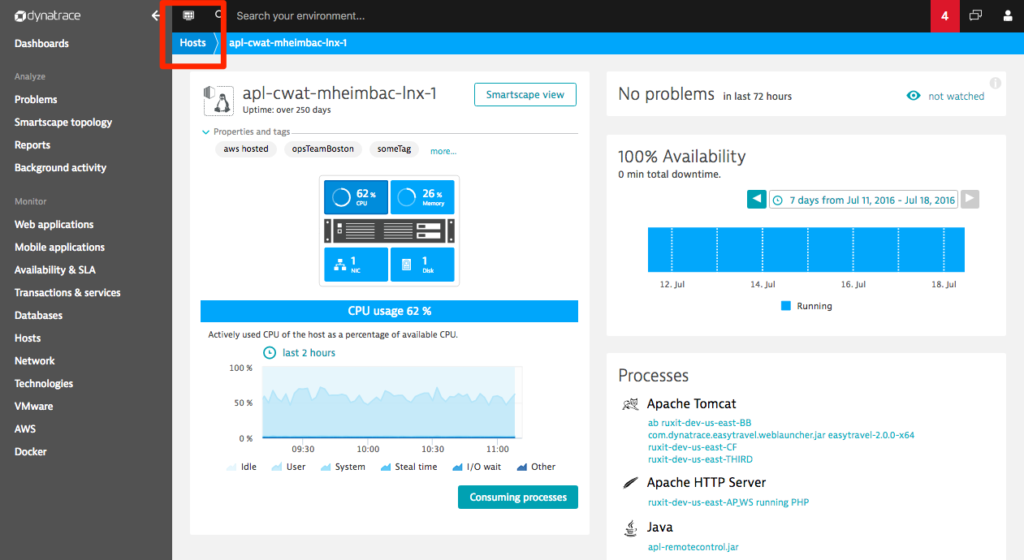
You may have noticed that we’ve eliminated the “Home” entry in the breadcrumb navigation (see below). The new Home dashboard button is all you need now to return to your home dashboard whenever you want. To illustrate the value of this feature, imagine that you’ve drilled down through a few pages in the course of investigating the root cause of a problem. To return to your home dashboard, just click the Home dashboard button. This leads you right back to the dashboard you opened in the current browser tab.
As always we’re eager to hear your feedback. Feel free to share your thoughts with us.


Looking for answers?
Start a new discussion or ask for help in our Q&A forum.
Go to forum