One of the big keys to success when moving into DevOps cloud environments is the augmentation of human efforts with automated tools and IT. That is: identifying areas across the DevOps tool chain that will have a positive impact through the removal of manual efforts, and a push forward for quality and speed. In a IDC’s “Worldwide Developer and DevOps 2018 Predictions”, it cites that by 2022 – just four years – 50% of standard developer’s tasks will be automated.
My colleagues, Andi Grabner (@grabnerandi) and Mark Tomlinson (@mtomlins), both performance advocates at Dynatrace and PayPal respectively, have been discussing various best practices around DevOps tool chain automation over the last six months, in webinars, and most recently at Dynatrace’s Perform user conference in January. In this blog, I’d like to share one of the cool, automated work flows they discuss, that of building continuous performance environments that include ‘performance-as-a-self-service’.
As agile, speed and quality improvements are evaluated across the DevOps tool chain, organizations are looking to automate performance feedback. So, for example, if you were a developer and had a code change, and a performance engineer was not handy, you could “self-serve” this function and keep the flow moving.
Let’s take a look at how that can work using Jira (or any ticketing system) and Dynatrace.

Step 1 and 2: A developer makes a code change and wants to get automated performance feedback. The developer creates a Jira ticket containing information about what type of feedback the developer wants, e.g: throughput, response time, memory consumption.
Step 3: Via a Jira ticket, the new request gets picked up automatically by the fully automated self-service process. A build including the recent code changes gets triggered; a Docker image, tagged with all relevant information, ties back to the Jira ticket. In this example tagged with a temporary version number “tmp57”.
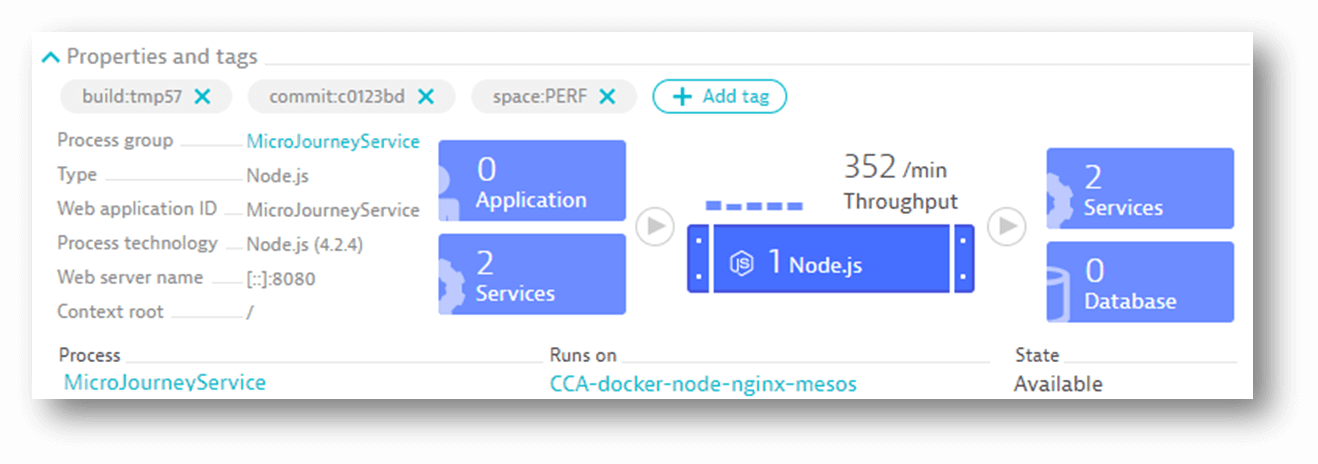
Step 4: Deployment automation tools such as Ansible (or Chef, or Puppet, AWS CodeDeploy, etc.) are used to deploy the Docker image into the performance environment. Here, Dynatrace automatically extracts all the meta data information from the deployed Docker container. This includes the image, the temporary build number, the specific code commit, the deployed environment and so on…

STEP 5: Once the latest container is deployed and now being monitored by Dynatrace, the automated process simply waits for the next automated test cycle to execute. Load testing scripts such as JMeter (Neotys, Gatling, etc.) are scheduled to run on a continuous basis against the deployed containers in the performance environment.
After sufficient load is executed against the new code changes, the Dynatrace REST API or the CLI (Command Line Interface) is used to extract performance metrics that Dynatrace captured. Note: the Dynatrace CLI also provides an easy way to generate HTML reports for individual monitored entities.

STEP 6: On the same Jira ticket requesting performance feedback, the automated process adds the load testing tools (JMeter, Neotys, Gatling, etc.) and Dynatrace results and diagnostics, and assigns the ticket back to the developer.
Performance is now a “self-service” without ever touching Dynatrace (quick adoption, benefit and value – no new tools). Now they can see the Dynatrace data and, for example, can evaluate if there is something odd about the data in Jira – and for more information, click to a link, and go directly to diagnostic details using Dynatrace. One-stop easy.

This is optimizing performance engineering by automating familiar tools in the software delivery pipeline. The benefits:
- You work within your current, familiar DevOps tooling, no need to learn new tools.
- Developers work independently without the need for performance engineers, communication and coordination.
- Automation returns feedback results with links to drill down for further diagnostic information.
- Automation removes bottle neck of waiting, increases developer productivity, and improves development outcomes.
- Like a “marketplace” of a capability, easy and appealing, optimized, on-demand, self-service that can scale productivity across teams.
This is an innovative way to support continuous delivery in a consistent and reliable way, and stays true to the DevOps goal of code moving across the pipeline with more automation and less, or minimal, human intervention.
For more information on performance-as-a-service and other great tips, check out this live event replay “DevOps in the Real World with a focus on Shift-Left Performance” and read-up on Andi’s additional learnings in his blog “Unbreakable DevOps Pipeline: Shift-Left, Shift-Right & Self-Healing”.
Lastly, if you liked the information shared in this blog, please join us and register for an upcoming webinar “How PayPal & BARBRI are Managing the New Landscape of IT Complexity”.


Looking for answers?
Start a new discussion or ask for help in our Q&A forum.
Go to forum