Dynatrace broadens its Digital Experience Monitoring capabilities by adding Flutter support, so you now have full visibility into how your users experience your Flutter apps, from user interactions all the way to your back-end services.
If you want to use the Google UI toolkit to build natively compiled applications for mobile, web, and desktop from a single codebase, Flutter offers a mobile development model that allows you to do just that. Today, the production apps of many big companies use Flutter, which has a steadily growing community of developers.
However, with the ever-expanding number of device types, device resolutions, and third-party resources, it’s challenging to ensure that your app works perfectly across all deployments. As a Flutter app owner, you want to ensure your app’s success, so you need quick answers to questions such as “Is the login fast enough?”; “Do we provide a great user experience for premium customers?”; or “How is the third-party service across regions?” As a developer, you might want to quickly find and analyze errors and crashes to make sure they don’t recur. For all this, you need full visibility into how your users experience your Flutter app and you need to see the complete picture, from the user interactions all the way to your back-end services.
Dynatrace broadens its Digital Experience Monitoring capabilities by adding Flutter support
With the release of Flutter support in Dynatrace, we’re filling a gap that no other solution in the market has addressed, enabling you to leverage the full power of Dynatrace Digital Experience Monitoring for Flutter apps. The Dynatrace Software Intelligence Platform already supports a wide range of mobile development frameworks, from native Android, native iOS, iPad, tvOS, Cordova, Xamarin, to React Native. By adding Flutter support, we’re giving you more freedom to choose what best fits your use case and available resources. Read on for details on Dynatrace Flutter support capabilities and how to get started with Flutter app monitoring.
- Let Dynatrace Davis® AI alert you to detected anomalies in usage patterns
- Improve mobile user experience by monitoring user actions end to end
- Easily analyze user sessions that are affected by errors and crashes
- Track and improve user adoption of your Flutter app
Ensure great user experience for your Flutter apps
Questions such as “Is the experience great for all our users?” or “Do all critical business transactions work fast enough?” can now be automatically answered when you enable Dynatrace Davis AI to alert you to detected anomalies in usage patterns, such as sudden surges or dips in activity or an unexpected slowdown of a user action.
With Dynatrace, you get end-to-end visibility into each user action, from the user interaction triggered on the mobile device, through the maze of cloud and on-premises services, down to the database statement. This enables you to quickly identify problem areas and improve mobile user experience, thereby proactively avoiding negative user reviews of your app.
As a developer, you might want to quickly find and analyze errors and crashes. Dynatrace OneAgent enables exactly this by automatically detecting crashes in your Flutter app and providing you with all the relevant details, so you can easily analyze the user sessions that were affected by the errors and crashes.
Dynatrace has the ability to understand service dependencies and, moreover, provide insights and alerts based on this understanding. This helps you cut down on manual work, increase automation, and use resources to create value for your users and business.
Let Dynatrace Davis AI alert you to detected anomalies in usage patterns
Dynatrace Davis quickly learns the regular overall usage patterns for your apps. It then calculates baselines for user action occurrences and durations. This isn’t just a simple average—our deterministic Davis AI can discover cyclical patterns like sudden increases on weekends or fluctuations at certain times of day.
When Davis detects deviations from this baseline (for example, a sudden dip in usage or a user action that lasts longer than expected), it generates a problem event, identifies the root cause of the problem, and sends notifications based on the configured alerting profile.
Be sure to fine-tune the anomaly detection settings for your mobile app so that you can focus on those anomalies that are most relevant to the experience of your end users. And don’t forget to set up notifications so that you’re alerted when an issue requires your attention!
Improve mobile user experience by monitoring user actions end to end
User actions in Dynatrace are more than just simple events. They are opened (or “entered”) and closed explicitly, so they measure the duration of the interaction and hold contextual information, such as web requests that are made while user actions are open.
When you set up user actions in your code, OneAgent automatically links associated web requests to those user actions. With Dynatrace OneAgent running on your back-end systems, you gain an end-to-end perspective through your infrastructure all the way to your back-end method calls and database statements. You can see if user interactions are fast enough, which ones are lagging, and, if they are lagging, immediately determine why.
However even without a monitored infrastructure, you get insights into the resource usage of your own or third-party services, which allows you to compare your estimates with real-world data.
Easily analyze user sessions that are affected by errors and crashes
Maximizing and providing the best possible user experience is the top requirement of all mobile apps—and the top priority for app developers. Today’s mobile users expect apps to work flawlessly, regardless of where and how the app is used.
Dynatrace OneAgent automatically detects crashes with all relevant details. You can see crashes grouped by cause, but, most importantly, crashes are linked to user sessions, so you can quickly find out what your users did before the crashes occurred.
Track and improve user adoption of your Flutter app
Even the slickest app you build is useless if your users don’t use it. To help you measure and improve adoption, each time a user starts your app on their device, Dynatrace registers an app start, increases the user count, and notes basic device data. This provides you with a solid overview of your app’s adoption and the technical landscape of your user base.
How to get started
OneAgent for mobile apps is specific to iOS and Android. The Dynatrace Flutter plugin handles the installation and configuration of OneAgent for each platform. Additionally, it exposes API calls to the Flutter code and forwards these API calls to OneAgent for iOS/Android.
The first step is to set up a mobile app in the Dynatrace Web UI. A Dynatrace mobile app is set up initially as a generic mobile app, regardless of framework or platform.
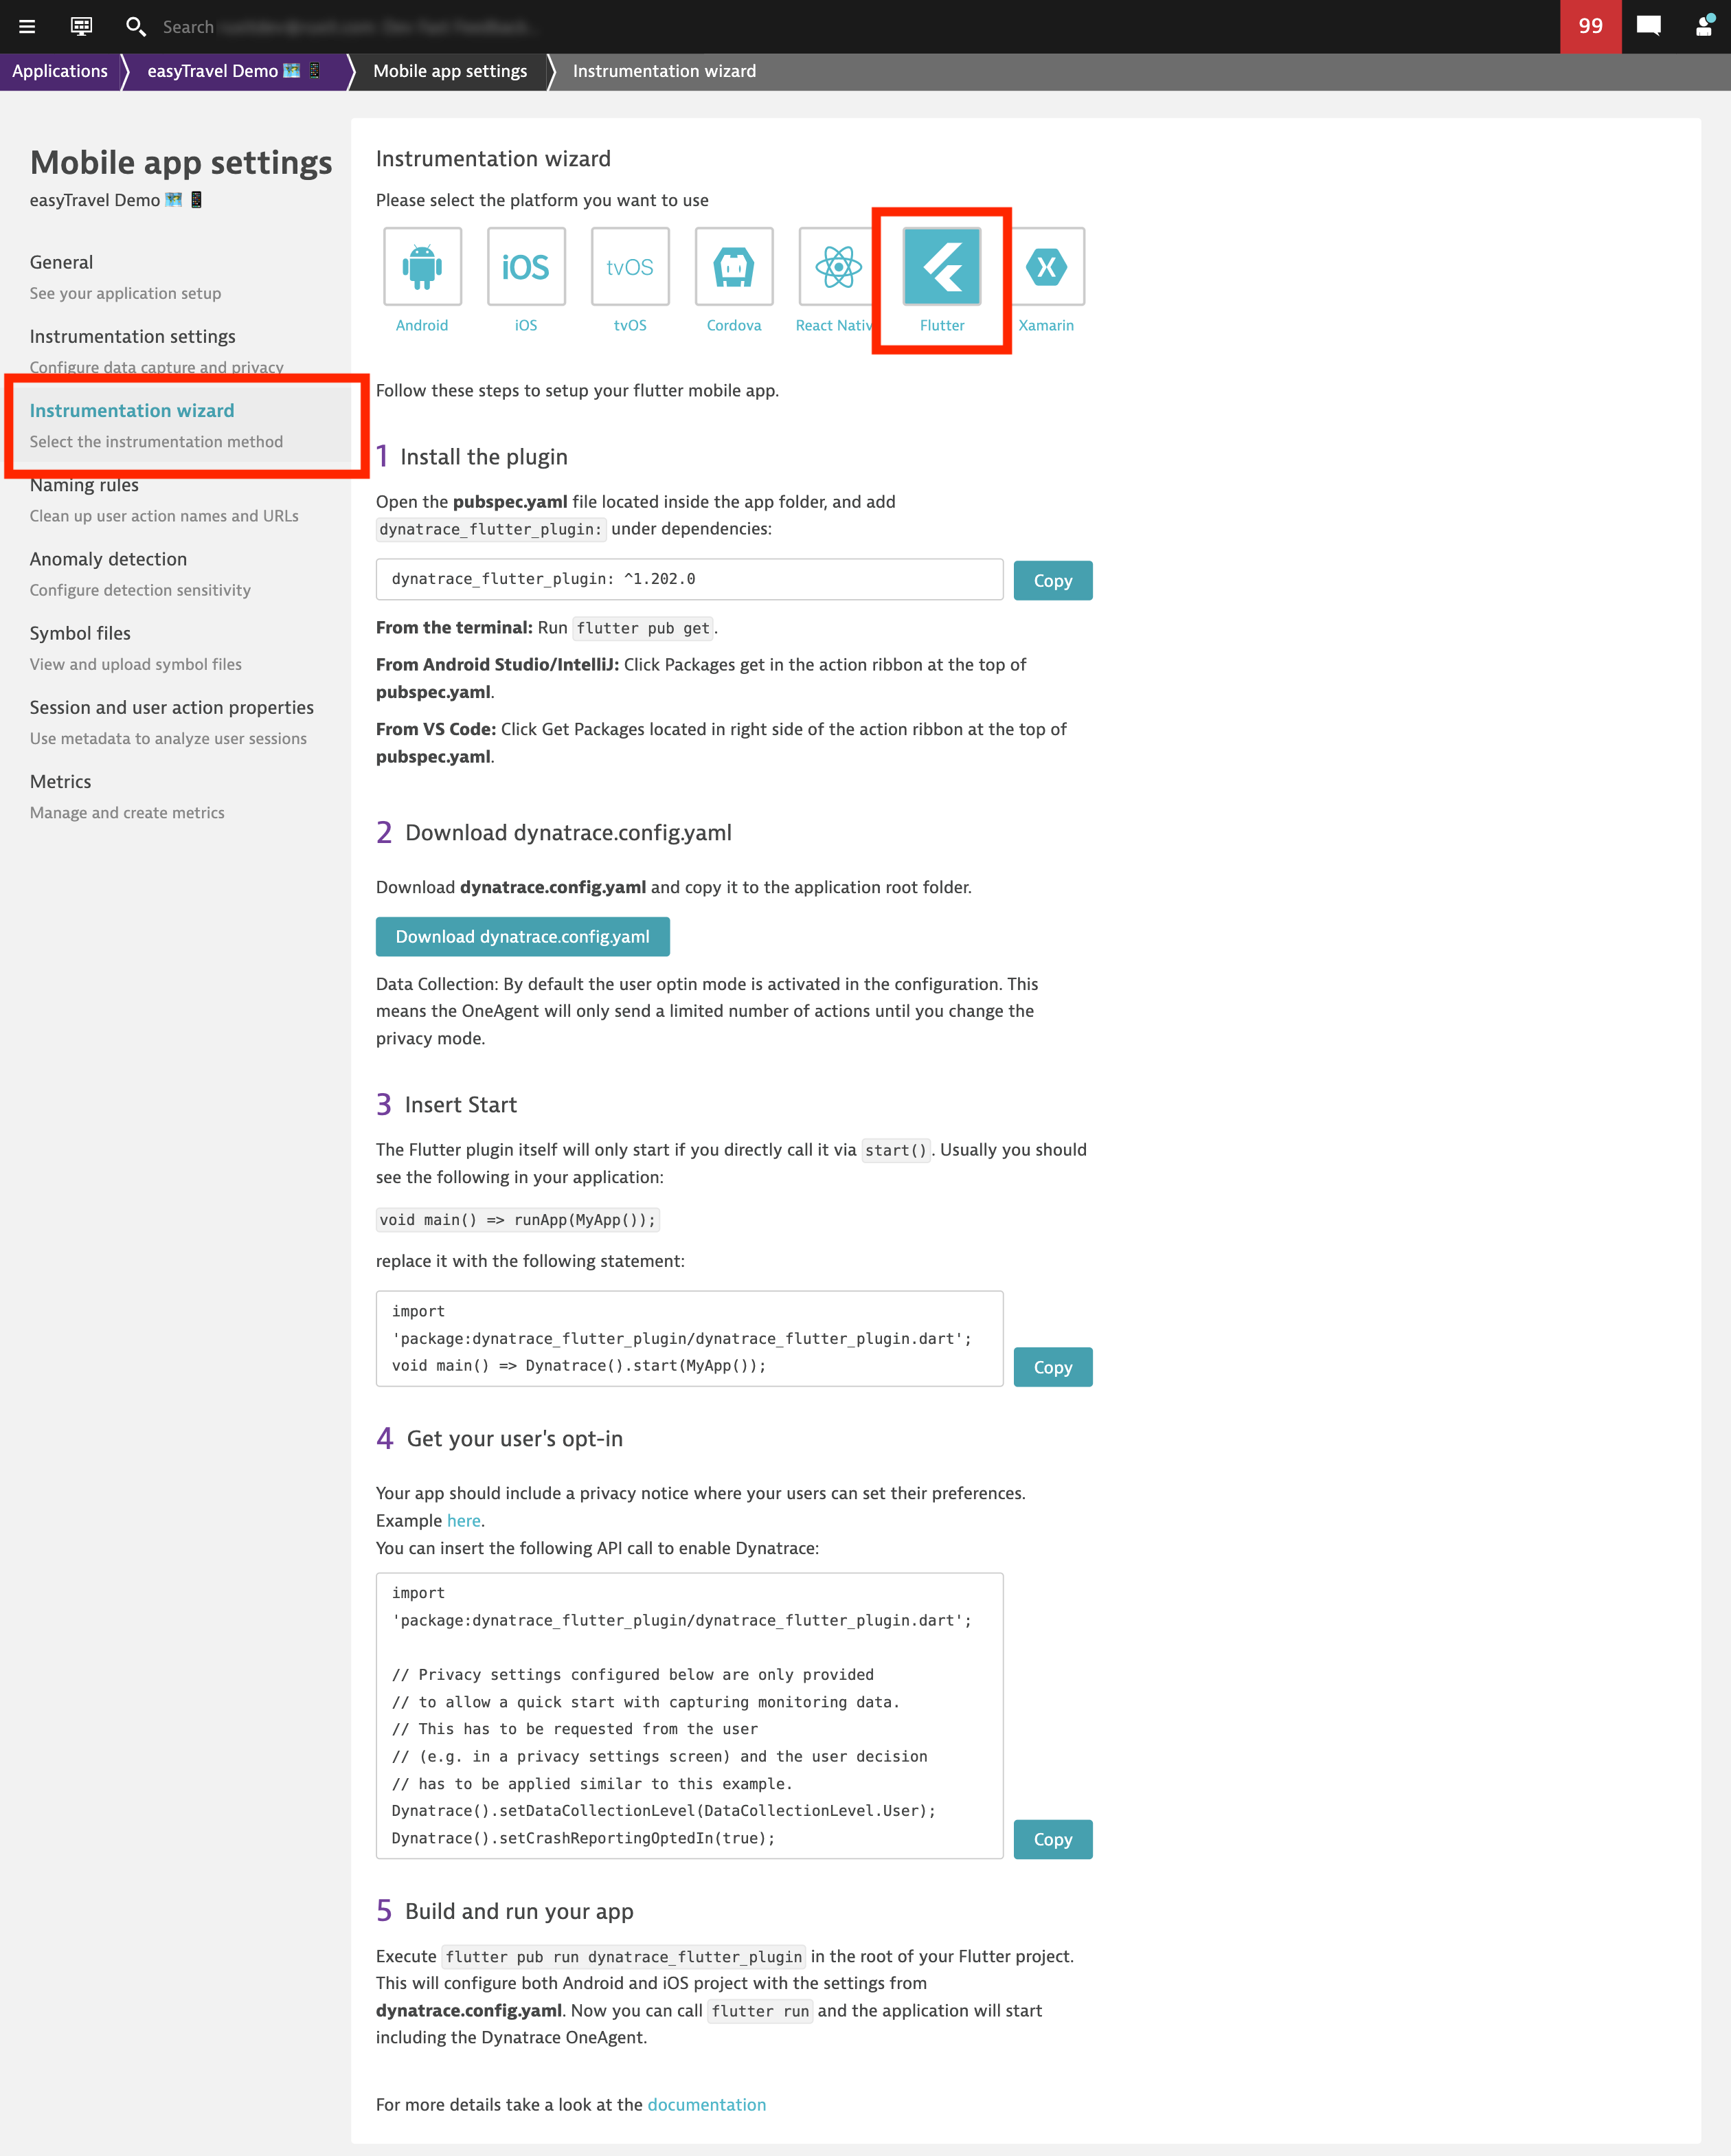
Once you set up your mobile app in Mobile App settings, select Instrumentation wizard. Then choose Flutter as the deployment platform, as shown below.

The five steps outlined in the wizard guide you through the instrumentation process:
- Install the plugin by including it as a dependency and updating the dependencies with the package management solution of your choice.
- Download the configuration YAML file, which contains all relevant keys for the plugin itself and for the plugin to forward communication to OneAgent for iOS or Android.
- Change the main entry code line so that the Dynatrace plugin is called via
start()and can handle the instrumentation. - Set the opt-in level right away or give your users the choice to set the level according to their preference (recommended).
- Apply the configuration changes to the project by running
flutter pub run dynatrace_flutter_pluginfrom the command line.
Once you’ve stepped through this process, call flutter run as you normally would to start the application; the plugin handles everything else for you.
If any configuration keys change, you need to redo steps 2 through 5 to apply the changes.
Test Flutter monitoring with our demo app
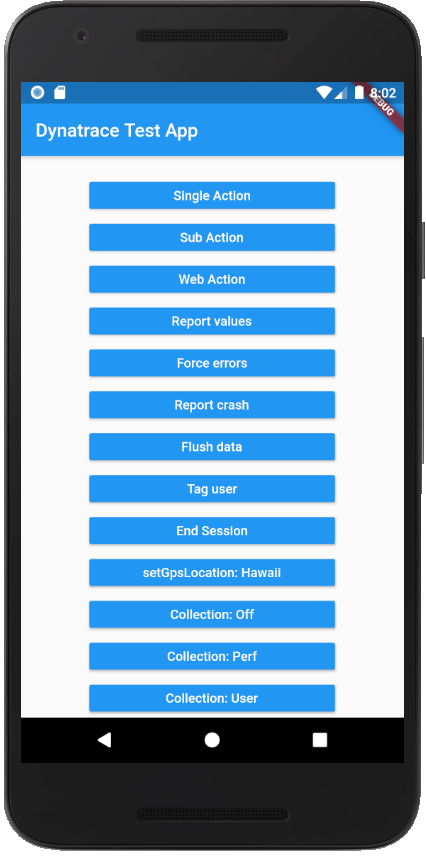
To get you up to speed quickly and to test Dynatrace easily, we provide a small Flutter demo app. This single-page app offers a variety of options for manually generating monitoring data and observing the data in the Dynatrace web UI. To circumvent the resource-efficient collection approach that sends data only every 2 minutes, put the app into background mode. This flushes the cache on the Dynatrace Cluster; you should see events in the web UI shortly thereafter.

What’s next
With Dynatrace support for Flutter, Dynatrace provides solid coverage for a popular choice in mobile app development. We’ll continue to expand this coverage by keeping up with the latest Flutter releases, support for new features, and refinement of the monitoring approach.
For mobile app monitoring in general, we will follow up with improvements in crash management. Additionally, look out for our upcoming blog post on user session and user action properties for mobile app monitoring.


Looking for answers?
Start a new discussion or ask for help in our Q&A forum.
Go to forum