
Purpose-built foundation for agentic AI
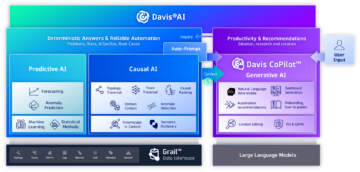
The unique combination of causal, predictive, and generative AI techniques empowers businesses to foresee obstacles, foster innovation, and deliver unparalleled adaptability.
Predictive AI: Forecast
Provides continuous forecasting and anomaly prediction across multidimensional baselines, application traffic and service load, all seasonality and pattern aware.
Causal AI: Determine
Analyzes observability and security data in the context of topology information: groups anomalies, pinpoints root causes, and prioritizes based on business impact automatically and ad hoc.
Generative AI: Create
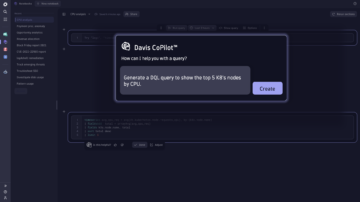
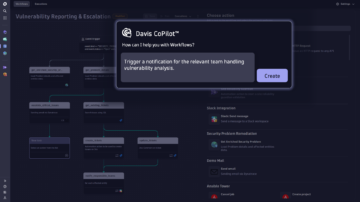
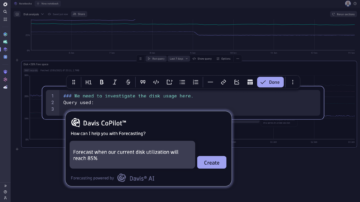
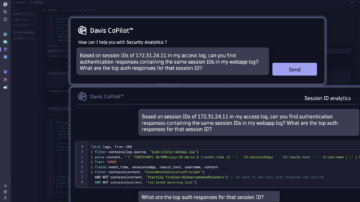
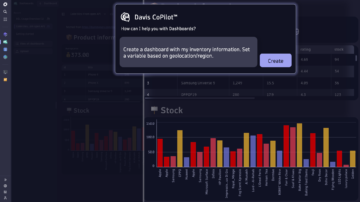
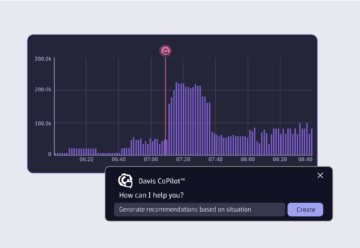
Fueled by predictive AI and causal AI, Davis CoPilot creates queries, notebooks, and dashboards to simplify analytics, and provides workflow and automation recommendations.
AI-powered insights, enabling advanced agents
Davis AI at the core of the Dynatrace platform empowers countless use cases by utilizing Grail’s instant query power, real-time topology data from Smartscape and intelligent automation powered by AutomationEngine.
Automatic root-cause analysis
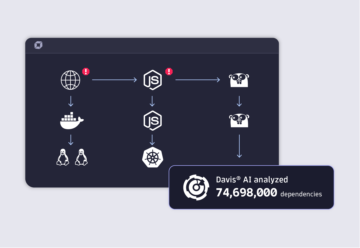
Dynatrace Davis detects and analyzes the root cause of problems.
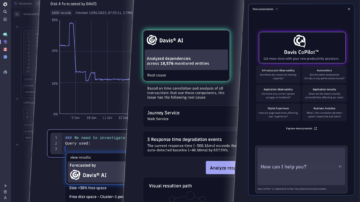
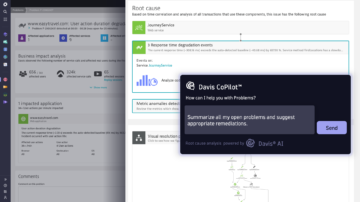
Davis automatically detects customer-facing issues and uses topology, transaction, and code-level information to precisely pinpoint the root cause of problems. Davis CoPilot recommends actions to take for problem remediation.
Predictive operations
Ensure reliable operations by catching and avoiding issues proactively – completely automatically.
Davis AI allows you to run forecasts with automatic anomaly prediction (e.g. predictive disk resizing, predictive autoscaling resources), generate reports and take action automatically, from informing the respective teams to triggering orchestration.
Auto-generated quality checks
Define quality objectives in the code and get it validated throughout the delivery process before the code reaches production using Dynatrace Site Reliability Guardian.
Davis AI applies machine learning, anomaly detection, and root cause analysis to make this easy. Davis CoPilot creates guardians for specific services with natural language input.
AI-assisted onboarding and platform use
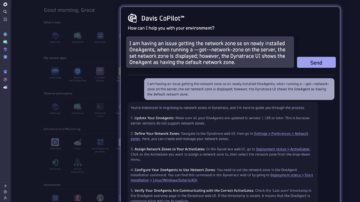
Just tell Davis CoPilot what you want to achieve, and it will provide the right path.
Whether you want to observe additional technologies, apply advanced configurations with one sentence, or leverage new capabilities and best practices, Davis CoPilot uses its custom-trained large language model (LLM) to boost your productivity and ensure fast onboarding.
Proven AI
- With Davis AI, Dynatrace has pioneered predictive AI and causal AI since 2014
- The world’s largest enterprises use Dynatrace to observe and get insights into applications and infrastructure at scale
Immediate insights
- Davis AI, together with other core technologies, provides immediate and continuous insights
- With zero configuration, Dynatrace can be deployed to tens of thousands of hosts in hours
Precise answers out of the box
- Auto-baselining, anomaly detection, automatic root-cause analysis, business impact analysis, AIOps automation
- All informed by real-time dependency and topology mapping.
Custom-trained LLMs
- Leverage large language models (LLMs), optimized and custom-trained for observability, security, and business use cases
- Use real-time dependencies and actual cause and effect relationships to get highly relevant answers and recommendations
Purpose built AI
- Combining predictive AI, causal AI, and generative AI, Davis AI transforms and augments data for precise predictions, determinations, and insights
- Use real-time dependencies and effect relationships to obtain answers and recommendations for observability, security, and business use cases
AI for everyone
- Unlock powerful analytics for new audiences using natural language input
- Simplify data analytics with queries, notebooks and dashboards, effectively drive automation and accelerate onboarding
Related content
 BlogDynatrace expands Davis AI with Davis CoPilot
Dynatrace announces the expansion of Davis AI with generative AI capabilities. DocumentationDavis documentation
Learn how Davis automatically detects performance anomalies in your applications, services, and infrastructure.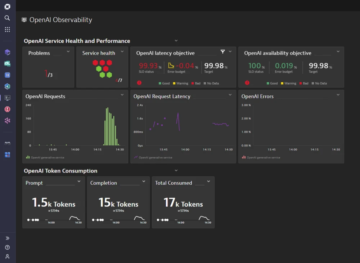 BLOG POSTMonitoring OpenAI ChatGPT
Learn how Dynatrace automatically collects OpenAI/GPT model requests and charts them within Dynatrace. BLOG POSTAutomate predictive capacity management with Davis AI for Workflows
This blog post introduces Davis AI for Workflows, showing you how to fully automate prediction and remediation of your future capacity demands. BLOG POSTDavis AI: Your personal interactive troubleshooting assistant
This blog post explains how Davis can help reduce your MTTR using interactive user guidance that retains context when drilling deeper into problem analysis. BLOG POSTForecast IT capacity with Dynatrace Grail and Davis AI
Anticipatory management of cloud resources within highly dynamic IT systems is a critical success factor for modern companies.
