Guest blog from Adrian Gonciarz, Lead QA/SRE at Kitopi, in collaboration with Wolfgang Beer and Andreas Grabner (both Dynatrace).
At Kitopi we are satisfying the worlds’ appetite by running a high-tech powered network of cloud kitchens. But life in the digital kitchen business is not always easy. To keep our customers happy, we are constantly monitoring and reacting to any situation that makes a hungry customer angry instead of satisfied.
Our business saw tremendous growth over the past 2 years and with that growth, we saw the need for better observability of the end-2-end kitchen delivery workflow. That includes tracking every step from placing an order, tracking the status of the preparation process, delivery of the food to the customer as well as measuring the food quality based on the feedback from our happy eaters. And not to forget – besides our orders we are also monitoring the kitchen itself such as whether a kitchen is currently open and operating or how the internet connectivity to the central servers is.
To cope with these observability challenges, we had to upgrade from a do-it-yourself (DIY) to leveraging the Dynatrace Software Intelligence Platform. Our goal from the start was to not only use Dynatrace for infrastructure (e.g.: internet connectivity stable) and application monitoring (e.g.: kitchen ordering portal available). We wanted to expand and provide business process metrics (# of total orders per restaurant, orders canceled ratios, time per order, ingredients in or out of stock …) to quickly react to any issues and also get automatically alerted on anomalies. And as we are experts in digital kitchens, we focus on what we are good in and let Dynatrace focus on what it is good in!
It turned out Dynatrace was the right decision due to its flexibility in combining its OneAgent full-stack metrics with external metrics we extracted from business events we sent through Apache Kafka. We are now at a stage where Dynatrace gives us visibility into problems we were not aware of before and thanks to automatic alerting we can react much faster to those problems. This helped us reduce MTTR (Mean Time to Resolution) which you can see below:
- Closed Restaurant Issue: 15% faster MTTR and 50% better visibility
- Rejections and Cancellation of Orders (our Code Red): 30% faster MTTR and 50% better visibility
- Kitchen System Outages: 10% faster MTTR and 70% more visibility
While this is already a good first win, we are expanding our work with Dynatrace to also get the root cause of problems, e.g.: is it due to challenges in the order process, the preparation, or in our delivery to the end-user. This will help us reduce MTTR even more:

In this blog, I want to walk you through the learnings during our POC (Proof of Concept), what solution we have in place right now and what future ideas we have.
Kitopi’s architecture relies on Apache Kafka
Kitopi is a very dynamic system that handles a high volume of food orders coming in from various sources, e.g.: websites, mobile apps or even 3rd parties that leverage our API to push orders. Our engineers decided to build an event-driven system where event producers send order state and state changes to a specific Apache Kafka topic. Event subscribers on the other hand can track status changes and push it to the interested party, e.g.: push the order status to the mobile app that our customers use to give them an update about whether their order is ready for pickup already.
Another key component to our architecture was extracting aggregated data to get a better overview of current system health and performance. To do that our developers use frameworks such as Micrometer to expose their own metrics (e.g.: accepted orders by restaurant or number of failures of delivery). Those metrics get captured through Prometheus and charted using Grafana.
So – what was missing? Why did we go to Dynatrace?
Step 1: Dynatrace Out-of-the-Box Observability vs Custom Metrics
We started our journey with Dynatrace because our goal is to leverage the Dynatrace Davis deterministic AI engine. As we further scale our business, we simply needed a better-automated approach to detecting problems and pointing us to the root cause. Asking developers to put in more custom code to push metrics and then having Ops Teams look at more Grafana dashboards would be a limiting factor for scale!
In our initial POC, we quickly learned that Dynatrace automatically picked up all our exposed metrics through Micrometer. This was great, but we also found that our current Micrometer implementation exported metrics with lots of different data dimensions. In Dynatrace this started to consume a lot of Davis Data Units (DDUs). While this seemed like a problem in the beginning, we quickly realized that Dynatrace’s out-of-the-box metrics were covering most of the metrics and dimensions our developers custom exposed via Micrometer. So, we decided to go with the out-of-the-box support as this data immediately gave us better problem detection and root cause analysis, it didn’t consume the extra DDUs AND our developers no longer needed to maintain the extra code needed for their Micrometer metrics. Let’s call it a Win-Win-Win situation!
Step 2: Prototype Extracting Business Metrics from Kafka
In 2021 we decided to create a “Command Center Unit”. That’s a team specialized in dealing with any operational issues that are impacting our business goals. Our idea was to give them simple and reliable data visualization and automatic alerting that could improve their daily work of keeping those kitchens operating with the best business outcome. That team demanded operational business metrics such as the number of incoming orders per country, rejected orders per restaurant, failed delivery by region, etc.
We knew all this information is already in those events our system sends through Kafka topics. All we had to figure out was the best and easiest way to extract business-relevant information from those events and send it to Dynatrace as a metric.
We decided to start with a very simple metric to prove that this is possible. That metric was: the time span for which a particular restaurant is CLOSED. This metric tells us if a restaurant for instance gets closed due to an operational issue (too many orders, missing ingredients, …). If a restaurant stays closed for too long it’s something we want to escalate.
In talking with the responsible development team, we learned that the event on a specific Kafka topic looked something like this:
{“name”: “The Wonderful Foodies”, “timestamp”: “2022-01-01T14:11:59Z”, “status”: “ON”, “id”: “foobar123”}
The status field carried the information whether the restaurant was open (ON) or closed (OFF). We decided to try Kafka Streams, where the constant flow of events allowed us to implement the following logic:
- When a message with status OFF is received for restaurant X, add restaurant X to Closed Restaurants Table (key: name, value: timestamp)
- When a message with status ON is received for restaurant X, remove restaurant X from Closed Restaurants Table
- Every minute iterate over Closed Restaurants Table and for each restaurant produce a Dynatrace metric (value: seconds since closing, dimensions: restaurant name)
While it sounded easy, it took some Python coding and using the Faust Streaming library (that’s the community version of Faust library). We learned quite a bit about streaming Kafka messages and how to aggregate data in Tables. But – we didn’t just aggregate event data in a table. We also had to keep track of the closing timestamp when we received status OFF and had to delete that table entry when the restaurant opened (ON). The time difference between when those two events were sent could also range from hours to days. Really what we needed was a counter of the closing time (in seconds) per restaurant at any given time with the additional information on how long they were closed already. All of this in a 1-minute resolution so that we get up-2-date information. With a little hack on the Faust stream, we managed to force the table to recalculate every minute. Job done!
After we had the state in the table, we just had to use the Dynatrace API Python Client to push this data as custom metrics to Dynatrace shown here:

Step 3: Maturing our Prototype to produce any business metric
After proofing that this new insight helped our operations team, they asked for more. We wanted to get insights to detect any failures along the delivery order process which meant extracting and aggregating more metrics from other Kafka streams.
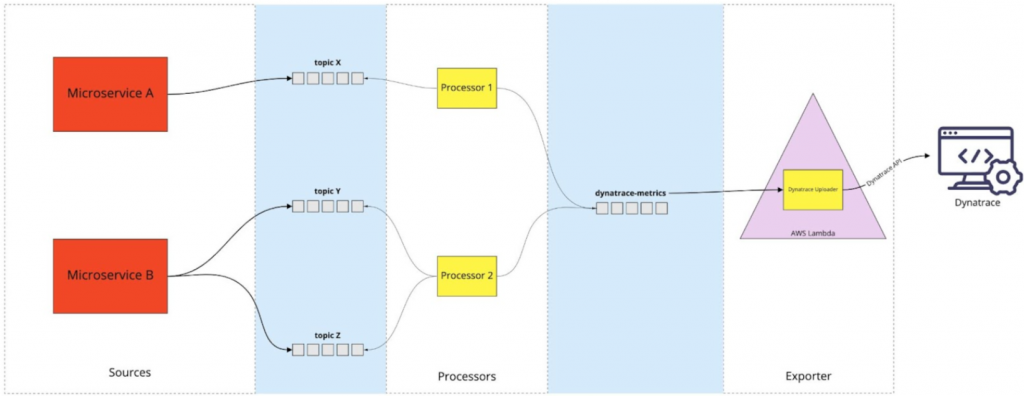
While our prototype worked well for our restaurant ON/OFF use case it wasn’t designed to scale easily. We basically built a “monolithic solution” which was extracting & aggregating data from a stream and then sending it off to Dynatrace. To easily adopt this approach for other metrics we had to split that monolith into two distinct parts: Part 1 (=Processing) was specific to the metric as it dealt with subscribing to a specific topic and applying the correct aggregation. Part 2 (=Exporting) on the other hand was the same for all metrics as it was just sending the aggregated data to Dynatrace. The final solution can be seen below but is essentially doing this:
- The processor is responsible for reading and aggregating the data from input Kafka topic(s)
- Aggregated data is sent to an intermediate Kafka topic called dynatrace-metrics with a specific schema
- The exporter is responsible for picking up dynatrace-metrics messages and sending them over to Dynatrace API.
We implemented the processor(s) as standalone Kubernetes apps due to the (semi-)persistent nature of data held in the Stream Tables. To ease up the process of following the schema of the dynatrace-metrics topic we created a small Python library that provides an API for serializing those messages as models.
The exporter turned out to be a great case for a serverless function: Reading messages from dynatrace-metrics topic, batching, and sending to Dynatrace API.

Putting it to Practice: Order creation and rejection metrics
The new approach was implemented, and we immediately put it into practice. Let me walk you through one specific example!
Kitopi integrates with 3rd party food order aggregators sending orders to our system. Upon receiving those orders, they can either be accepted or rejected for multiple reasons.
We sat down with the team whose microservice handles incoming orders. Together we decided that all orders get pushed into a Kafka topic and to additionally push the rejected orders into a separate Kafka topic. When we analyzed the incoming data, we saw that we had about 0.5% of orders rejected. As we wanted to be alerted right away when rejections go up, we decided to use a 1-minute aggregation for rejected orders. For the total orders, however, we thought that a 5-minute aggregate is enough as it gives us all the business insights while keeping DDU consumption low. With those thoughts in mind, we went ahead and created two order-processor apps:
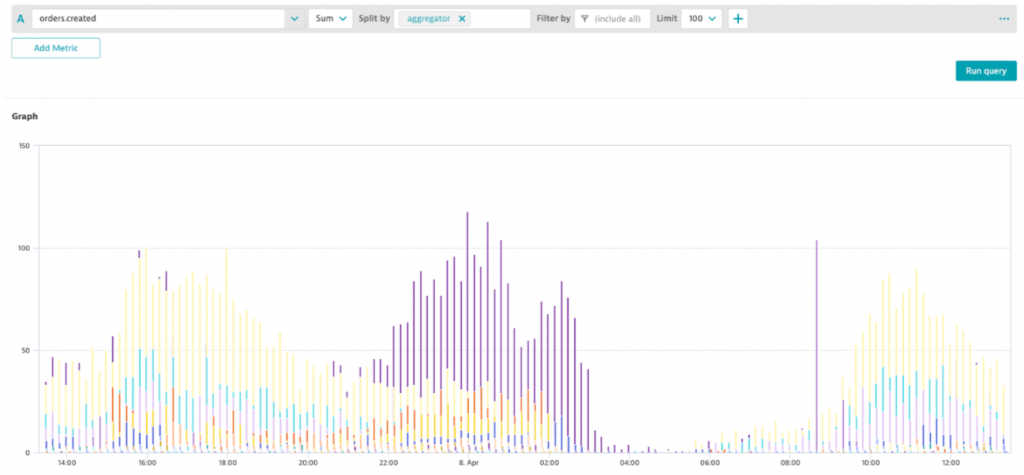
- Total orders worker: Each incoming message increases the counter of orders per aggregator in a so-called tumbling table. This type of table lets us store data in 5-minute windows and aggregate the number of orders per aggregator on window close. Once a window closes a new window opens for the next 5 minutes. A window close also sends the message to the dynatrace-metrics
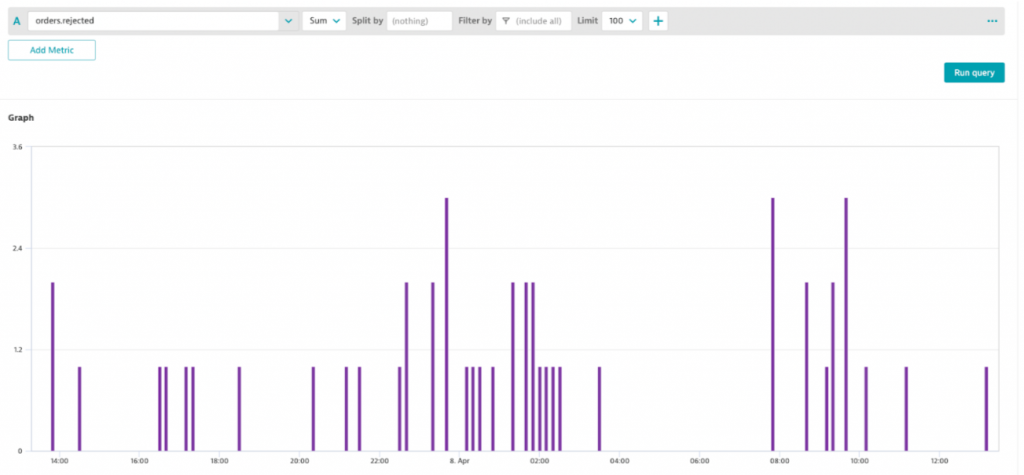
- Rejected orders worker: For every incoming rejected order this processor immediately sends a message to dynatrace-metrics. While we send every data point the Dynatrace Metrics ingest automatically takes care of providing this data in aggregated buckets which makes this super easy to use
Our team can now do business reporting on things like total orders per country, region, restaurant type or dish like shown in the following Dynatrace Data Explorer:

To identify any problematic restaurants, regions or delivery services the team can now also look at the number of rejected orders like shown in this graph:

But this is not the end – it is just the beginning!
Automated Alerting through Dynatrace Davis
As we have all the business data in Dynatrace we can leverage the automatic anomaly detection to get alerted on abnormal behavior of order rejections. Because remember – it is 2022! And in 2022 no ops team should stare at dashboards to manually alert on a spike in rejected orders.
In Dynatrace there are different options to configure anomaly detection on custom metrics. In our case, our teams get automatically alerted if there is an increase in rejections per region, restaurant, dish, or any other dimension we decide to include in the future. Here is what it looks like in the Dynatrace problem details:

The flexible problem notification options in Dynatrace allow us to get those notifications in Slack or pushed to the Dynatrace mobile app. We can also directly send notifications to individual kitchens in case there is a problem with just a single kitchen.
Our Ops Team is in a better place today
Our investment in this project taught us a lot about event handling, Kafka topics, the Faust library, the Dynatrace Metrics Ingest API, and the capabilities of Davis – the deterministic AI. We are now at a place where we can not only provide meaningful business insights but also automatically alert our teams in case there is a problem that results in higher rejection rates of orders. This allows our teams to react fast and therefore ensure our kitchens can truly satisfy the world’s appetite for great food.
Next Steps: Unified Analysis and Automated Problem Remediation
In collaborating with Dynatrace we have seen more potential of improving the work of our teams.
First, we want to start leveraging the latest capabilities Dynatrace has introduced through the Unified Analysis screens where external data such as Kitchen or Order can be viewed and analyzed using the same screens as the Dynatrace screens for Infrastructure, Kubernetes or Application Monitoring. This gives a unique user experience for our ops team regardless of what data they are analyzing
Second, we want to not only alert our teams when there is an increase in rejected orders but automatically trigger a sequence of remediating actions for well-known problems. This capability was introduced through Dynatrace’s Cloud Automation Solution which received those capabilities from the investment Dynatrace has made into the CNCF Open Source Project Keptn.
Stay tuned for more and if you get a chance – try one of the kitchens. Be assured we will know whether you liked it or not 😊


Looking for answers?
Start a new discussion or ask for help in our Q&A forum.
Go to forum