If you’re responsible for the overall performance and success of a mobile application, you likely have many KPIs to measure and monitor, along with business KPI tracking. For example, is your application meeting business goals? Are customers satisfied with the app and leaving positive reviews? What issues are causing users to abandon or uninstall the app? How can you optimize performance and user experience?
To answer these questions for the business as well as work with your mobile developers to prioritize efforts and implement changes, it’s critical to have a single source of truth that provides the operational and business answers you need. An all-in-one software intelligence platform with comprehensive native mobile app monitoring integrated with end-to-end observability meets this need.
This article is part two of the mobile application monitoring series covering the benefits the Dynatrace platform provides for mobile application owners. In the first part, we cover how easy it is for mobile developers to instrument a native mobile application with Dynatrace. Once instrumented, the app immediately starts sending telemetry data back to the platform that application owners can use.
In this second part, we cover how Dynatrace gives mobile app owners visibility into everything they need to know about an app. This visibility includes how users are interacting with it, the user experience, and whether the app is overall healthy, performing well, crash-free, error-free, and providing users across different regions with the same experience. Watch the video below or read on to learn more about the benefits of an end-to-end platform for mobile app owners.

When it comes to mobile app development, it’s vital that owners get the full picture. For example, teams can further segment the telemetry data captured from a mobile app based on operating system, device, region, app version, and other custom metrics, to provide more granular insights on users and their behavior. With this information, app owners along with mobile developers and UX leads can make critical decisions, such as where and how to enhance user journeys to continuously improve their overall offering on their mobile channels.
Use cases from the banking industry illustrate the importance of mobile app monitoring
Mobile apps have increased in importance across most industries. Take banking for example. Now, and especially with the increase in digital demand activity due to the pandemic, many people are reluctant to go to bank branches for frequent and common banking transactions. In addition, many use mobile apps almost exclusively instead of their web counterparts. So, it is imperative that app owners have complete visibility and automatic, contextual analysis to know exactly what their users encounter when they navigate through their primary channel for managing their finances.
Using Dynatrace as an end-to-end platform for mobile monitoring, one of Peru’s largest banks was able to increase revenue by almost 40% within a quarter, with the single biggest contributor being increased transactions on their mobile channel by 30%. With an improved and better-performing app, usage went up by 250% over a span of just 6 months. They accomplished these improvements by increasing visibility into business goals, building up customer satisfaction, and raising adoption levels of Dynatrace capabilities within the organization, which also fostered collaboration across different teams.
Tracking every mobile user interaction
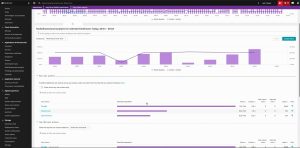
Out-of-the-box, Dynatrace provides experience metrics using Apdex ratings to illustrate how users are experiencing a particular application. Application owners can observe over time to understand how many users are interacting with the application. They can also see when new users adopt newer versions of the application as they roll out on the Apple App Store or the Google Play Store. Since not all users update their mobile applications at the same time, app owners can zero in on how users are interacting with particular versions of their app.
![]()
On the same screen, a mobile app owner can see issues or problems in real time for the selected application. They can also expand the user actions captured within the context of a user session when they are interacting with the app. This view captures what that user is doing from the time they start up the application, including logging in, filling out forms, scrolling through widgets, and more. Dynatrace automatically captures these user actions and then tracks them over time. Using this information, Dynatrace automatically baselines these actions so app owners can understand specific functions or journeys they might want to encourage or discourage. If a particular action is slow or more error prone, Dynatrace automatically highlights it and provides the root cause.
For applications that cater to users across multiple cities, regions, or countries, practitioners can drill down to granular levels of detail. For example, this data can determine which vicinity a set of users came from and compare their experience of a particular issue with another set of users from a different location. This can help isolate, identify and resolve issues that are more nebulous at first glance.
Dynatrace also provides more technically detailed information and their impact on the application, such as web requests from 3rd party services, as depicted below on the left, so you can isolate which of these have higher than acceptable error rates likely contributing to a sub-par user experience. Furthermore, unlike web applications, different versions of a mobile app could be installed across devices. Isolating and identifying errors by versions, as depicted below on the right, helps you take the first crucial step towards identifying which new features resulted in an app becoming more error prone. Unlike point solutions, where you would have to switch between at least two different tools, on Dynatrace, with one click you can scroll to find the details you are looking for.
![]()
Dynatrace’s rich privacy controls enable application owners to comply with data privacy laws. For example, the masking feature allows practitioners to effectively limit the capture of sensitive data. You can choose predefined levels of protection or have adequate flexibility to fine-tune the masking options to your organization’s specific needs.
![]()
Capturing entire user journeys
After analyzing an application’s performance, an application owner can see that Dynatrace captures everything based on user actions out-of-the-box and can analyze them in a variety of ways. These can include timescale, frequency, and other ways to help with business KPI tracking as depicted in the screenshot below. To develop an understanding from a business perspective as to what users are doing, Dynatrace can create visualizations or dashboards tailored specifically to selected mobile application owners.

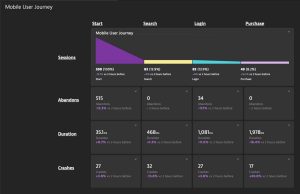
An example of this is the mobile user journey dashboard depicted below. A feature of Dynatrace called user session query language (USQL), allows practitioners to pick out very specific user functions. The dashboard represents a funnel to help practitioners understand how many users visited the application, the number of abandons based on entry and exit points, and how much time users spent on particular screens, all within the context of that session. This dashboard below captures the entire user journey from entry, to search, to logging in, and ultimately up to the purchase. It shows the complete end-to-end flow from a business perspective, identifying abandonments and the causes behind them, such as latencies or crashes at specific parts of the user journey that hinder conversions.
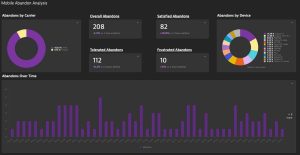
Further down, you can see that Dynatrace’s Davis AI isolates the satisfied abandons from those that are not. As an app owner, you can then dive into the frustrated abandons and examine the individual sessions and even play them back using Session Replay to pinpoint the exact reasons behind them.


Tracking mobile application KPIs made easy with Dynatrace
With Dynatrace, mobile application owners can easily capture usage data and view a wide assortment of visualizations from the metrics Dynatrace collects. Whether KPIs are specifically tailored toward business needs or application health and performance metrics, Dynatrace tracks them from the back end to the front.
Watch a video overview of mobile app monitoring with Dynatrace and read part one and part three of the mobile application monitoring series


Looking for answers?
Start a new discussion or ask for help in our Q&A forum.
Go to forum