Automatic and multidimensional performance baselining of all your service requests is a powerful way to quickly detect abnormal behavior in your environment. While baseline violations serve as great trigger events for initiating deeper problem analysis, not all potential real user impact can be detected solely based on statistical alerts. This is why each problem discovered by Dynatrace now includes a Business impact analysis section that quickly shows you the impact of the problem on your customers and service calls.
Imagine that one of your backend services begins to slow and that Dynatrace automatically detects and reports on the slowdown. Separately, Dynatrace detects that a process has been shut down for several minutes. However, because your applications and entry point services are currently handling these issues gracefully, you’ll likely miss out on the critical insight that your customers are unable to log into your application or buy your products. With the newly introduced automatic business impact analysis however, a complete analysis of all affected backend service calls brings this and other such issues to your attention so that you can resolve them quickly.
How business impact analysis works
Business impact analysis provides analysis of all transactions, from the problem affected nodes up to their entry points (either a customer facing web application or an entry point service) and collects details regarding all potential impact to your customers.
Note: Immediately following the detection of a problem, business impact analysis collects and analyzes all transactions to provide you with mission-critical information about the problem’s real user impact on your customers.
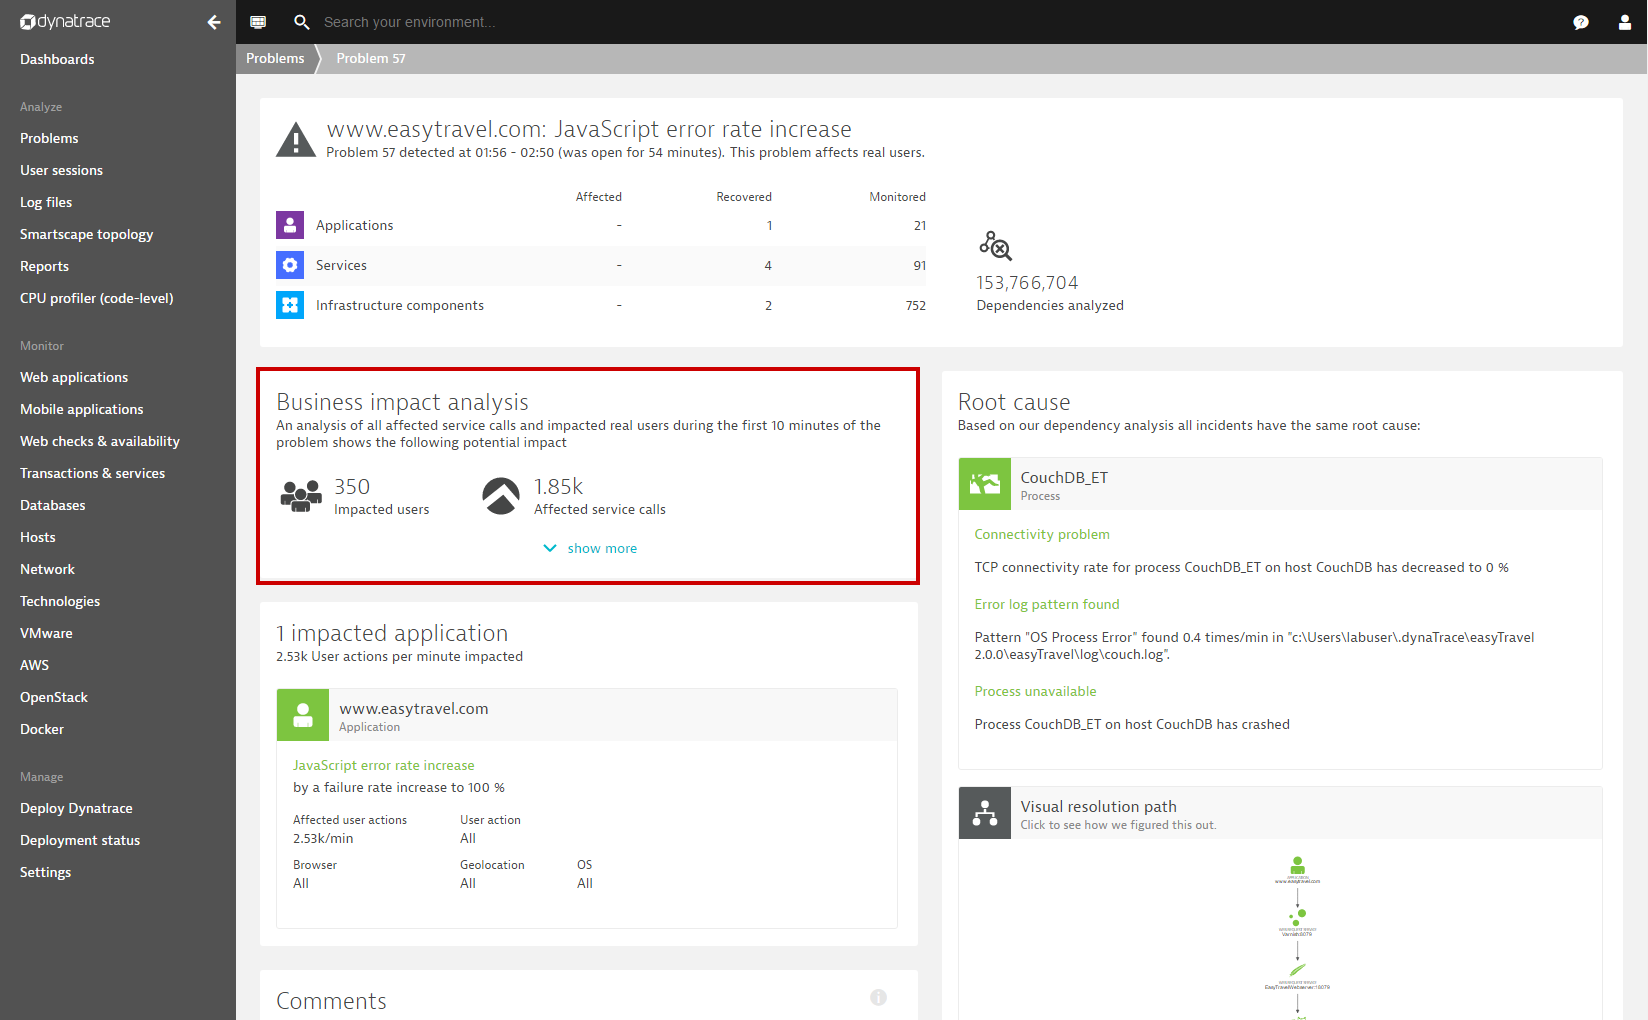
During business impact analysis, Dynatrace collects and counts the number of distinct real users who have faced the problem so far. For example, the Response time degradation problem below shows a business impact of 350 Impacted users and 1.8k Affected service calls.

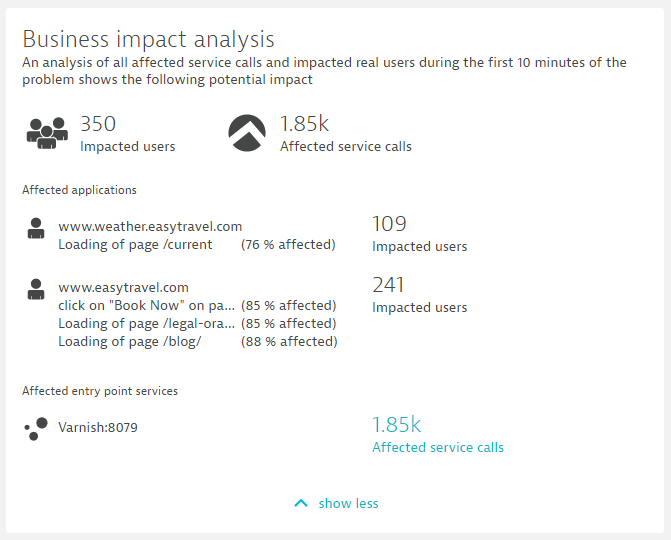
Click the Show more link within the Business impact analysis tile to view more detail about the affected transactions (for example, the application actions and service methods that triggered the transactions). For example, if a problem heavily affects a login user action, that finding will be displayed here (see example below).

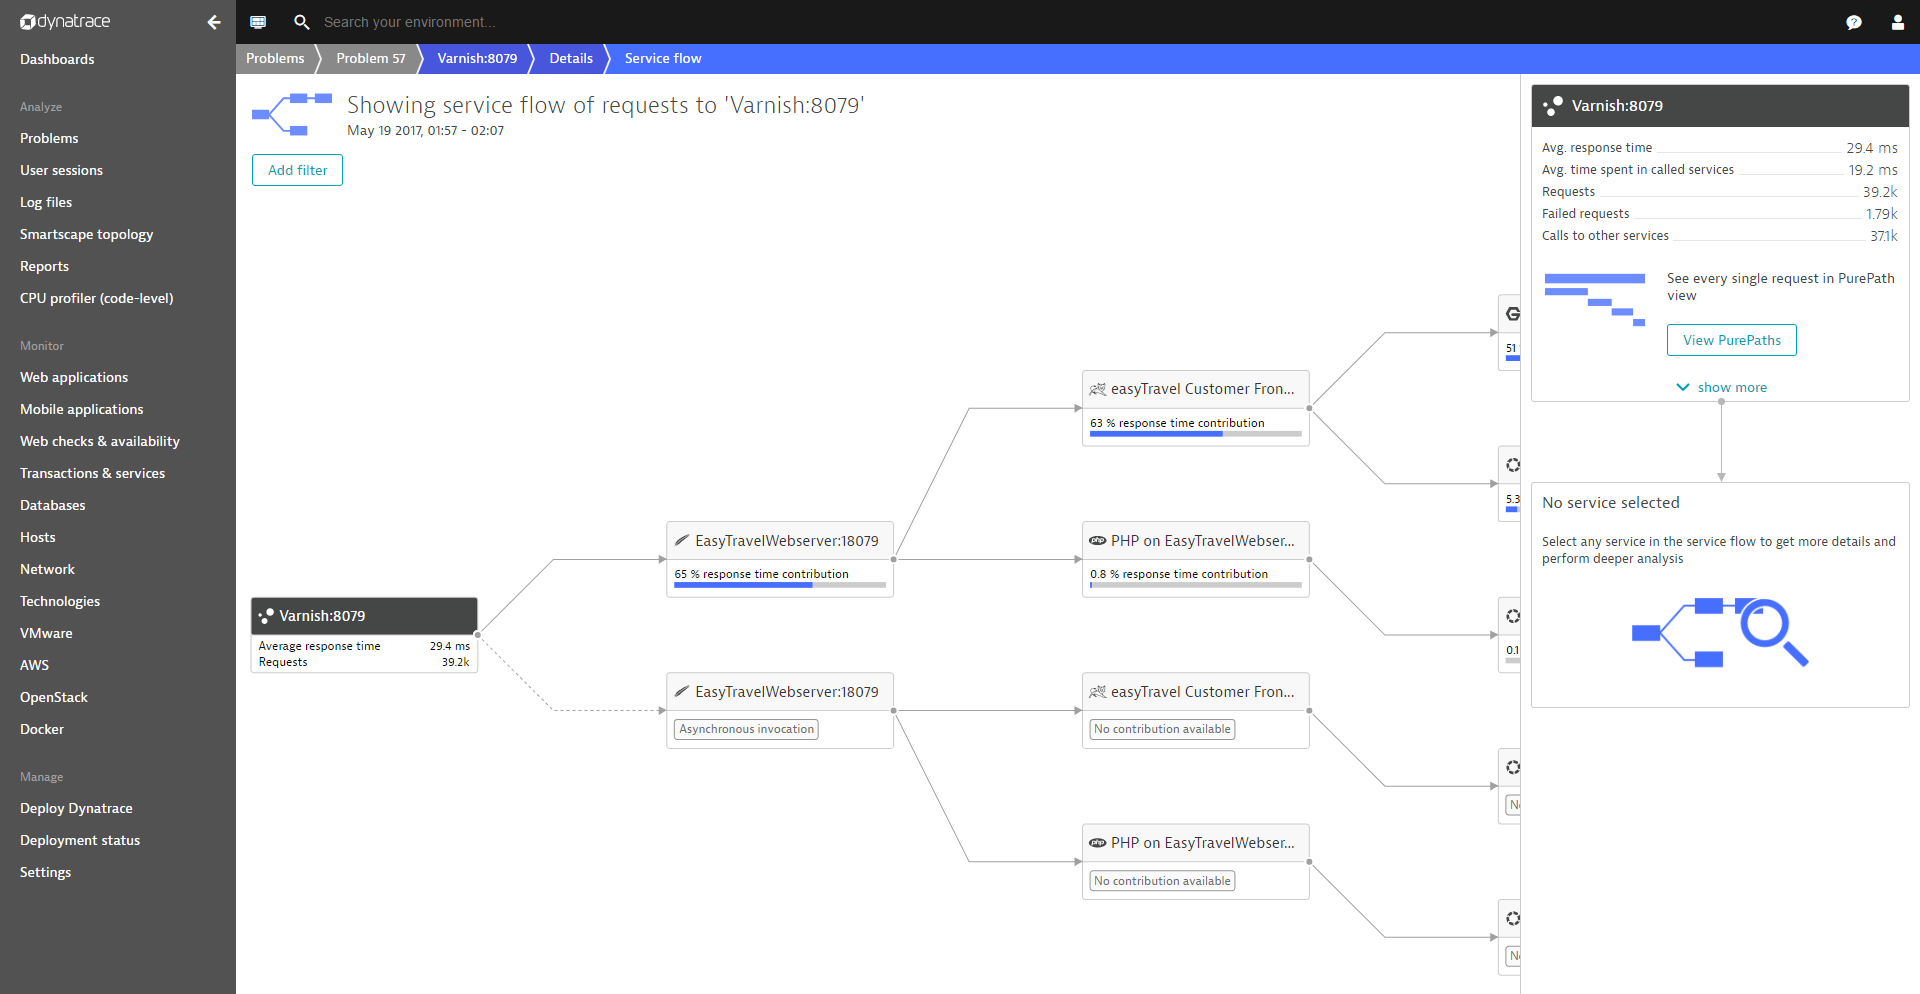
Click an affected service call link to focus on the service flow that contains this problem affected transactions (see example below). Service flow enables you to perform further analysis into each individual transaction within PurePath view.

Limitations
Business impact analysis isn’t triggered for all detected problems. For example, business impact analysis isn’t included with problems detected with synthetic tests, as the result would be only a single transaction. Business impact analysis is also not included with infrastructure-only events, such as CPU spikes, because no relevant transactions exist for analysis. The Business impact analysis tile is only displayed when relevant transactions are available for analysis.
Conclusion
The newly introduced Business impact analysis tile will grab your attention as it quickly shows the potential business impact of each slowdown and error rate increase problem. The results give you the information you need to, for example, ignore issues that only affect a single user while focusing your efforts on business relevant problems that affect hundreds of real users.
Business impact analysis also helps in uncovering problems that would otherwise be impossible to detect based on statistical evidence alone (for example, customers being unable to log into your application).
This feature demonstrates once again how the collection of performance metrics from each individual transaction, when combined with real-time topology information provided by OneAgent—is essential to gaining deep insight into abnormal performance issues within your infrastructure.


Looking for answers?
Start a new discussion or ask for help in our Q&A forum.
Go to forum