
The previous blog post in this series discussed the benefits of implementing early observability and orchestration of the CI/CD pipeline using Dynatrace. This approach enhances key DORA metrics and enables early detection of failures in the release process, allowing SREs more time for innovation. This blog post explores the Reliability metric, which measures modern operational practices.
Why reliability?
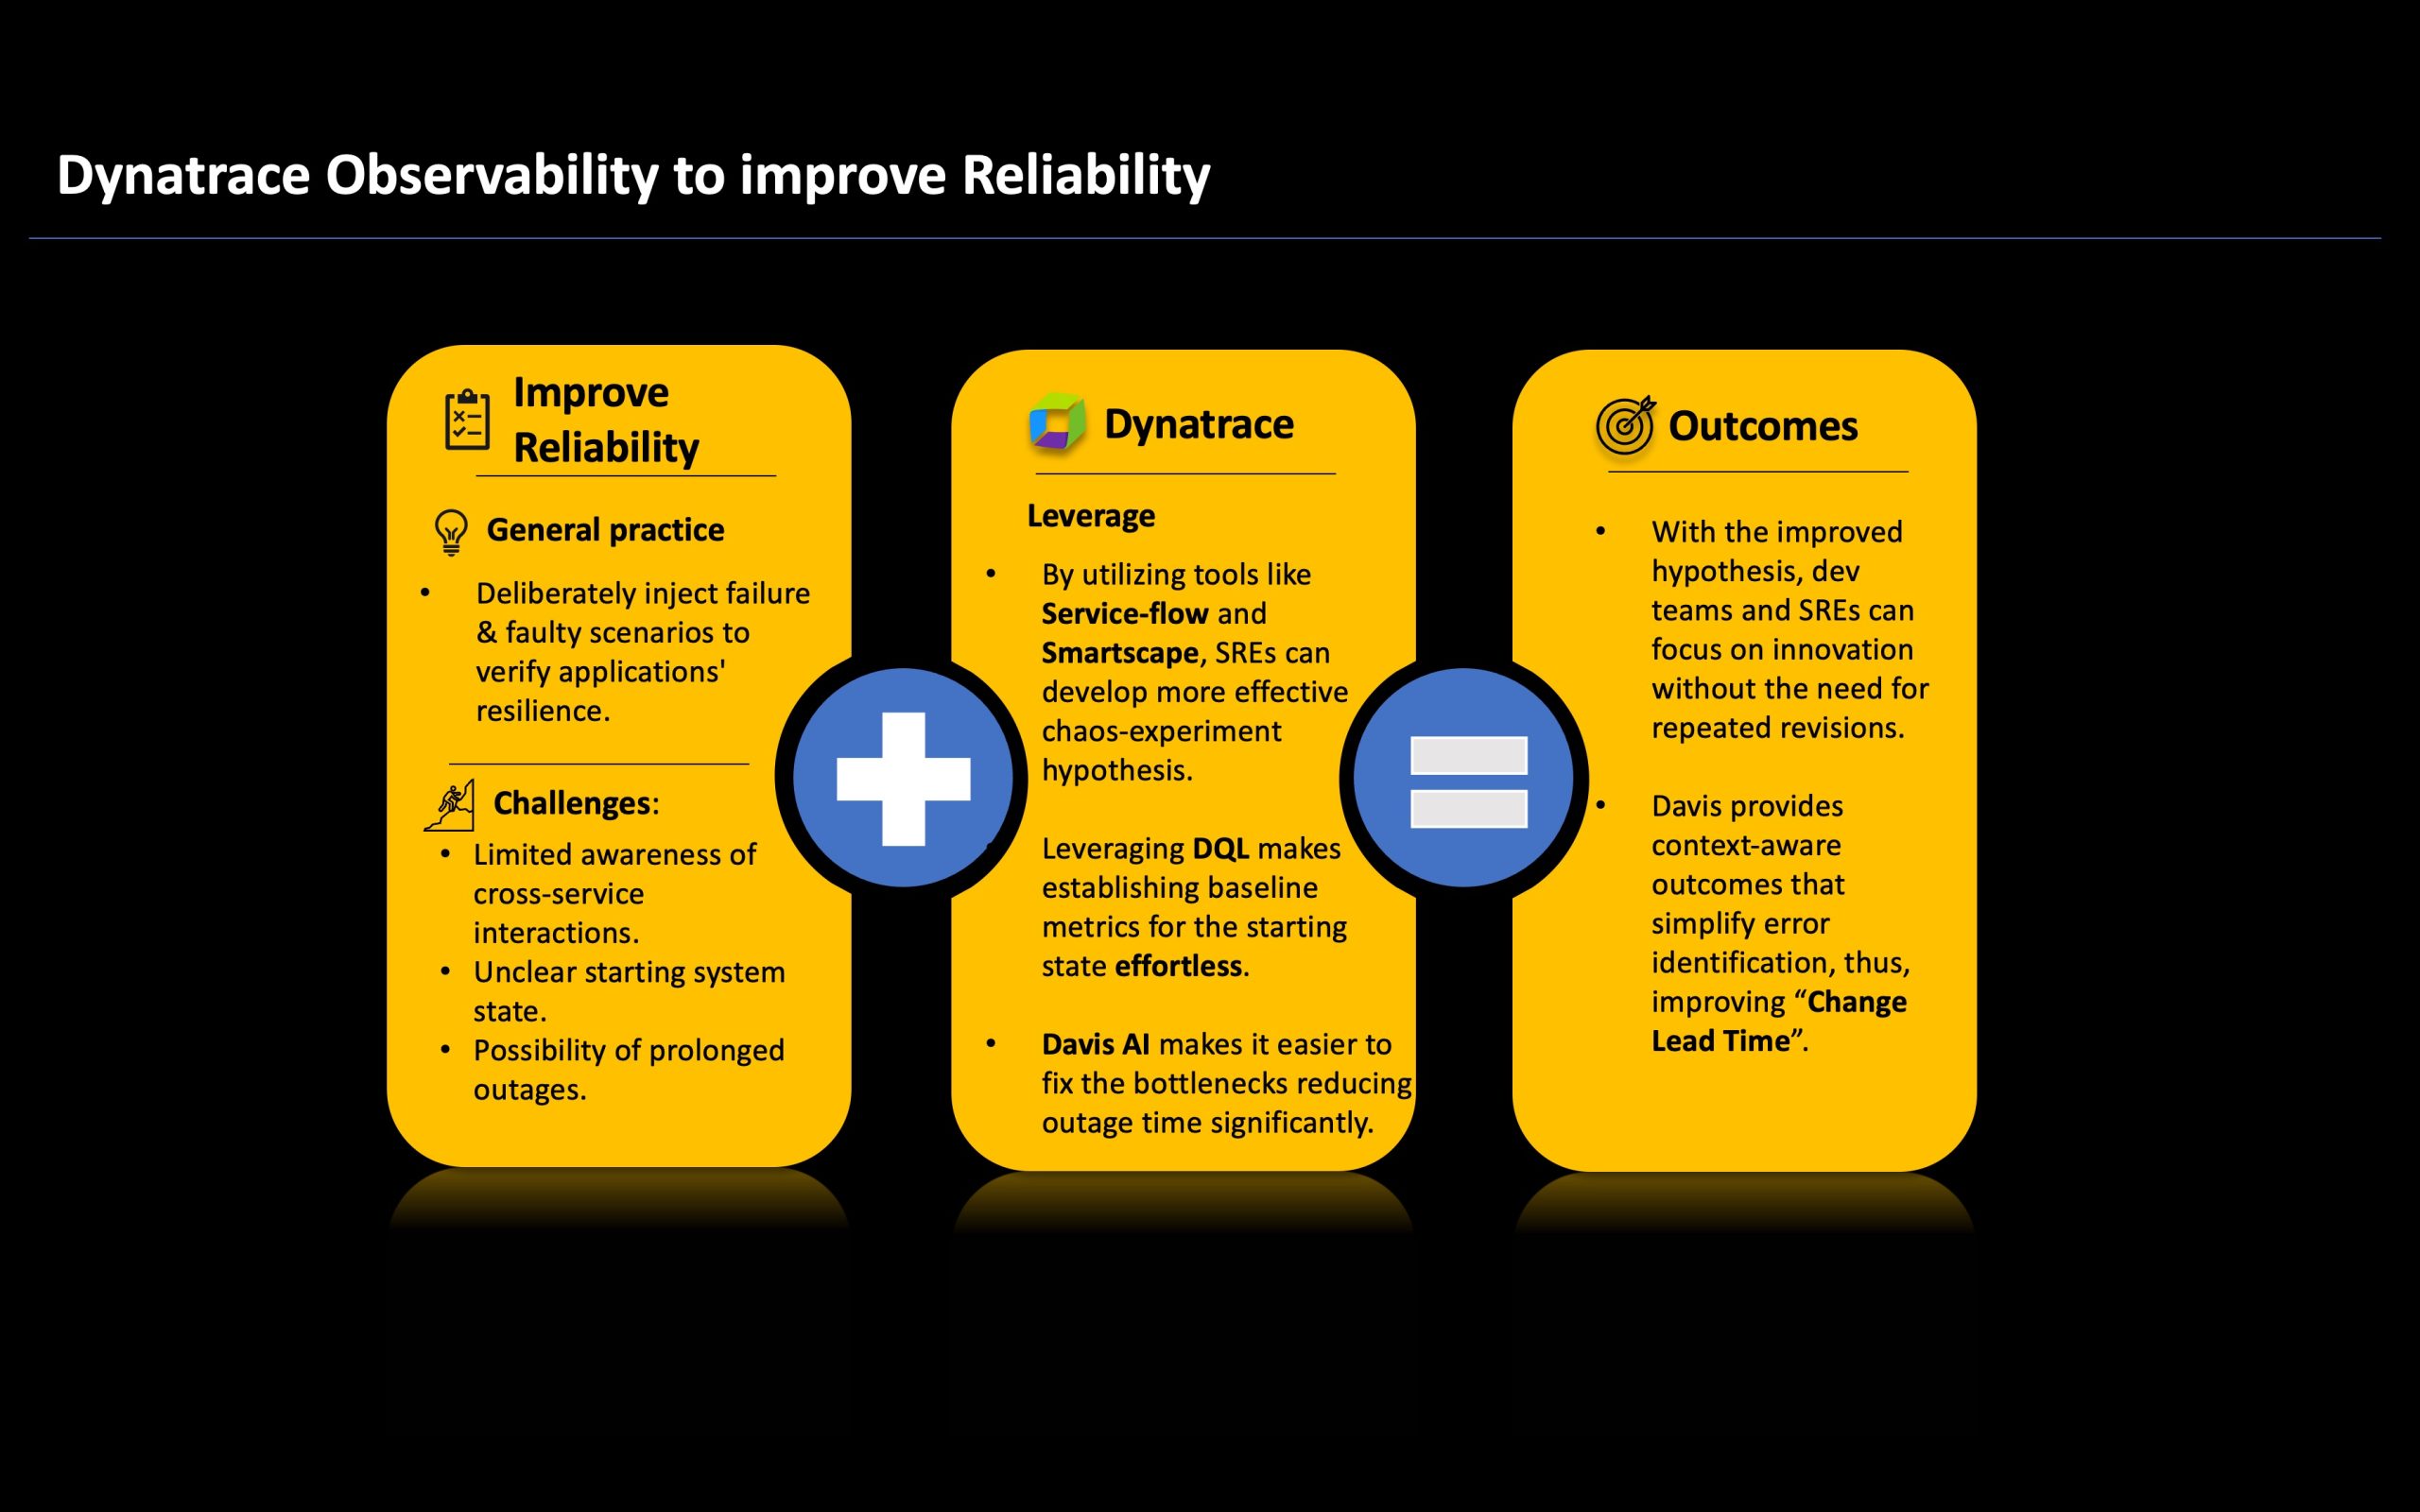
DORA introduced the Reliability metric as “the fifth DORA metric” to address the fact that many organizations improved release times and deployment frequency without adequately considering the reliability of new releases. These releases often assumed ideal conditions such as zero latency, infinite bandwidth, and no network loss, as highlighted in Peter Deutsch’s eight fallacies of distributed systems. To enhance reliability, testing the software under these conditions is crucial to prepare for potential issues by leveraging chaos engineering or similar tools. Chaos engineering is a practice that extends beyond traditional failure testing by identifying unpredictable issues. While it is powerful, it presents several challenges that affect its adoption. In this blog post, we delve into these challenges and explore how Dynatrace can address them to enhance the reliability of released software.
Challenges
Limited awareness of cross-service interactions
In chaos engineering, “hypothesis” denotes the expected behavior of an application under defined conditions or stressors, whether within their owned service or across services. It forms the cornerstone of chaos engineering experiments. In distributed or microservices environments, application teams often lack visibility into how their service will perform under diverse conditions across other services or the entire system. This limitation affects the quality of hypotheses, leading to frequent revisions or inaccurate assumptions.
“It’s not about chaos – it’s about reliability” – Andrus Kolton, CTO & founder of Gremlin
Dynatrace addresses this challenge by offering comprehensive observability across the entire environment. With Dynatrace, teams can seamlessly monitor the entire system, including network switches, database storage, and third-party dependencies. This visibility can be cross-checked in real time using features like Smartscape topology or Service Flow. By leveraging these resources, SREs can formulate more informed hypotheses based on the behavior of their service or application.
Insights: Unclear starting system state
Along with hypotheses, it is imperative to have a clear starting state to validate the experiments’ success. These are referred to as baseline metrics for the starting state, and without appropriate insights into the application ecosystem, it is difficult to form hypotheses. Such baselines constitute a few metrics like:
- What are the top five problems in your application – CPU spikes, slow response, database connections bottleneck, etc.
- The problems that take maximum time to resolve – lowest MTTR.
- Impact of fewer resources, for example, CPU and disk, available to different services and applications.
- More critical services that are likely to take other services down.
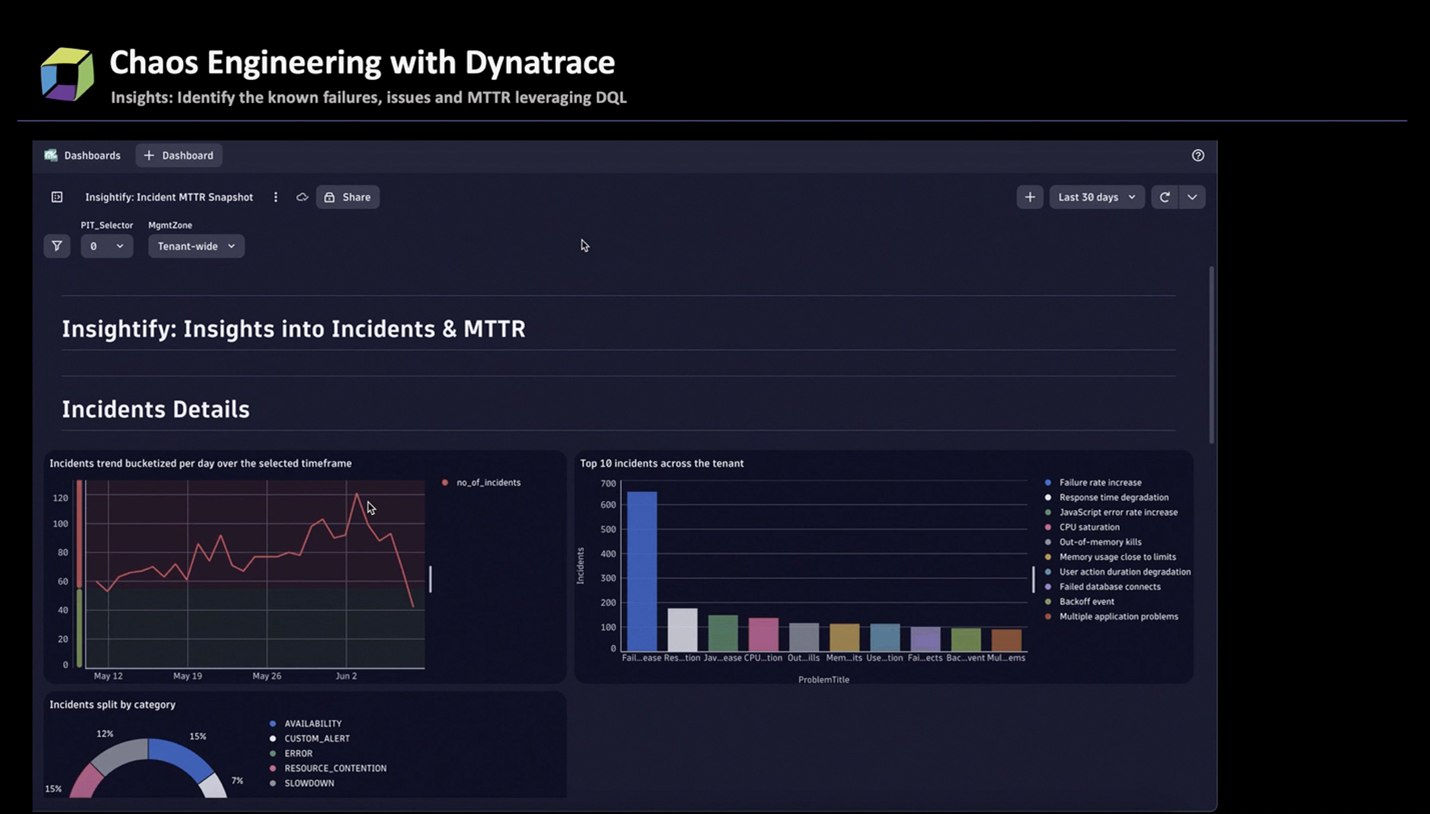
For instance, the above dashboard offers visibility into service and distributed systems through different lenses, such as the slowest MTTR, top problems, or services frequently impacting others. This data simplifies establishing the starting state for chaos experiments or determining the priority services requiring reliability tests and the specific reliability standards to test against.
Blast radius and risk of prolonged outages
While tests in pre-production environments provide valuable insights, proper validation occurs when chaos experiments are conducted in the production environment. However, SREs are hesitant to use chaos engineering during testing or validation stages due to the risk of incorrect hypotheses, potentially impacting multiple services in the production system and leading to prolonged outages. Therefore, their primary concern is to avoid such outages and unnecessary damage to the production system, leading to low adoption of chaos engineering and hindering efforts to improve reliability.
These outages can be mitigated by limiting the scope of chaos engineering tests, known as the “blast radius,” and gradually expanding it as impacted entities are correctly identified and fixed. Dynatrace automatically discovers all components and dependencies within complex technology stacks end-to-end, identifying billions of causal dependencies across websites, applications, services, processes, hosts, networks, and infrastructure within minutes. With this comprehensive monitoring, SREs can utilize holistic monitoring, where situational awareness and Davis® AI-based alerting transition from correlation to causation-based analysis. This enables different teams to understand the semantics of cascading problems, or the domino effect, and pinpoint the root cause for actionable fixes.
In the screenshot below, a chaos engineering scenario introduced latency and resource stress on the “easytrade” demo application. This scenario introduces a 7-second delay for random requests and causes CPU stress on the container. This helps the app team observe the application’s behavior under these conditions and identify any bottlenecks.
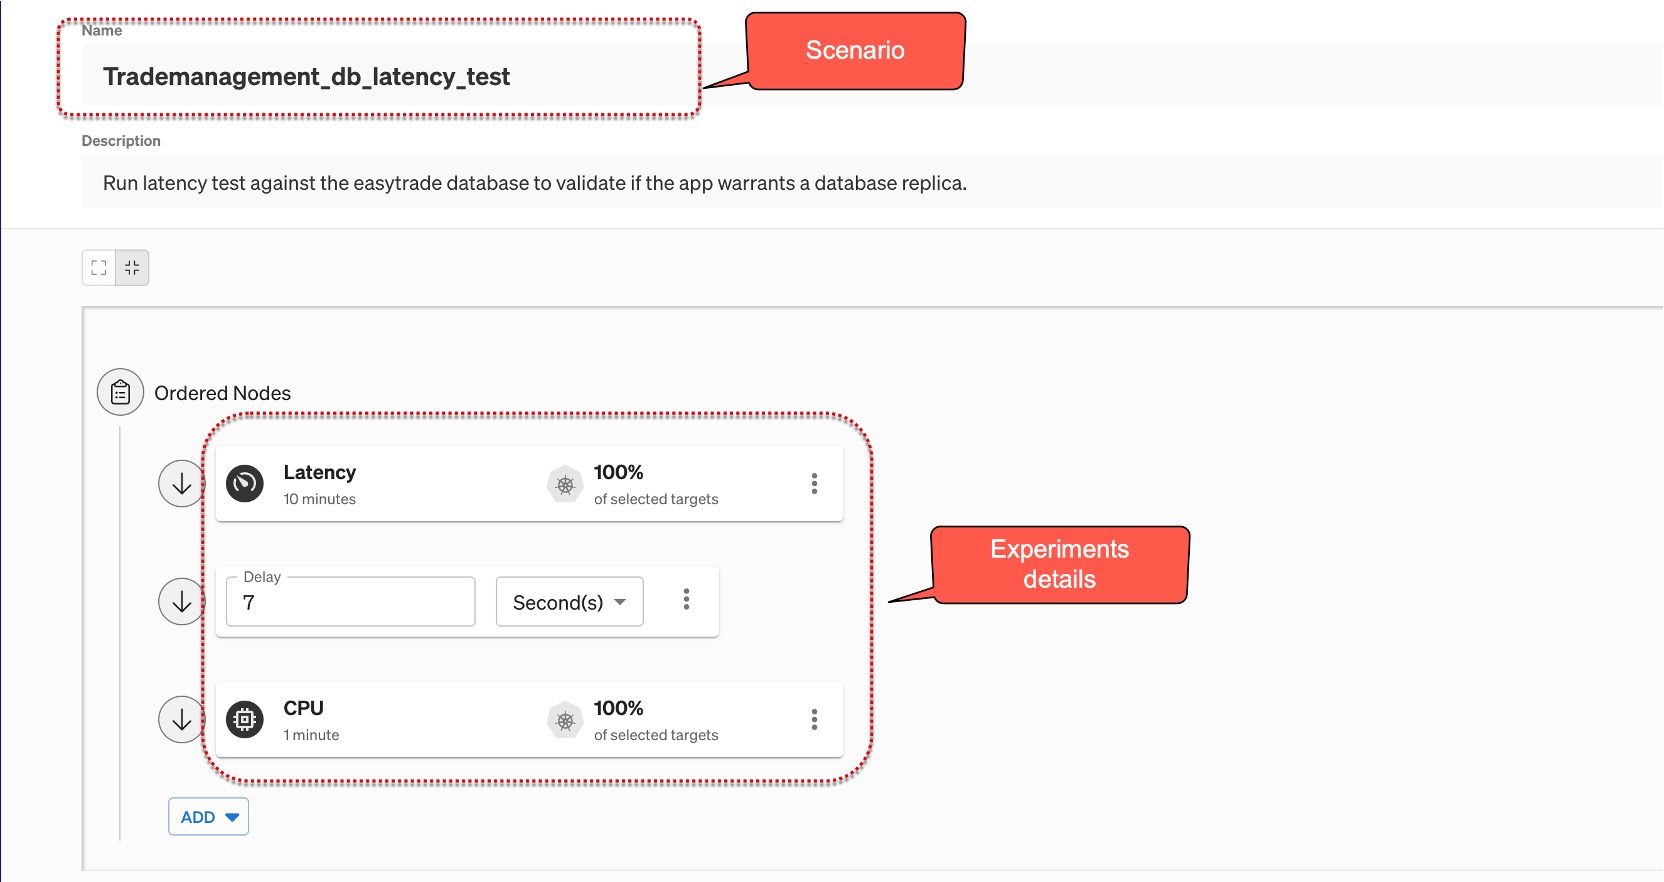
In the video below, Davis AI identifies the interdependencies and pinpoints that database slowness impacted multiple services, identifying it as the root cause. Additionally, the details of the new deployment and chaos experiment were included in the root cause analysis. By leveraging service tools and visual resolution, developers can work towards building robust and reliable services. Similarly, by gradually increasing the blast radius, developers can enhance the reliability of the entire application.

Lastly, the SRE team can leverage Dynatrace workflows to automate outages, ensuring virtually no downtime for services or applications.
Conclusion
Ensuring builds are created accurately the first time is crucial, even if it means testing them by injecting failures or remote scenarios. This enhances build reliability and equips SREs and operations teams to swiftly resolve potential issues that could lead to outages. As John Allspaw said, “Incidents are unplanned investments; their costs have already been incurred. Your org’s challenge is to get ROI on those events.”
With Dynatrace advanced monitoring capabilities, SRE teams can confidently overcome challenges and embrace Chaos Engineering. This ensures optimal performance and reliability, enabling organizations to confidently navigate today’s dynamic IT landscapes.
What’s next
In this blog series’ final installment, we’ll explore how Davis AI root cause analysis can be used to autonomously manage your application’s day-to-day operations with the help of Dynatrace workflows.


Looking for answers?
Start a new discussion or ask for help in our Q&A forum.
Go to forum