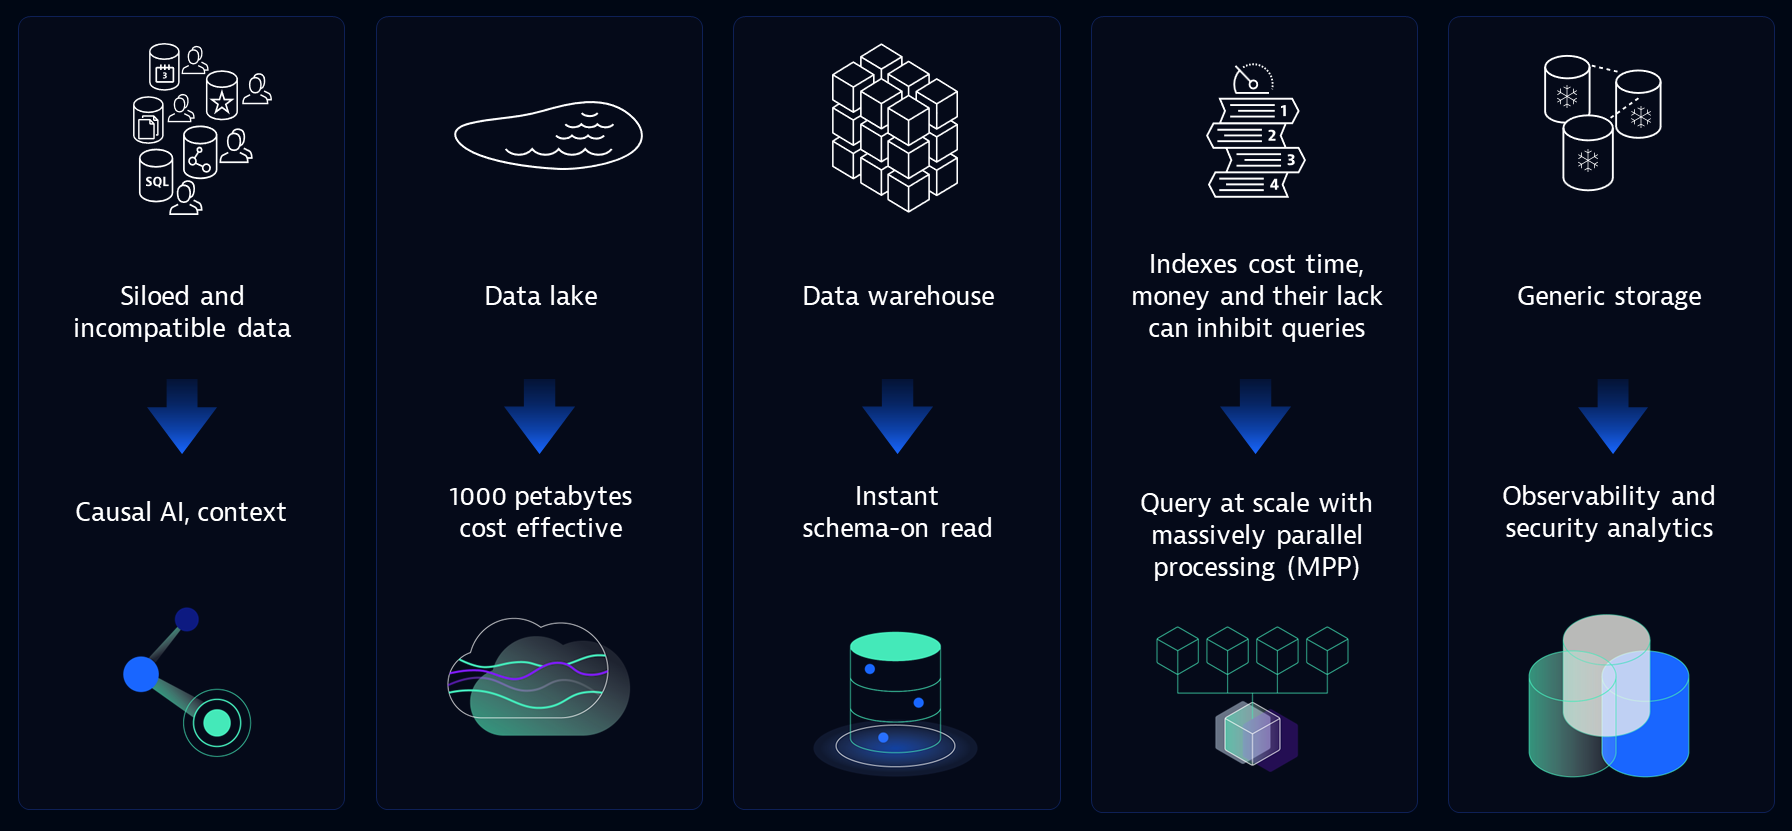
Last October, we introduced Dynatrace Grail™, our causational data lakehouse. From day one, Grail disrupted the log management and analytics market by unifying observability, security, and business data and providing instant answers thanks to its massively parallel processing (MPP) capabilities. Further extending our platform's analytics capabilities, we're increasing Grail's capabilities by adding new data types and unlocking support for graph analytics. These capabilities enable Davis®, the Dynatrace causal AI engine, to gather even more insights. They also enable an entirely new way of interacting with data and performing any analysis without boundaries.
Grail – the foundation of exploratory analytics
Grail can already store and process log and business events. Now we’re adding Smartscape to DQL and two new data sources to Grail: Metrics on Grail and Traces on Grail.
Introducing Metrics on Grail
Despite their many advantages, modern cloud-native architectures can result in scalability and fragmentation challenges. Ensuring observability across these environments requires access to data at a massive scale. The proliferation of metrics can quickly result in a high cardinality challenge, with each service, host, or Kubernetes pod adding its own unique values to the data set.
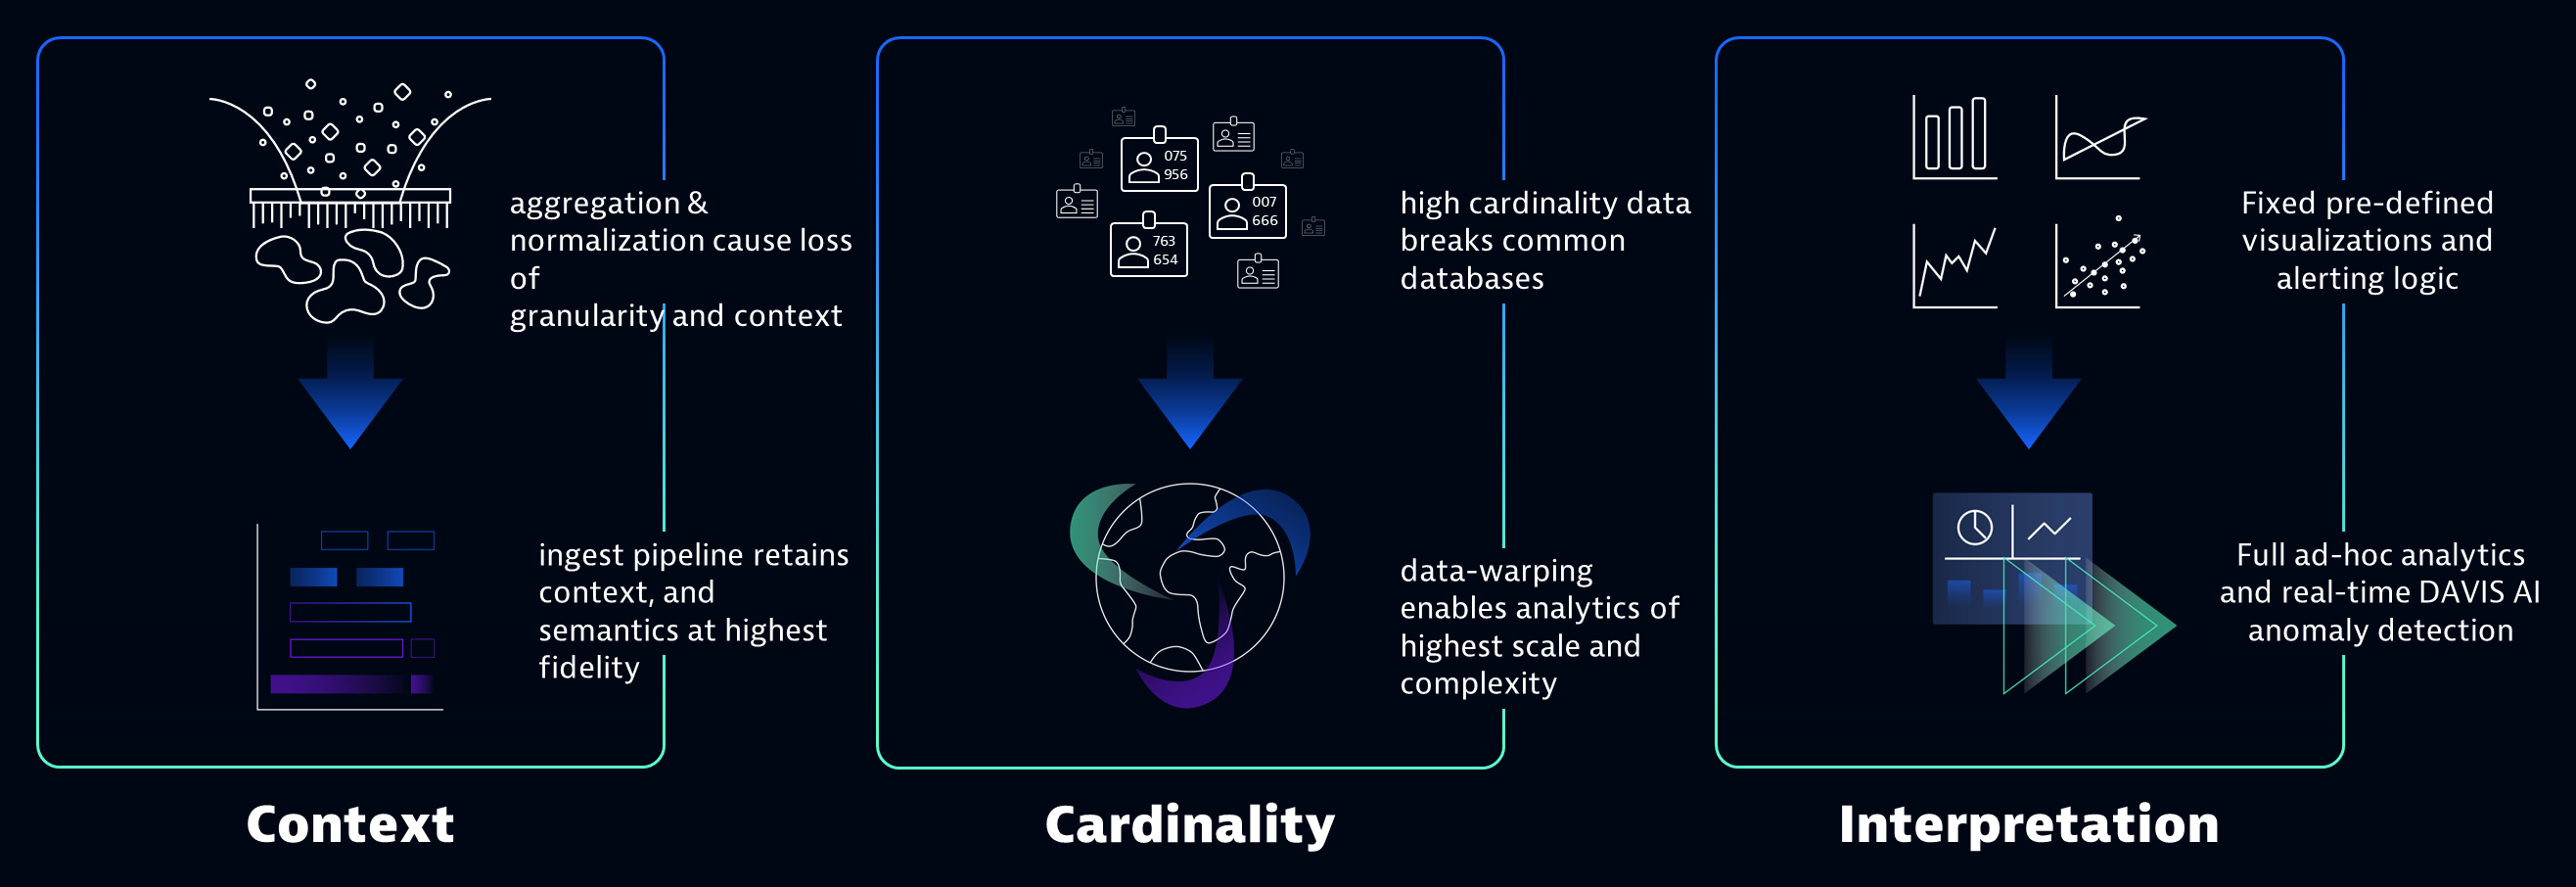
Grail solves this scalability issue! Metrics on Grail is architected to manage billions of metrics to cope with cardinalities and unique value combinations of 1 trillion potential permutations for timeframes beyond a year. This is only possible because of our no-index approach and massive parallel processing capabilities, which enable Dynatrace to offer extra-long data retention (15+ months) at full granularity that is cost-efficient and fast.
You no longer need to split, distribute, or pre-aggregate your data. Let Grail do the work, and benefit from instant visualization, precise analytics in context, and spot-on predictive analytics.
Introducing Traces on Grail
A distributed trace follows a transaction on its journey through every service, cloud platform, and host in your environment. Having access to traces that span the full hybrid and multicloud stack enables developers to debug their applications in production and understand dependencies in live environments. For more complex cloud-native architectures, adding more services and applications leads to a massive increase in the volume of collected traces.
With Grail, we address these customer challenges by offering the most powerful and future-proof trace analytics solution on the market, which:
- Handles data volumes of hundreds of terabytes a day
- Retains large data volumes for up to 15 months in a highly cost-efficient way
- Ensures that data retains its context by assembling trace spans into PurePath® distributed traces (including additional code and thread profiling data)
- Returns instant query results in real-time using indexless queries
Smartscape for DQL: Context is king
Bill Gates wrote an essay in 1996 entitled “Content is King” in which he described the future of the internet as a marketplace for content. In DevSecOps, content includes applications and services—in addition to information about the environments where they run and the users who use them. Observability and application security use cases rely on data. However, data on its own, without context, doesn’t reveal all its insights. Whereas Bill Gates’ observation is still valid, for the DevSecOps industry today, a more accurate description is “context is king.”
In a traditional monitoring environment, metrics are aggregated data points that lose their context and granularity when data sets are trimmed to make them more manageable. With Dynatrace and Smartscape for DQL, metrics are a completely different game. Whether it’s metrics, logs, events, traces, or any other data type, Dynatrace not only retains the data context but also enables you to analyze data in its semantic context without boundaries.
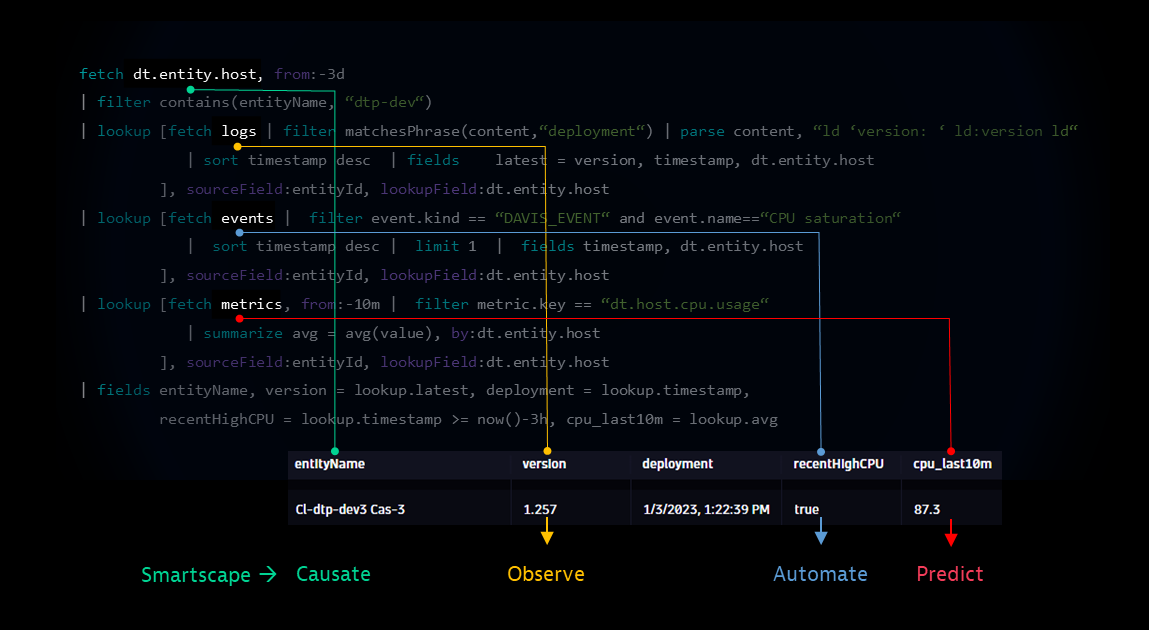
These capabilities are powered by Smartscape for DQL, a directional graph representing the real-time topology and dependencies of a data architecture. Smartscape unifies the different data types ingested into Dynatrace and retains the full context of this data to enable holistic and precise data analytics.
With the Dynatrace Query Language (DQL), teams can perform these analyses by asking questions that weren’t possible in the past. There are now boundless possibilities, such as identifying users affected by a service outage in a red-alert scenario or doing forensic research on a recent data breach. With DQL, you can easily combine different data types into a single query.
The power of Smartscape is, of course, not limited to manual queries. The same data model fuels Davis, the causational AI engine at the core of the Dynatrace platform. Dynatrace has used Davis for many years and is leveraging its power for root cause analysis, identifying security risks, and many other use cases. Davis doesn’t rely on machine learning or statistical correlations—the models that power most available AIs and try to correlate data points by timestamp analysis, searching for similarities, or processing manual instrumentations. Alternatively, Davis is causal AI that reflects continuously updated topology and dependencies (powered by Dynatrace Smartscape) and understands the precise relationships and dependencies between isolated signals.
Whereas other AIs must guess, Davis knows and eliminates false positives. With the addition of Dynatrace Grail, which ingests, retains, and maintains data in context, we’re revolutionizing the observability industry and extending Dynatrace further to provide answer-driven analytics and automation for unlimited observability and security use cases.
Exploratory analytics – empowering people and data
While data is considered by some to be the new gold, it’s people that still make the difference. Gaining insights from data stored within Dynatrace has traditionally been limited to people within an organization who have specific expertise and training. This is no longer the case.
With the new Dynatrace user experience, we’re introducing new concepts and changing how people across organizations work and interact with data.
New user experience
How many user interfaces have you used that are defined by the data and data types they show rather than the use cases they support? How often have you spent time decluttering or trying to make sense of the information presented on a dashboard? How often have you wished you could interact with data in the same intuitive way you interact with information on your smartphone, quickly switching between visualizations, easily understanding the context behind a spike in a chart or diagram, or digging deeper to perform ad-hoc analysis?
When we started working on Strato—the new Dynatrace design language that powers our new user experience—we developed a few core principles to address the design challenges stated above:
- Designing software for DevSecOps use cases means handling data—large volumes of data that need to be accessible for in-depth analysis in an easy-to-digest interface. We therefore completely rethought the user experience: the interface is user-centric rather than data-centric. We designed Dynatrace in a way that places the user in the middle, offering a flexible UI—tailored to individual needs and deriving rich insights from different perspectives.
- The interface is simple—whether you’re a first-time user, an occasional user, or an SRE using Dynatrace as your single source of truth, the experience is simple and easy to learn.
- The interface offers infinite possibilities. Users need to be able to work efficiently regardless of how large their environments are. Sharing and collaborating with teams is now easier than ever before.
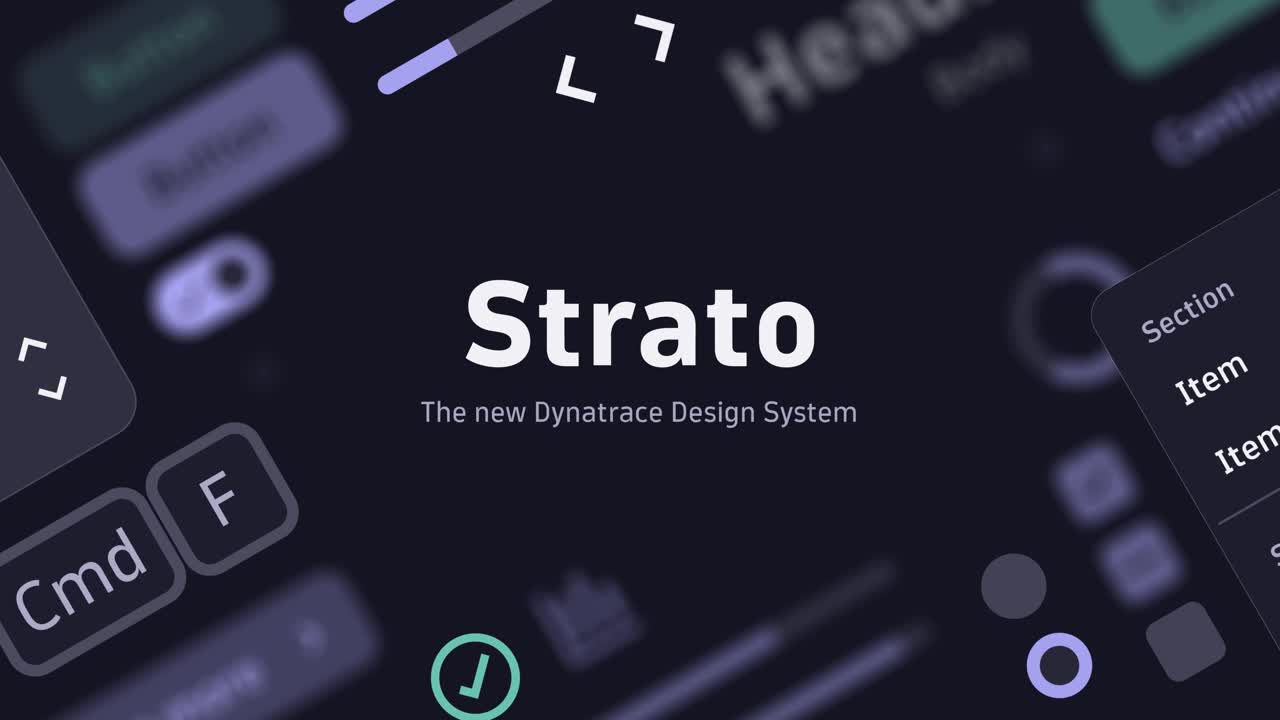
These principles all align with a single, overarching goal: making data and insights derived from analytics available to a wider audience. To achieve this, we designed the new Dynatrace user experience (UX) to facilitate collaboration with teams across organizations—IT, development, security, and business—and solve everyday problems. We focused on democratizing the user interface, making it less trivial and more accessible, and empowering teams to better understand data signals and make data-backed decisions.
“When you allow data access to any tier of your company, it empowers individuals at all levels of ownership and responsibility to use the data in their decision making.”
— @BernardMarr
User in context
We already mentioned above that putting data in context is vital for Dynatrace. This is also true from a user experience perspective. With Strato, we add user context to the Dynatrace UI.
Charts are now interactive—data points are clickable. Think of a chart that shows a spike in response time because of a deployment two hours earlier—any user can now hover over this data point and begin interacting with the underlying data, whether it’s a drill-down or just the context of the spike.
Introducing Every component and view in the Dynatrace web UI is interlinked based on user context or “intents”. Similar to what you know from your smartphone when sharing an image on your favorite social media channel, when opening a page within Dynatrace, you can easily pass and share the context of your analyses to any other app on the Dynatrace platform. The selection of available apps that are presented is completely context-sensitive and can even be expanded based on your needs.
Simplifying data analytics with Dashboards and Notebooks
In addition to new concepts revolutionizing the overall Dynatrace user experience, we’re introducing two new apps to the Dynatrace platform: Dynatrace® Dashboards, a complete overhaul of the dashboarding experience, and Dynatrace® Notebooks, for on-demand data exploration. These apps make it easier for more team members to explore, visualize, and collaborate on analytics projects. The following principles guided the development of these new capabilities:
- Offer drastically faster and simpler flows, guided by Strato, the new Dynatrace design system
- Fetch all Dynatrace data from one place and even combine it in a single query with Grail
- Integrate external data easily with Dynatrace functions
- Add flexibility and versatile filtering with variables
- Take context with you as you seamlessly navigate the Dynatrace UI using intents
Dashboards and Notebooks have individual strengths that make them the best choice for solving specific use cases.
Observe data with Dynatrace Dashboards
Dynatrace® Dashboards transforms complex data into easy-to-understand visualizations. Dashboards is your go-to app for quick and clear data overviews, whether you need a status-quo view that can be observed over time or you need to share aggregated views with management or business teams.
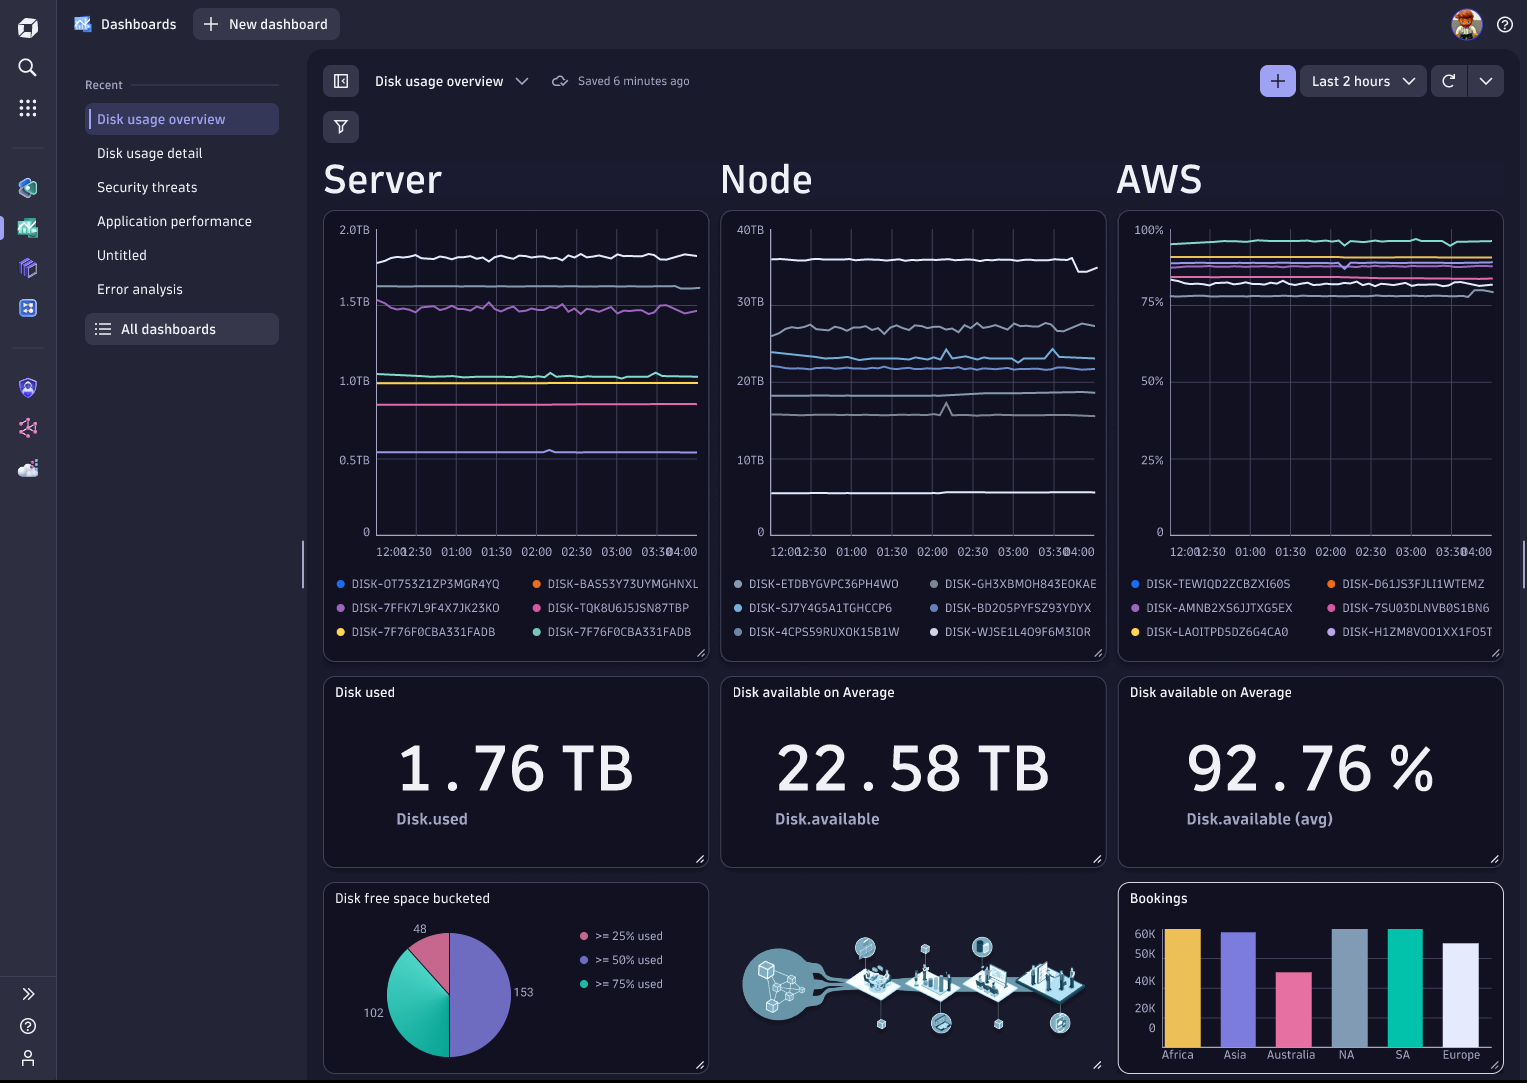
Dashboards offers an interactive experience with full support for all capabilities and datatypes offered by Grail, allowing you to query not only metrics, but also logs, events, and even external data. It serves as your starting point for further deep-dive analysis, offering more detailed drill-downs via Notebooks (see below).
The all-new Dashboards app is your answer to live data visualization and observation. From data to insights in seconds, and we’re just at the beginning.
Explore data with Dynatrace Notebooks
Dynatrace Notebooks is your on-demand window into data exploration. It addresses the challenge of finding the right data, cleaning, filtering and transforming the data and finally connecting with other data to understand underlying dependencies. You no longer need the help of a data scientist for such tasks—Notebooks enables every Dynatrace user to perform any type of analysis on data stored in Dynatrace.
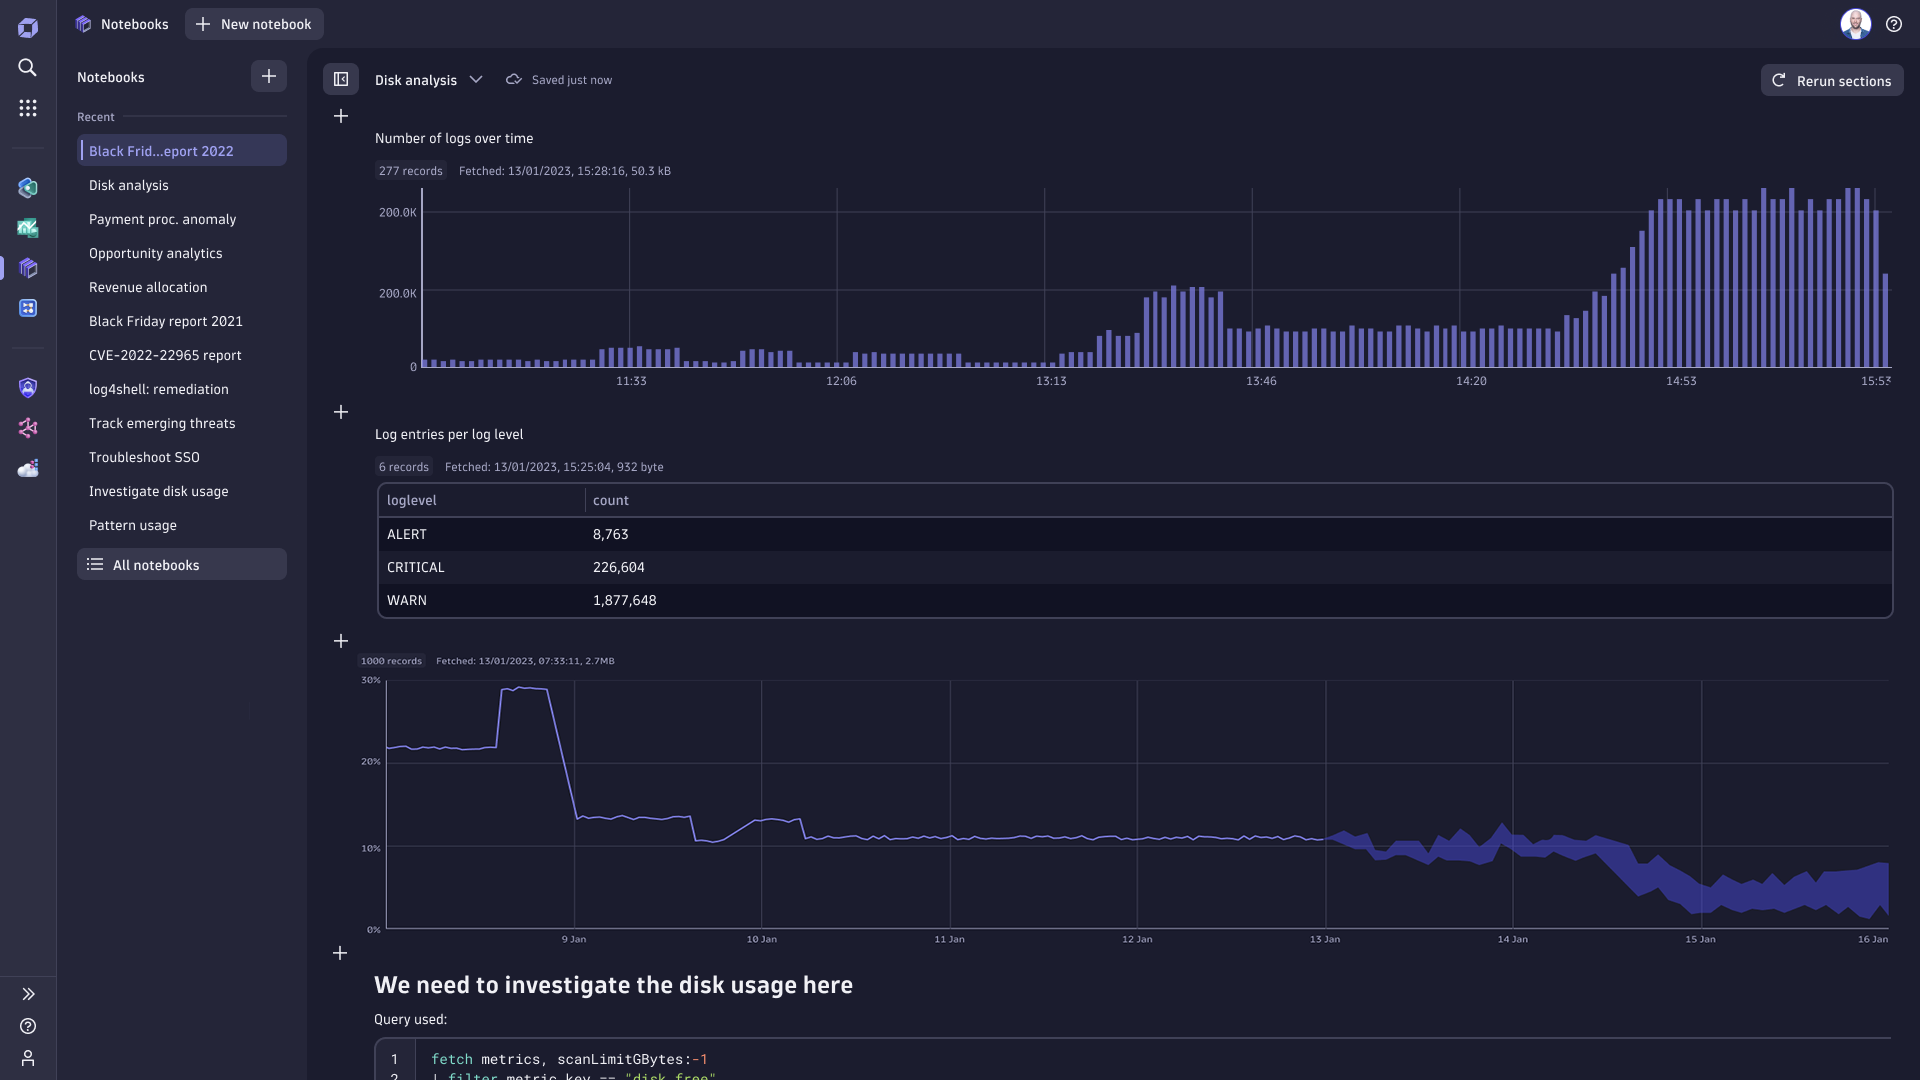
Start creating data-driven documents and perform custom analytics. Depending on your use case, Notebooks can persist a status quo and create a snapshot whenever necessary or be “self-updating” using current data to always reflect the actual status. You can easily interact with any query result by “slicing and dicing” the data stored in Grail: advanced filters, refinements, aggregations, and sort orders, are just a click away. It’s even possible to harness the power of Davis by adding predictive forecasts to identify future trends with a simple click.
Suppose you need the limitless power of Grail. In that case, you can easily create and edit DQL queries to filter, join, and transform data any way you need it, or even extend Notebooks with custom logic and external data by adding ad-hoc functions powered by Dynatrace® AppEngine.
Whether you’re analyzing new opportunities, the latest vulnerability post-mortem, or your executive production report, Notebooks does it all and ensures that both your query and results are persisted and ready to be shared with your team members. Empowered by Grail, Notebooks is the Swiss Army knife of the Dynatrace platform—built for collaborative data exploration and analysis.

Summary
With these newly added capabilities, Dynatrace users can now perform any custom query, leveraging Dynatrace Grail AI-fueled graph analytics power. This delivers instant and precise answers for an unlimited array of use cases:
- Business impact: quickly identify impacted users by mapping observability and security findings to your business context and improve customer satisfaction by querying for e-commerce customers who are unable to finalize their check-outs due to a service outage.
- Automation: understand the potential impact of remediation actions on dependent components.
- Security: protect customers and brands by conducting application security forensics to identify, mitigate, and prevent data breaches.
- Business process health: show and analyze the health status of complex processes even if dependencies are non-transactional.
- Optimize: enable more efficient multicloud operations by predicting cloud performance and utilization over time to optimize resource allocation based on user needs.
The Dynatrace analytics platform converges security and observability data, enabling cost-effective end-to-end analytics at a large scale with long retention times, in context with your business, thus multiplying your value from data: every imaginable analysis of data in Dynatrace is now possible!
What’s next?
The new Dynatrace user experience, including the newly designed Dashboards, Notebooks, and Dynatrace Grail support for metrics and Dynatrace® Smartscape for DQL, will be available in Q2 2023. Grail support for Dynatrace PurePath® distributed traces will be open for preview in Q2 2023.
In the meantime, watch out for upcoming Observability Clinics and “Ask me anything” sessions covering the main topics of this blog post. You can either view a list of the next webinars on our website or follow us on LinkedIn to stay up to date with upcoming announcements and activities.





Looking for answers?
Start a new discussion or ask for help in our Q&A forum.
Go to forum