Congratulations, you’ve just hired your first Site Reliability Engineer (SRE)! What should they do first to set your organization on the path to DevOps automation?
- Increase the resiliency of your automated deployments?
- Develop software to measure SLOs and track releases?
- Define validation processes for releases?
By the time your SRE sets up these DevOps automation best practices, you have had to push unreliable releases into production. This leads to unhappy customers and loss of revenue.
To avoid this scenario, your SRE’s first step should be to employ technologies and strategies that tame the complexity of multicloud DevOps environments. Most importantly, the right modern observability platform is key to a successful DevOps and SRE implementation. Such a platform should be built upon AI and automation to provide actionable answers at every stage of the CI/CD pipeline. This platform should also support automated release monitoring and validation, and correlate build, test, deployment, and operational data in context for rich analysis.
Ideally, your SRE would implement Dynatrace, the only observability platform that combines automatic and intelligent observability with an enterprise-grade control plane—Dynatrace Cloud Automation—to automate delivery and operations.
With the right platform in place, you can instantly bootstrap SREs into an automated and intelligent release delivery and validation process.
A bootstrap project for Dynatrace Cloud Automation
Dynatrace Cloud Automation provides SREs and DevOps teams a plug-and-go integration with Davis AI. Davis provides automatic answers to help accelerate software delivery without compromising quality and improving product reliability.
To help you begin, I created a Dynatrace Cloud Automation bootstrap project that I based on insights we gained from some of our Dynatrace customers as they adopted Dynatrace Cloud Automation. It contains individual solutions that focus on establishing the following:
- Service-Level Objectives (SLOs)
- Releases overview
- Dashboards for DevOps and SREs
You can find the Dynatrace Automation Bootstrap (DAB) at the Dynatrace Perf Clinics Repository.
DevOps automation solution #1: Release automation
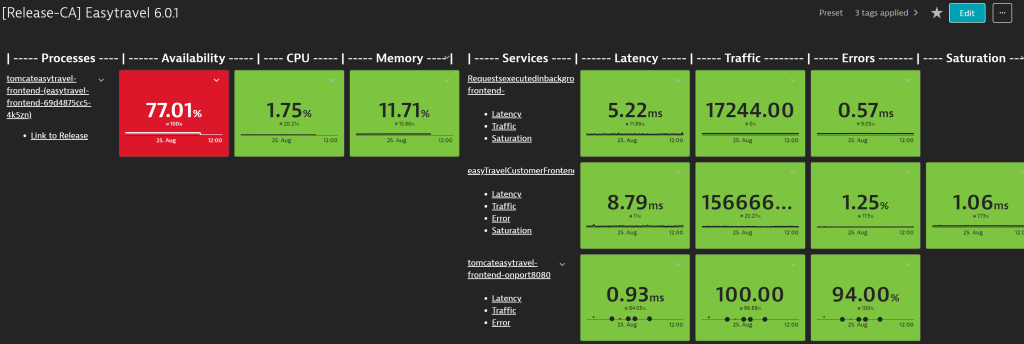
The Release Automation solution provides an automated way of integrating releases with Dynatrace without making changes to deployment configurations. Dynatrace supports three release detection strategies, two of which require additional configurations. This solution, however, makes use of the third option, Events API v2. This solution takes direct details about the release, such as version, stage, identifier, and so on, to automatically push a deployment event, generate service level objectives (SLOs), and a dashboard that shows the status of processes and services.
DevOps automation solution #2: SLO automation
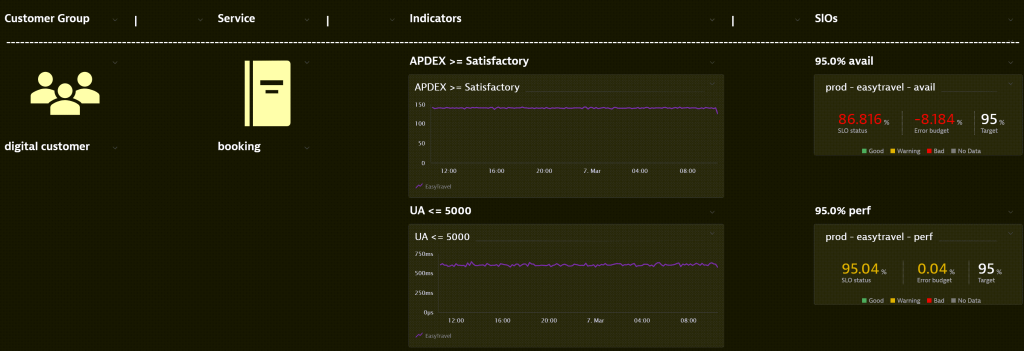
Similarly, the SLO Automation solution provides an automated way of generating service level objectives (SLOs) for key service level indicators (SLIs). SLO Automation follows the seven steps of defining effective SLOs. The goal is to create effective SLOs that provide context to customer impact.
The first step is to identify customer groups, and then the essential services and SLIs. The result is effective SLOs and a dashboard that visualizes the SLOs in context with the customer group or service.
DevOps automation solution #3: Release validation dashboard
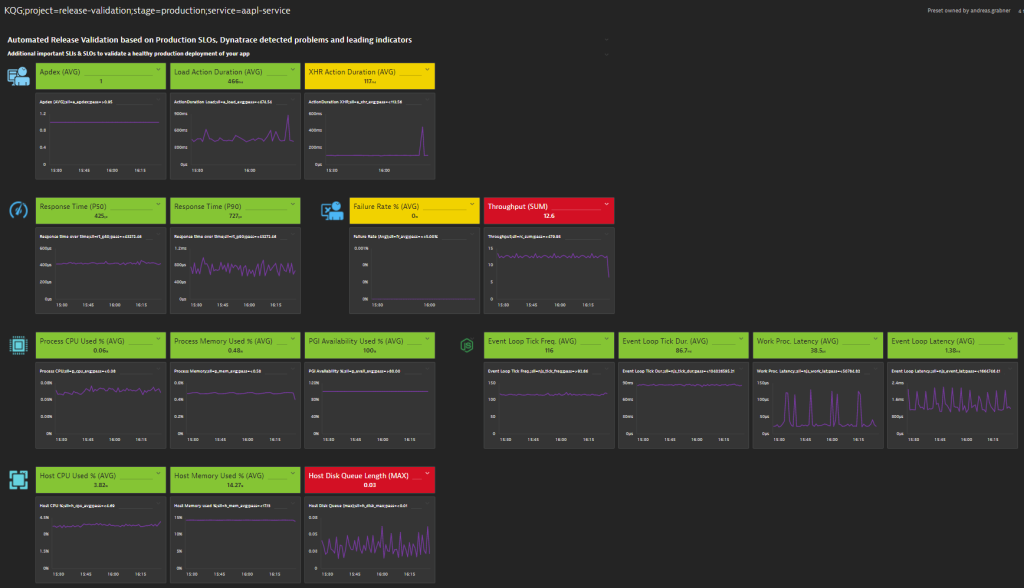
The Release Validation Dashboard solution generates technology-based dashboards with baseline thresholds used during release validation. The resulting dashboard directly integrates with the release validation capabilities of Dynatrace Cloud Automation. This solution creates a repository for the project, stage, and service. An evaluation sequence is sent to Dynatrace Cloud Automation. Dynatrace Cloud Automation will start the evaluation, which queries the SLIs from the release validation dashboard based on the project, stage, and service. Dynatrace uses the SLIs to calculate a single SLO score. Once the calculation is complete, Dynatrace Cloud Automation sends an evaluation event to Dynatrace.
DevOps automation solution #4: 4 Golden signals service flow
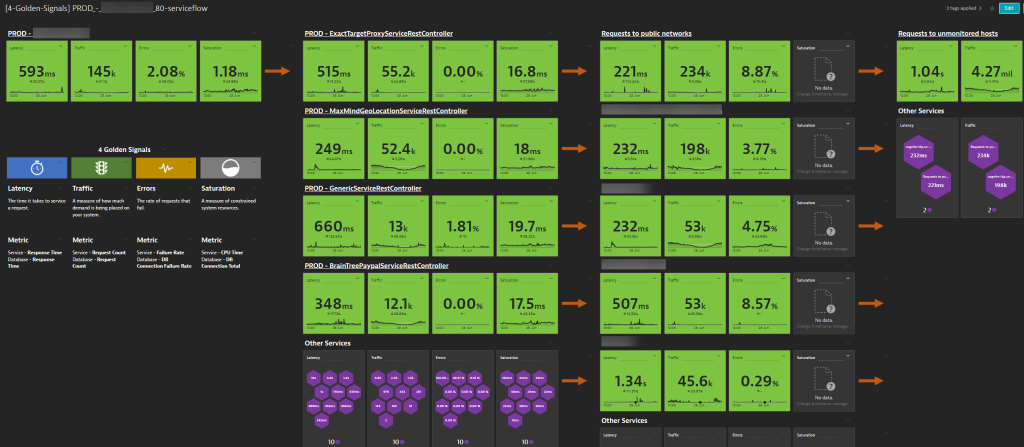
The 4 Golden Signals Service Flow solution is one of two solutions focused on Google’s four golden signals of monitoring. This solution automatically generates a dashboard representing the service flow of a given service and determines baseline thresholds for each service and signal. This dashboard is a visual aid for determining the effects of releases on dependencies among microservices.
DevOps automation solution #5: 4 Golden signals Kubernetes
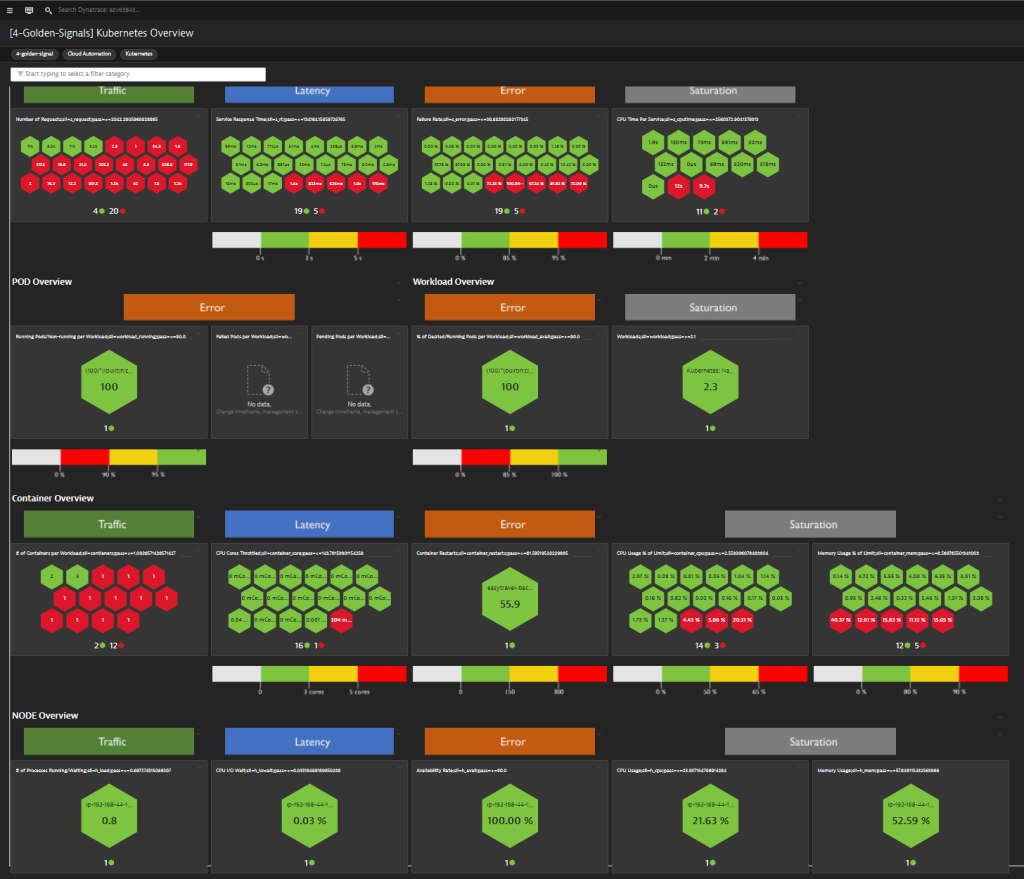
The 4 Golden Signals Kubernetes solution is the second solution focused on Google’s four golden signals of monitoring. This solution automatically generates a dashboard representing the monitored Kubernetes instances. The dashboard contains golden signals for microservices, pods, workloads, containers, and nodes. It also includes baselined thresholds to help identify problematic components.
Next steps for DevOps automation best practices
Once teams adopt an AI-driven observability platform like Dynatrace, there is no time to lose. A release will make its way into production one way or another. Make sure it is a reliable one. Dynatrace Cloud Automation gives SREs and DevOps confidence in the services they’re delivering.
As with everything, there are tried and true ways of defining SLOs. For more best practices, read the blog 7 steps to identify and implement effective Service Level Objectives (SLOs).
Also, check out this observability clinic, Unleash the Power of Events APIv2, which highlights how easy it is to implement these solutions into existing delivery pipelines.
To see how one customer implemented Dynatrace Cloud Automation to implement their own DevOps automation best practices, join us for the on-demand webinar, Successfully scaling DevOps.



Looking for answers?
Start a new discussion or ask for help in our Q&A forum.
Go to forum