Get the most out of Dynatrace Sofware Intelligence, with these alerting best practices.
“Use the Artificial Intelligence”, it is not a Jedi Trick.
Old School monitoring.
I have worked on many accounts where Dynatrace replaced tools such as Nagios and Solarwinds. Basically, what we call “first-generation” monitoring software.
These older tools require a lot of manual effort to set up correctly, especially when configuring alerts. They gather information infrastructure data such as CPU, memory and log files.
Users define alerting rules to notify the support teams when specific predefined conditions occur.
The configuration usually evolves organically other time when new issues are encountered, and new rules are added. The approach is very labour-intensive and typically application owners devise their own rules and thresholds by application and not by IT standards (SLAs) or business requirements.
So, what’s the problem?
Typically, applications owners who have little or no experience in monitoring, give requirements such as:
“If there are more than 2 HTTP errors code (4xx and 5xx) report it immediately” or report any errors in the logs etc. How do we know if this will affect the end-user?
People cannot predict how their applications are going to behave ahead of time. Applications will always have errors, but these errors don’t always warrant alerts as its not impacting end users and performance. It could be a validation error for instance.
A lot of people ask me to alert on HTTP 404 errors (missing link).
I have NEVER seen a web site with no broken links and trust me, I have seen many!
These issues usually never get fixed or are outside the IT’s department responsibility.
Self-service content management systems, for instance, allow non-IT staff to make content changes on production systems.
With this approach, the support team get flooded with alerts and must implement complex alert de-duplication engines to avoid spam.
Why is Dynatrace different?
Dynatrace belongs to the third generation of monitoring software where things have changed dramatically – for the better!
This also means it’s a big change for companies because they expect the same approach with Dynatrace, which means they won’t get the full value if used in the wrong way.
To explain this, I always use a quote from Henry Ford as an analogy.
When Henry Ford asked his customers what he could do for them, their answer was “a faster horse”!
He knew horse couldn’t go any faster, so he started to think out of the box to what could be faster. So did Dynatrace.
Let’s stick with the horse for a bit longer!
What happens when Dynatrace is used in the wrong way? “If you always do what you’ve always done, you’ll always get what you’ve always got.” Also, Henry Ford
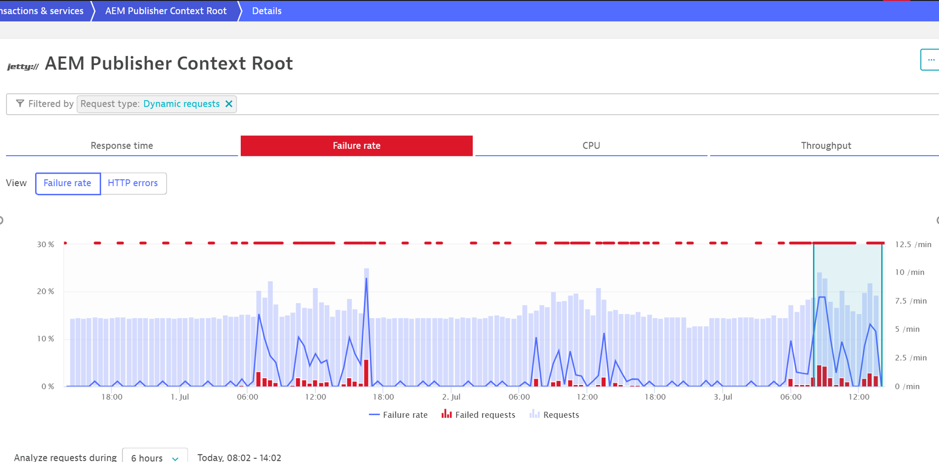
The below screenshot details a service which generates a lot of alerts. Each red line circled is an alert.
So, what happened?
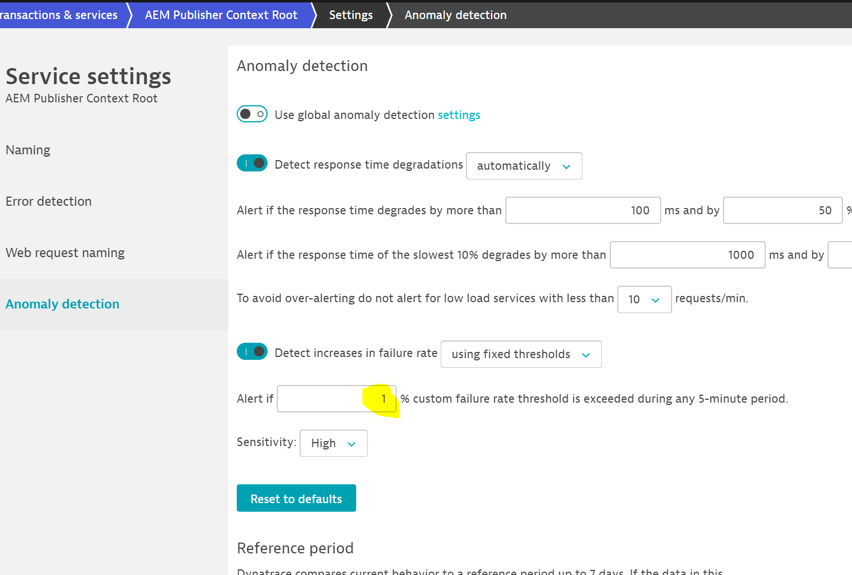
If we look at the properties of the service, a custom threshold was introduced, and the failure rate was set to 1% i.e. the user wanted to know about all the errors!
This will highlight the minutest failure and as you can see, is generating an alert storm. Imagine how long it would take to analyze each one of those alerts to see if it was impacting the end-user?
When using custom thresholds, the AI is no longer active, so each issue is reported.
What should we do?
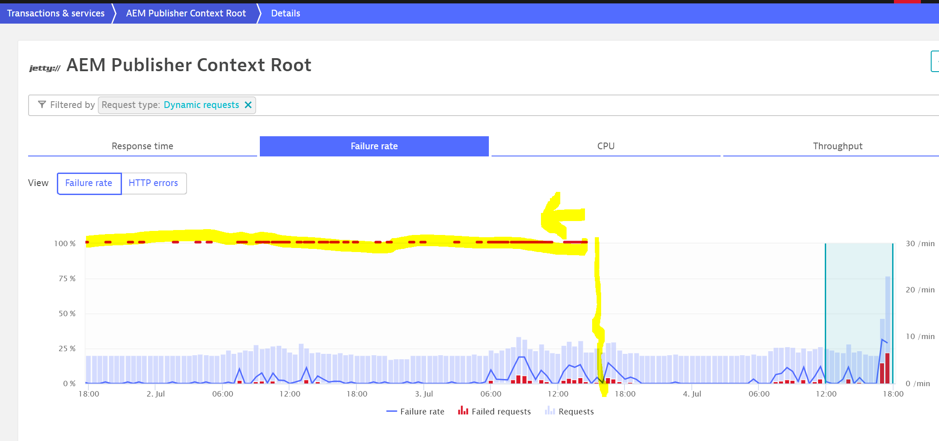
After resetting everything back to default, are we still picking up noise? No more noise!
The AI is deciding what is an acceptable threshold and it will tell you which alerts need investigating.
The change was applied after the vertical yellow line.
How does it work?
Monitoring is no longer about defining rules and thresholds, Dynatrace takes care of it.
Dynatrace automatically detects processes and services and will observe their behavior. It is called baselining. When the expected behavior changes an alert is raised.
For instance, if a web service has a constant failure rate of 2%, Dynatrace will think that it is normal and take this into consideration.
It’s important to know there is more going on than just detecting a threshold that has been reached. For instance, when there isn’t enough traffic (late at night), the AI will not act to avoid alert spamming.
If the same alert occurs regularly, Dynatrace will detect it and after a while, will not flag it anymore. This is called a frequent issue.
More information can be found here: https://docs.dynatrace.com/docs/observe-and-explore/davis-ai/anomaly-detection/detection-of-frequent-issues/
A frequent issue, in simple terms, would detect that a machine reaches 100% CPU each time a batch process runs at midnight and won’t alert once it learns this pattern.
There can be concerns when I explain that errors will be suppressed, but it isn’t suppressed forever!
Here is an example where an issue is no longer deemed as frequent because the situation got worse.
We can see below that the problem occurring after 12:00 is a frequent issue so there won’t be an alert.
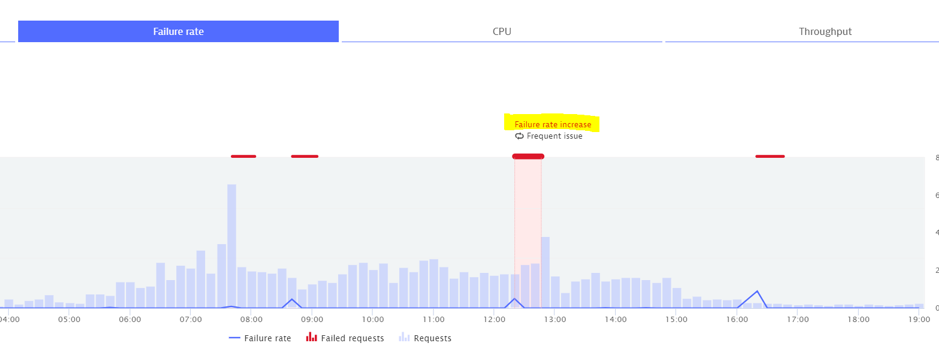
However, at 16:00, a new problem has been created. Why?
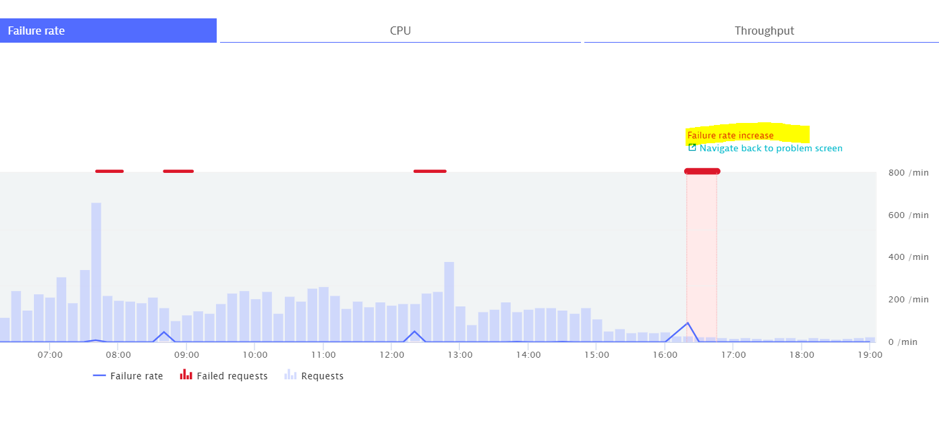
Is it simple, the failure rate was worse than expected. It went from 1.9% to 3.4%.
The following day, further failures were detected but they fell within the expected range, so it is flagged as a frequent issue and therefore no alert was sent out.
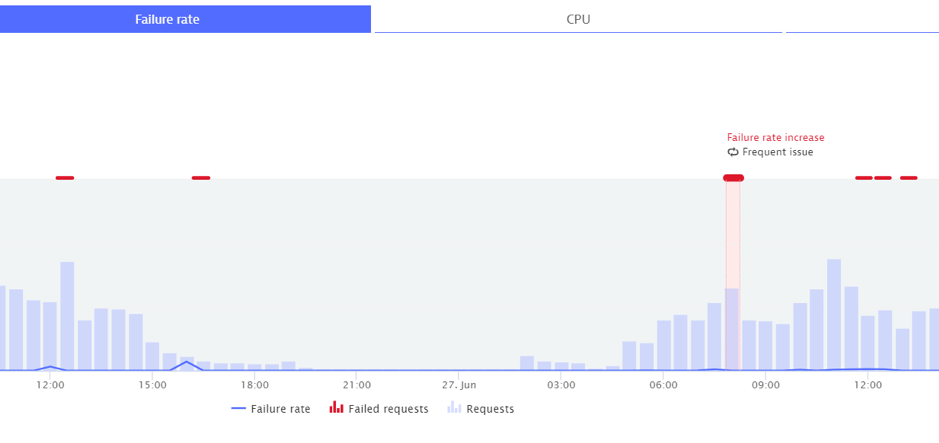
There are many more factors that influence what has been highlighted and what won’t and can’t be described in this short blog so just trust the AI!!!!
There is another important thing to know. This clever baselining only applies to Services and Applications. It doesn’t apply to infrastructure metrics such as CPU or memory. When using the default automatic settings, Dynatrace uses industry-standard best practice hardcoded values.
There is no point in observing that a host uses 20% of CPU and suddenly uses 40%. There is still plenty of capacity left so who cares?
Unless you use our log analytics solution, Dynatrace doesn’t even look at log files to decide whether something is failing. That’s another big cultural change!
If you want to understand how Dynatrace detects errors, read my other blog on how to fine-tune it!
Start a free trial!
Dynatrace is free to use for 15 days! The trial stops automatically, no credit card is required. Just enter your email address, choose your cloud location and install our agent.



Looking for answers?
Start a new discussion or ask for help in our Q&A forum.
Go to forum