As organizations adopt microservices architecture with cloud-native technologies such as Microsoft Azure, many quickly notice an increase in operational complexity. These complexities lead organizations to fundamentally transform the way they approach their observability capabilities in a dynamic multicloud environment. To guide organizations through their cloud migrations, Microsoft developed the Azure Well-Architected Framework.
Most monitoring tools for migrations, development, and operations focus on collecting and aggregating the three pillars of observability—metrics, traces, and logs. But managing these three data types at a scale becomes unsustainable for even the most experienced teams.
In a dynamic cloud environment, an organization undergoing cloud migration must go beyond the three pillars of observability by:
- Monitoring service level objectives (SLOs) before and after migration
- Analyzing user experience to ensure uniform performance after migration
- Getting precise root cause analysis when dealing with several layers of virtualization in a containerized world
- Understanding resource utilization for cost management
In this blog, we’ll review the five pillars of the Azure Well-Architected Framework and illustrate how organizations can use Dynatrace to ensure their applications are architected correctly.
What is the Azure Well-Architected Framework?
The Azure Well-Architected Framework is a set of guiding tenets organizations can use to evaluate architecture and implement designs that will scale over time. The Framework is built on five pillars of architectural best practices:
- Cost optimization
- Operational excellence
- Performance efficiency
- Reliability
- Security
Each pillar brings business and technology leaders together to help organizations choose architecture options that best strategically align to their specific business priorities as they begin their cloud journey.
At every step, Dynatrace provides integrations, precise root-cause analysis, and pinpoint precision fueled by AI and automation.
Cost optimization
This pillar of the Azure Well-Architected Framework encourages organizations to align their business goals with return on investment (ROI). Some principles Microsoft provides across this area include:
- Choosing the right resources aligned with business goals that can handle the workload’s performance.
- Continuously monitor cost and optimize your capacity needs.
- Utilize Azure SaaS and PaaS resources to pay only for resources you consume and increase or decrease usage depending on business requirements.
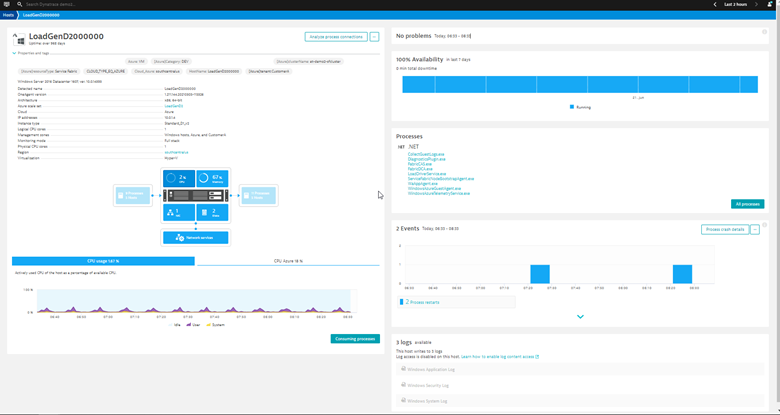
With Dynatrace’s full-stack monitoring capabilities, organizations can assess how underlying infrastructure resources affect the application’s performance. Using a data-driven approach to size Azure resources, Dynatrace OneAgent captures host metrics out-of-the-box to assess CPU, memory, and network utilization on a VM host. Figure 1 shows various host metrics and other data Dynatrace provides out of the box to help size your Azure host accordingly.
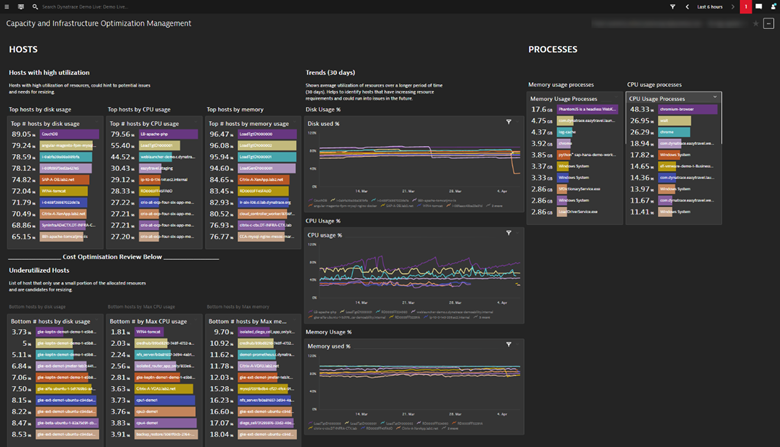
Right-sizing is an iterative process where you adjust the size of your resource to optimize for cost. Doing this on an ongoing basis requires you to monitor your application’s resources and performance health to help you make the cost/benefit analysis. With Dynatrace, you can display utilization metrics across multiple hosts onto a single dashboard to quickly assess which hosts are over and underutilized, as shown in Figure 2.
Operational excellence
The operational excellence pillar of the Azure Well-Architected Framework focuses on implementing best practices to keep an application running in production. To do that, organizations must evolve their DevOps and IT Service Management (ITSM) processes. This involves automating mundane tasks to reduce the chance of human error, proactively catching mistakes before they impact users, and facilitating team collaboration to address operational issues with applications.
Traditional observability solutions offer little information beyond dashboard visualizations. Instead, it remains up to human experts to correlate and analyze the data in time-consuming war rooms. In comparison, the Dynatrace platform reliably takes that burden off human operators by utilizing its causation-based AI engine, Davis. Using high-fidelity metrics, logs, code-level tracing, and a dynamic topology map of your applications, Davis can identify the precise root cause and prioritize its business impact.
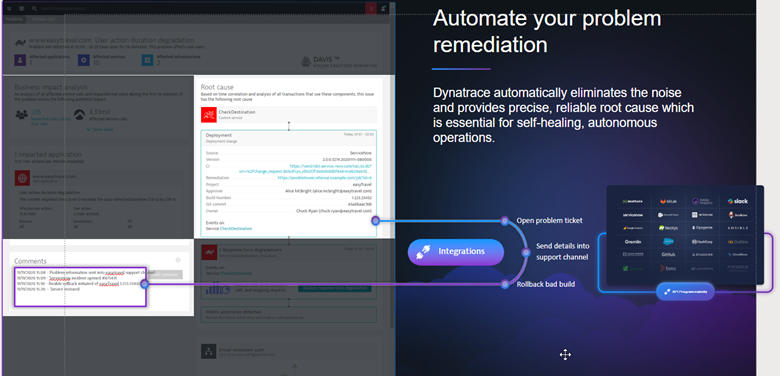
Let’s look at an example. In a situation where multiple back-end services impact a single application Davis will generate a single problem incident to identify all the entities impacted. This enables organizations to improve mean time to resolution (MTTR) and avoid alert storms. And since Davis has identified the precise root cause, you can take that data and automatically run a corrective action, as shown in Figure 3, by leveraging Dynatrace’s integrations with:
- Dynatrace’s Cloud automation to understand which changes caused SLO violations
- Incident management tools such as ServiceNow, PagerDuty, xMatters, or OpsGenie
- Collaboration tools such as Slack or JIRA
- Auto-remediation platforms such as Ansible Tower, StackStorm, or ServiceNow
With a single data model, not only can you slice and dice the data across infrastructure, applications, operations, and business data to provide shared context but also improve your organization’s approach to cross-team collaboration.
Performance Efficiency
With the Performance Efficiency pillar of the Azure Well-Architected Framework, organizations must ensure the workloads they modernize and migrate to the cloud are able to scale to meet changes in demand and usage over time. Some principles Microsoft provides to help organizations across this area include:
- Establish performance baselines
- Continuously monitor the application and the underlying infrastructure
- Design efficient use of your computing resources as demand changes and technologies evolves
To make an informed decision on what to optimize within your application, you must first collect baseline performance data. Once you have and understand this data, you can identify issues, find opportunities for improvement, and eliminate risks before you go through a costly migration exercise.
To optimize your back-end systems, you can use the service flow view within Dynatrace to identify layers of application architecture. To understand, reduce, and optimize back-end systems, the service flow diagrams can show common performance problems:
- Too many roundtrips between services
- Too much data requested from a database
- Too many fine-grained services leading to network and communication overhead
- Missing caching layers
- Missing retry and failover implementation
Once you’ve analyzed the service flow of your application, you can drill down into the hotspots view to quickly identify which requests have the slowest response times. Figure 4 shows how Dynatrace automates the analysis of service and service-to-service hotspots. For example, on the left side, we see a breakdown of how much time various types of calls contribute to other services. On the right side, we see the top hotspots Dynatrace identified. By clicking on one of the findings, you can drill deeper to get additional details about the downstream service call:
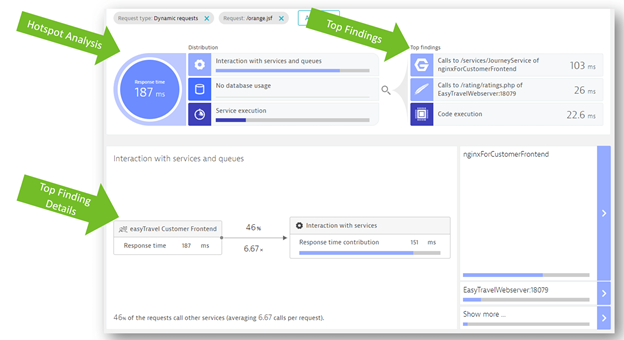
With the automated analysis of your code hotspots within Dynatrace, you can quickly identify bottlenecks and help you right-size your cloud resources.
Reliability
With the reliability pillar of the Well-Architected Framework, organizations must ensure they build resilient and available applications. Some principles Microsoft provides to help organizations across this area include:
- Define and test availability targets such as service level agreements (SLAs) and SLOs
- Design applications to recover from errors gracefully
- Monitor and measure application health
Figure 5 shows how the Dynatrace Software Intelligence Platform provides several different types of service-level indicators (SLIs) for defining your SLOs. It monitors those objectives’ status and error budgets while providing you with all the facts regarding the business, SLOs, and SLAs, and end-user experience.
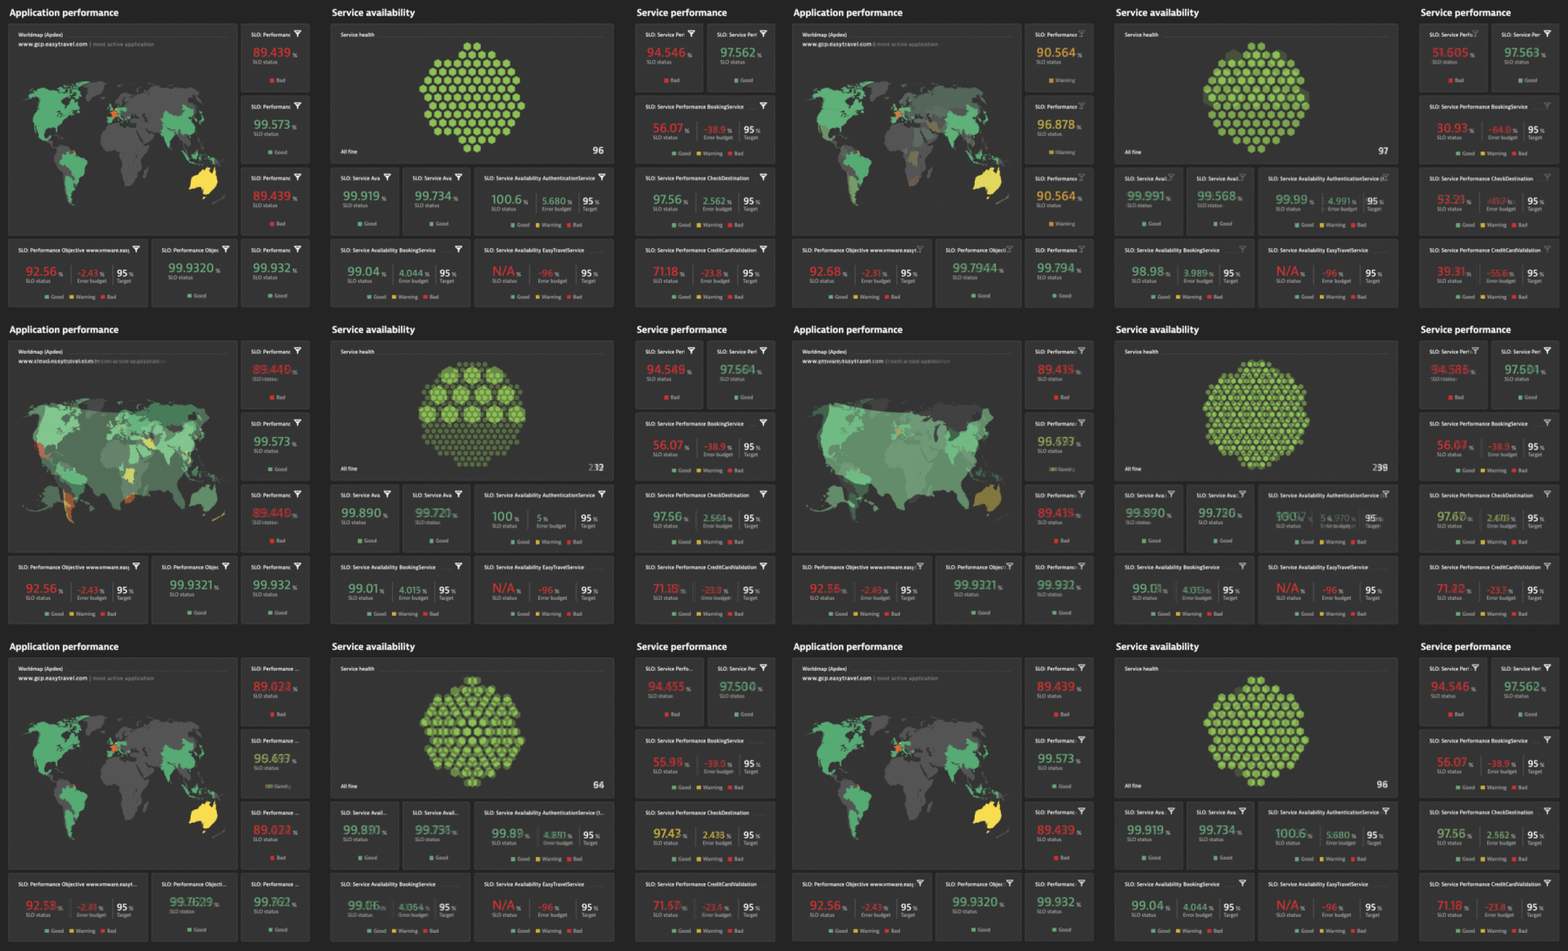
The Dynatrace SLO wizard provides guidance and templates for setting up SLOs with the right metrics and combines this with powerful problem root-cause detection and analysis. Davis® provides quick notifications for anomalies it detects with actionable root causes. As a result, when your SLO turns red, Davis has already notified you of the problem showing the root cause.
Once you have defined your SLOs for production reporting, you can also “shift left” to automatically evaluate each phase of the software delivery pipeline using the Dynatrace Cloud Automation module. The concept of “shift-left SRE” introduces SLOs earlier in the lifecycle to improve the quality and speed of your software releases.
Cloud Automation also enhances DevOps and SRE teams’ processes with automated closed-loop remediation of releases that fail in production. In addition, the module provides automatic release inventory and version comparison to evaluate the performance of individual release versions, and as needed, roll back to a previous version. As a result, organizations implementing Dynatrace to monitor their SLAs and SLOs and using that to “shift-left” have increased availability and resiliency within their applications.
To identify application performance issues before real users are affected, organizations should also leverage synthetic monitoring. Dynatrace Synthetic Monitoring simulates users’ activity using major desktops and mobile browsers from locations all around the globe to identify availability and performance, key transaction monitoring (such as login, purchase, checkout). Within synthetic monitoring you can do two types of tests:
- Browser tests where a robot client simulates a transaction with each user click;
- API tests where you can specify endpoints to test a specific workflow from and end-to-end for your application backend.
With synthetic monitoring, organizations can evaluate whether an application meets a specific SLO/SLA for critical business transactions. Moreover, with Dynatrace AI Automation, teams can focus on higher priority problems, which in turn significantly reduces the time teams require to identify and address root causes.
Security
The security pillar of the Azure Well-Architected Framework calls on organizations to think about security throughout the entire lifecycle of an application. Principles that Microsoft provides across this area include:
- Monitor and track security alerts
- Detect threats early and respond quickly
- Block attacks against exposed vulnerabilities
- Reduce your organizational risk
The Dynatrace Application Security module automatically detects, assesses, and remediates open-source and third-party vulnerabilities for Java workloads. The module combines security and observability data to automatically and continuously analyze applications, libraries, and code runtime in production and pre-production.
Figure 6 shows how Dynatrace automatically and continuously monitors any runtime vulnerabilities and provides in-depth answers on the type of vulnerability detected and which exact process was affected.
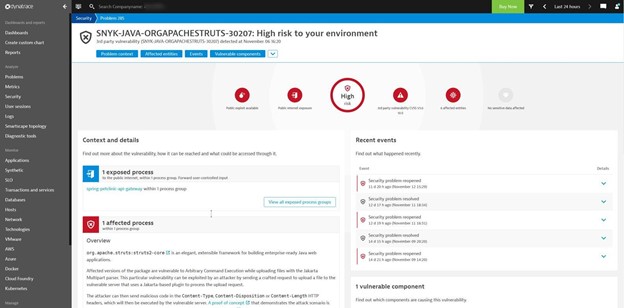
Collectively with OneAgent, Davis, PurePath, and Smartscape technologies, Dynatrace Application Security builds on these platform strengths to include features such as technologies. The module builds on these platform strengths to include features such as:
- Automatic and continuous vulnerability detection with precise risk and impact assessment to prioritize and focus on what matters the most and 100% runtime visibility
- Deep insights into production execution of open-source components and closed source software and containers.
- Automatically detects and blocks vulnerability attacks in real-time like Log4Shell with no configuration.
- One single platform that drives efficient DevSecOps collaboration and automated vulnerability management
As a result, organizations that adopt Dynatrace Application Security have visibility and security across the entire SDLC, with Davis automatically detecting and blocking any vulnerability.
Dynatrace and Microsoft Azure integrations
Together, Dynatrace and Microsoft help enterprises stay on top of their complex, dynamically scaling Azure cloud environments through integrations and monitoring capabilities. Here is a summary of the growing list of Dynatrace integrations for Azure:
- Compute – Dynatrace OneAgent provides full-stack monitoring for Azure Virtual Machine and Virtual Machine Scale Sets.
- Azure Monitor – Fully integrated with entire set of services that publish to Azure Monitor, including Azure Alerts.
- Serverless – Deploy OneAgent via ARM templates or Site Extensions for Azure App Server or Azure Functions to get code level insights.
- Containers & Kubernetes (AKS) – Dynatrace OneAgent provides extensive monitoring of Azure Kubernetes Service pods, nodes, and clusters.
- Azure Service Fabric – Our OneAgent installs as a VM extension on Azure Service Fabric to easily provide full-stack monitoring.
- Azure Automation – AI-driven anomaly detection of jobs.
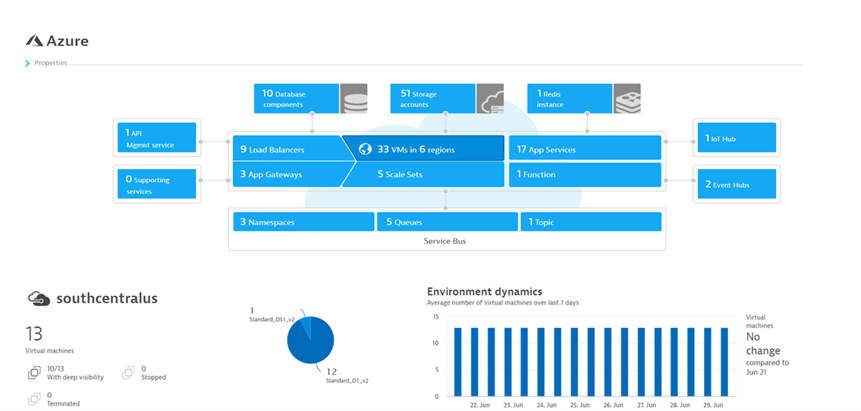
As depicted in Figure 7, Dynatrace’s native integration with Azure Monitor collects all the metrics from various Azure services such as virtual machines.
Next steps with Dynatrace and the Azure Well-Architected Framework
Check out Dynatrace’s listing in the Azure Marketplace to see how easy it is to get started. To learn more, check our webinar with Microsoft: Monitor and modernize Azure operations with Dynatrace.



Looking for answers?
Start a new discussion or ask for help in our Q&A forum.
Go to forum