Andreas Grabner explains how Dynatrace gives MaaSS for Developers, Operators, DevOps, as well as Business at a SaaS-based eCommerce platform.
Kubernetes (k8s) provides basic monitoring through the Kubernetes API and you can find instructions like Top 9 Open Source Tools for Monitoring Kubernetes as a “do it yourself guide”. For EKS – Amazon’s Kubernetes Service – you can get a preview of CloudWatch Container Insights. But every organization I talked with, that is engaged in a k8s project, told me that in order for them to truly leverage k8s as a cloud native platform you need ALL of the following “Monitoring as a Self-Service Capabilities” (MaaSS) which aren’t covered by any of the open source or platform offerings:
- K8s cluster and pod health monitoring
- Full-stack observability
- End-to-end code-level tracing
- Service mesh insights
- Cluster and container Log Analytics
- End-user monitoring
While this reads like a feature capability matrix of most monitoring and observability tool vendors there is a difference on how these capabilities integrate. Some vendors have just bolted on individual capabilities which often leads to six data silos. What we need though is data that is automatically connected with context for k8s administrators, architects and developers to better understand what is going in the part of k8s that’s relevant to them and how does it impact those parts that are relevant for their colleagues.
Instead of presenting you with a handful of random screenshots from our demo environment I reached out to Robert, a close friend of mine, who leads a development team with the current task to re-architect and re-platform their multi-tenant SaaS-based eCommerce platform. Their technology stack looks like this:
- Spring Boot-based Microservices
- NGINX as an API Gateway
- PostgreSQL & Elastic for data storage
- REDIS for caching
- AWS EKS for Integration and Production
Robert allowed me to take a couple of screenshots from their Dynatrace environment and with that, in this blog I try to explain how Dynatrace gives them MaaSS for Developers, Operators, DevOps as well as Business.
MaaSS for Business: Data per SaaS-Tenant
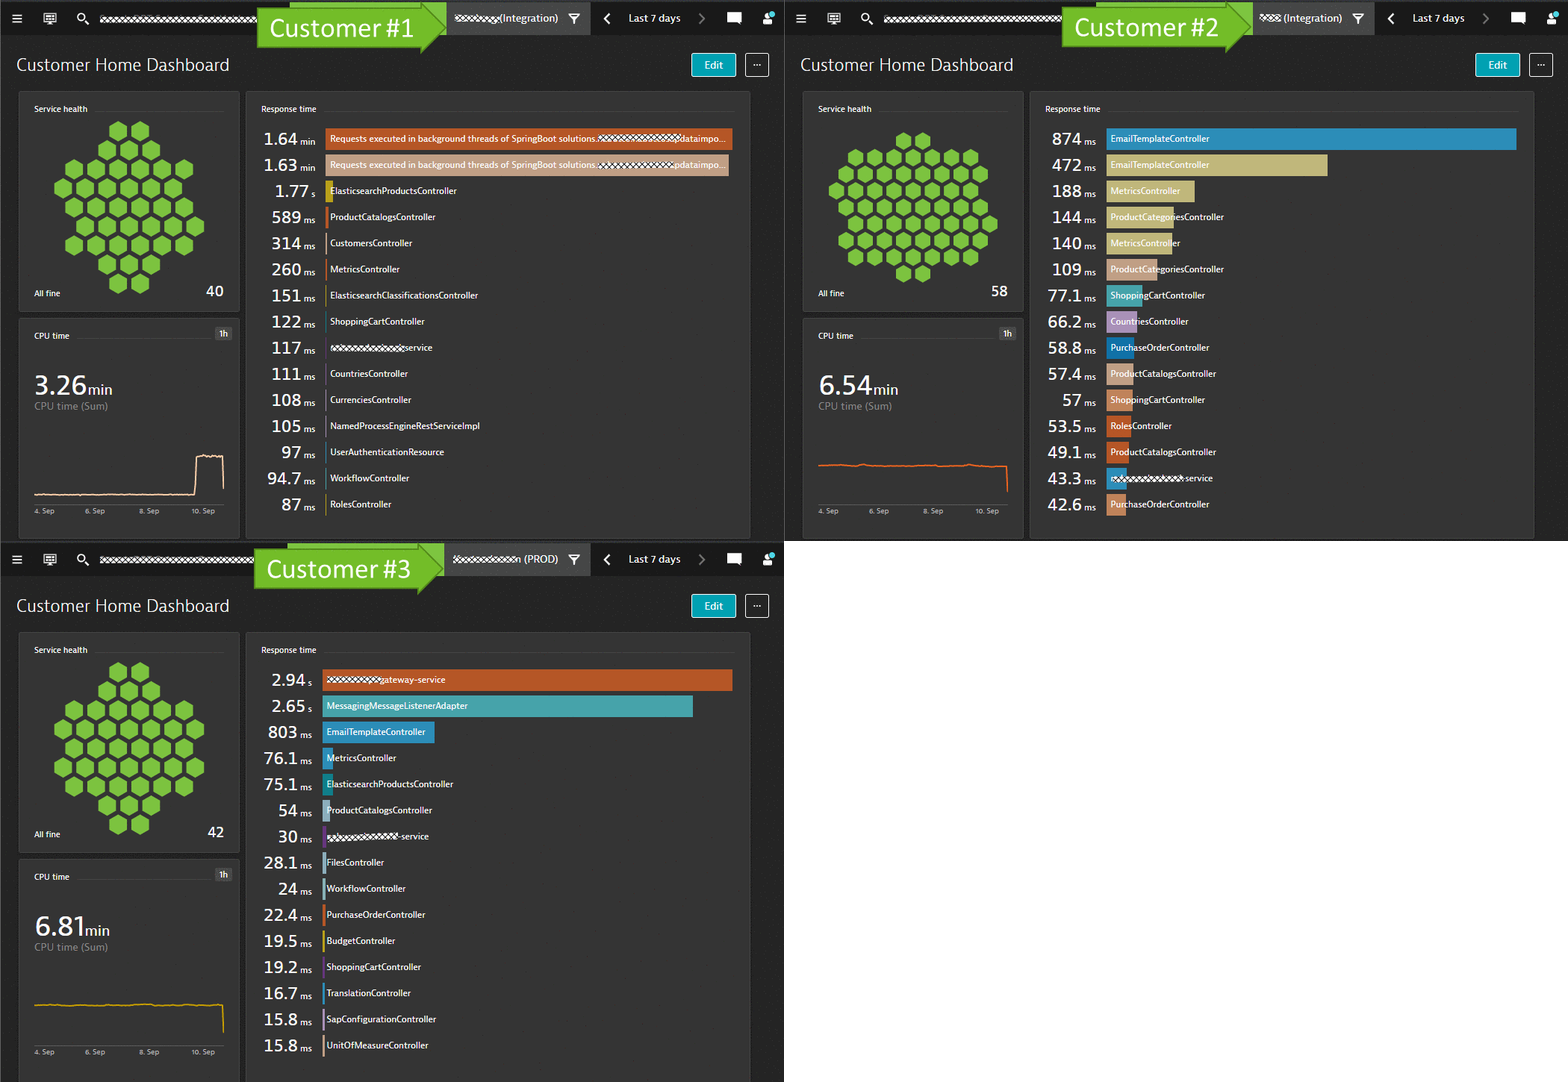
Robert’s business teams are interested in seeing data specific to individual tenants of their SaaS-based multi-tenant eCommerce platform, e.g. active users, page impressions, items in shopping cart, conversion rates, revenue etc.
The Business teams therefore built a set of dashboards that contain the data they want to see. In order to filter these dashboards by tenant all they need is a Dynatrace Management Zone, which is based on meta data extracted by Dynatrace from e.g. k8s tags, container labels or process environment variables.
As the DevOps teams automatically tag each deployed container in CI/CD with information Dynatrace becomes automatically aware of which container instances handle requests for which tenant in which environment.

And those tags are automatically evaluated when business switches between management zones.
MaaSS for Cloud Architects: Deployment and Architecture Validations
While Kubernetes provides built-in capabilities to query deployed pods and services it lacks the capabilities required to truly validate a correct deployment for a given load or environment, as well as validating whether services correctly connect through proxies and service meshes.
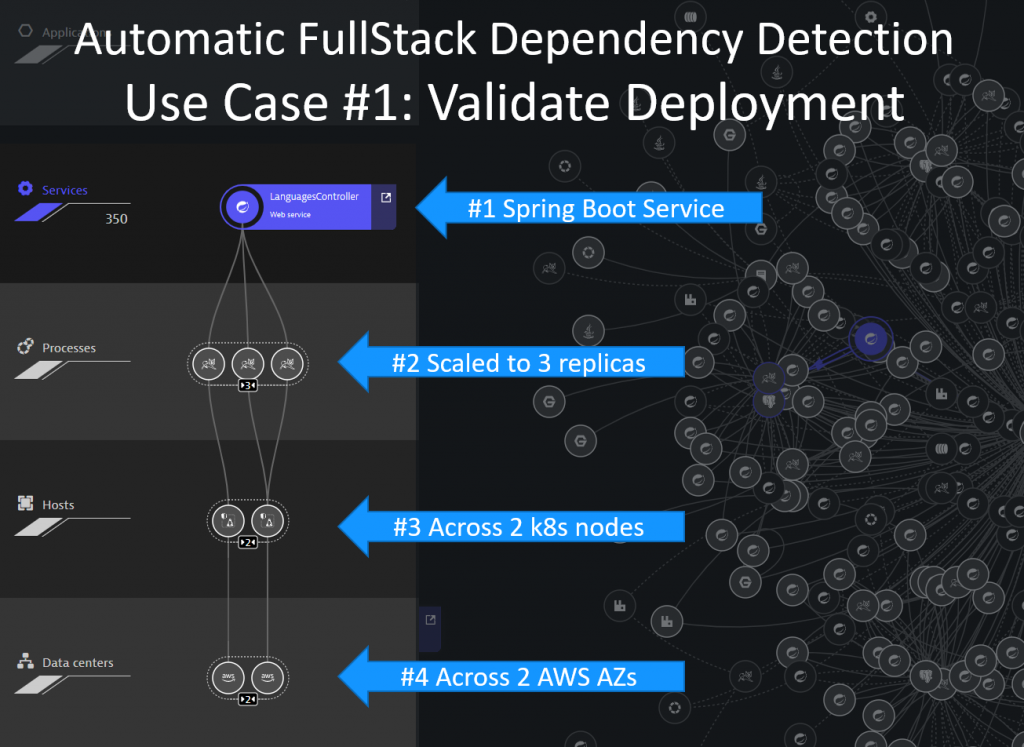
#1 Validate Deployment
Thanks to Dynatrace OneAgent, and its automatic full-stack dependency detection, cloud architects can easily validate how and where each service is deployed. When focusing on the LanguageController service we learn that it’s currently deployed in three pods across three EKS nodes across two AWS Availability Zones (AZ). If you have specific requirements for specific users to e.g: deploy the LanguageController in Europe, you can also use Smartscape data to validate that.
If there would be a problem within an AZ, a specific node or individual pod instances then Dynatrace would highlight those exact entities:
#2 Validate Configuration
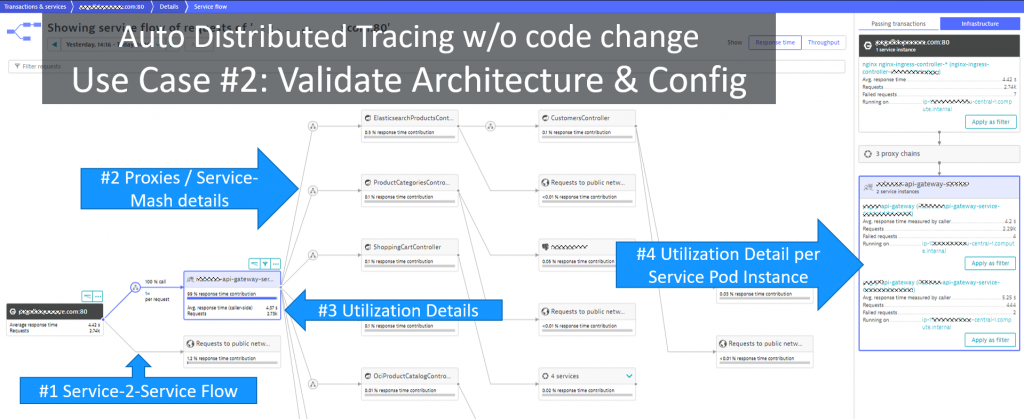
Dynatrace’s PurePath technology brings us automatic end-to-end code level tracing without having to modify any code or configuration. Thanks to PurePath, architects can validate how transactions flow from service-to-service and how traffic gets routed through service meshes (AWS App Mesh, Istio, Linkerd) or proxies. Dynatrace also highlights the utilization details of every service pod instance. This allows us to detect bad pod instances that should be recycled and allows us to compare different versions of the same service in case you do canary deployments.
#3 Automatic Problem Detection
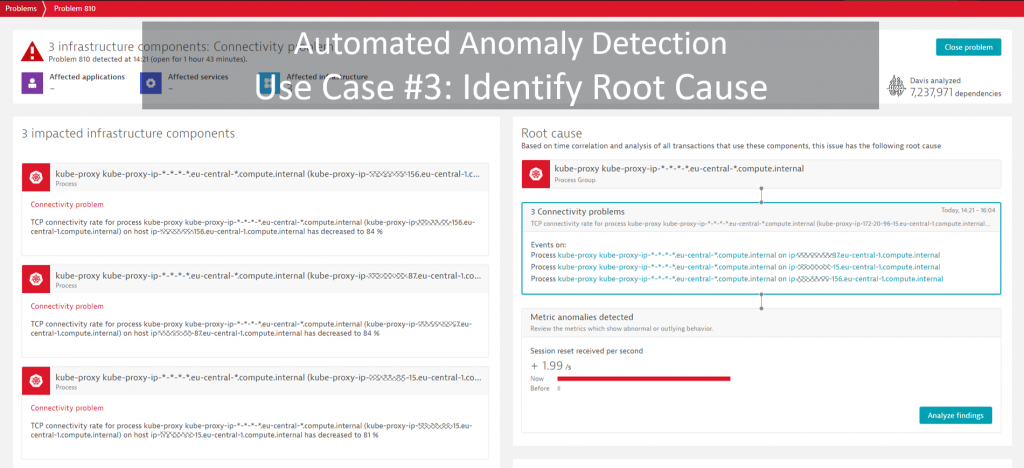
Dynatrace not only visualizes this and more data, but our deterministic AI engine – Davis® – automatically detects anomalies across all monitored and observed entities: hosts, containers, services, proxies, end users and more.
In the event that there’s a problem, Dynatrace will automatically highlight the hotspot and root cause in the different Dynatrace views. More importantly though, Dynatrace will put all the collected evidence together into a Problem ticket as shown below. With the existing notification integrations for tools such as Slack, xMatters, ServiceNow, Lambda, JIRA, you can also pro-actively notify people in case there’s a problem:
If you’re a cloud architect, I assume you understand the benefit of having this data available without having to modify any container images or configuration. If you’d like to learn more about dependency detection, deployment and architecture validation check out my YouTube tutorials on Basic & Advanced Diagnostics where I cover Smartscape and PurePath!
MaaS for k8s Administrators
Dynatrace OneAgent not only monitors your hosts or what’s happening within the containers, but also pulls in additional data from the Kubernetes cluster via the k8s API and AWS via CloudWatch API.
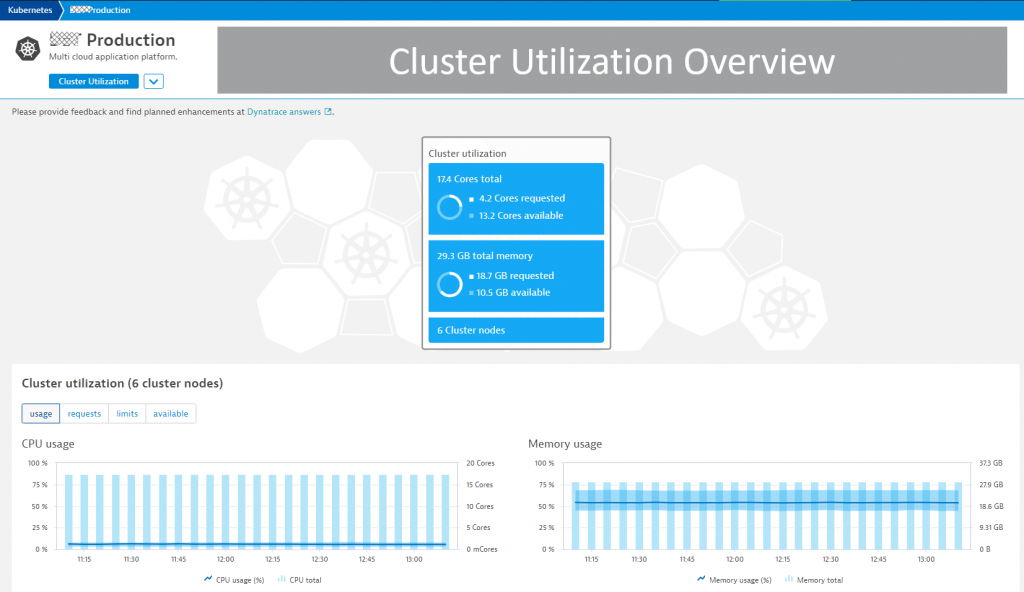
#1 Cluster Utilization & Health Overview
Under the Kubernetes menu item, you get access to the Kubernetes dashboards for each k8s cluster. Robert’s k8s administrator likes the following easy to consume overview of resource usage, limits and requests. The historical view makes it easy to identify hotspots and trends:
#2 Node Utilization and Health
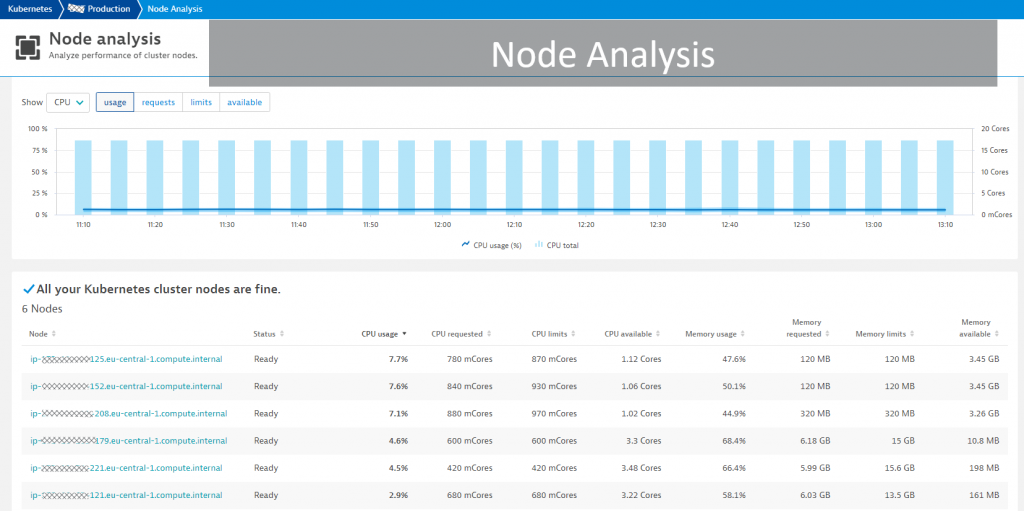
Another important view is the historical data across all nodes, which allows administrators to spot deployment imbalances as well as under or overprovisioned nodes:
#3 Utilization from a Container perspective
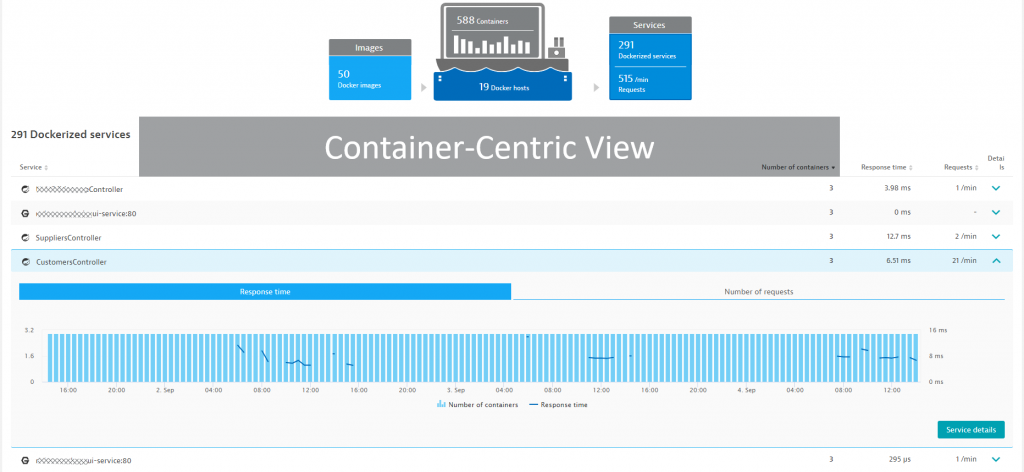
If there are issues with teams deploying too many containers or individual containers consuming more resources than planned it’s beneficial to have a container centric view which Dynatrace provides as well. Under the Docker, we get to learn everything we need to know about all containers deployed:
- How many images in total and what’s their size?
- How many containers deployed in total and what’s their size?
- Where are these containers deployed exactly?
- What’s the resource consumption, response time and throughput per container?
- To which application, team or tenant does a container belong to?
#4 AWS EFS monitoring
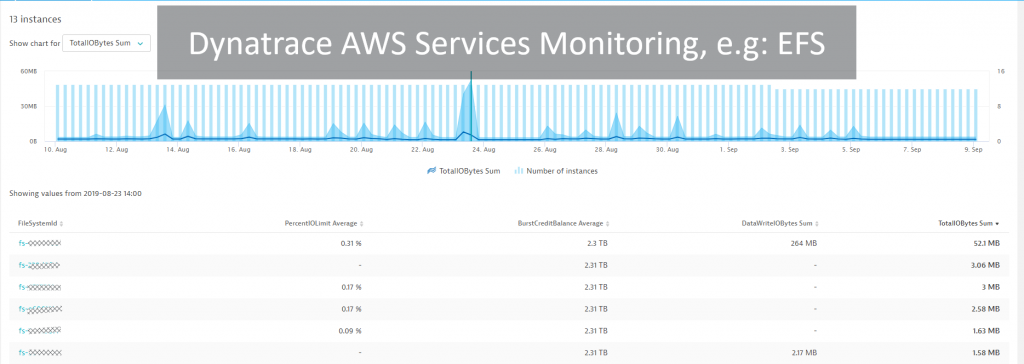
Dynatrace monitors AWS specific services such as Load Balancers, RDS, DynamoDB, Lambda, EFS, … through the CloudWatch API. Robert’s AWS & EKS admin team are monitoring most services with that capability but found it beneficial for them to have Dynatrace monitor Elastic File Storage (EFS). Sporadically, they have issues with EKS nodes failing and it turned out that the root cause was an issue with EFS accessibility. Having Dynatrace also looking at key EFS metrics gives them additional root cause information in case something goes wrong. These dashboards also allow them to get a better idea on storage usage and trends as they onboard new users to their SaaS offering:
If you’re an IT or cloud administrator, make sure to check out Dynatrace’s capabilities on monitoring k8s clusters, AWS, VMWare, OpenStack, Azure, Google GCP, OpenShift, CloudFoundry. Dynatrace gives you a consistent view across your hybrid cloud environment, allowing you to make better decisions on where workloads currently are and how to move them better and faster to where they belong to.
MaaS for Developers: Understand and optimize your code
Once Dynatrace OneAgent is monitoring the k8s cluster it gives you code-level visibility into every container that gets deployed including visibility into each incoming service call, executed database queries, invoked external services, written logs as well as handled and unhandled exceptions.
#1 User Experience Optimization
In Robert’s case, the front end to their eCommerce solution is developed in Angular. Whether it’s Angular, or any other popular JavaScript framework or even if the door to your applications is a mobile native app (iOS or Android), Dynatrace has the capability to monitor every end user and every interaction from either browser or mobile native app. Below is a screenshot which demonstrates how Robert’s frontend team has used many times in the past to help them to understand real end-user page load behavior:
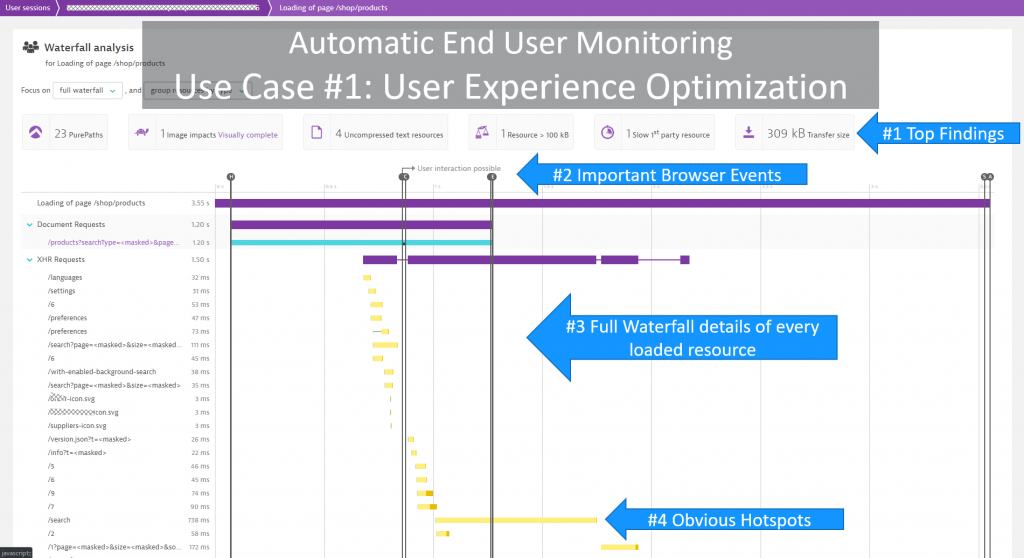
For more details on how to use Dynatrace for Web Performance Optimization, solving JavaScript errors or mobile crashes check out my YouTube Tutorials on these topics.
#2: Distributed code optimization
Dynatrace provides many automatic hotspot detection views; when Dynatrace detects a slowdown, an availability issue, or when you use the Diagnostics views and ask Dynatrace to show you the hotspots of a particular endpoint or of all requests that came in during a particular timeframe, e.g. load test or peak production load.

The underlying data for this analysis is the automated end-to-end trace that’s provided by OneAgent for all supported technologies. For technologies not directly supported we provide the Dynatrace SDKs (OpenKit, OneAgent SDK), and in the near future we’ll also be able to consume data from systems instrumented based on the OpenTelemetry standard, which Dynatrace is a leading member of.
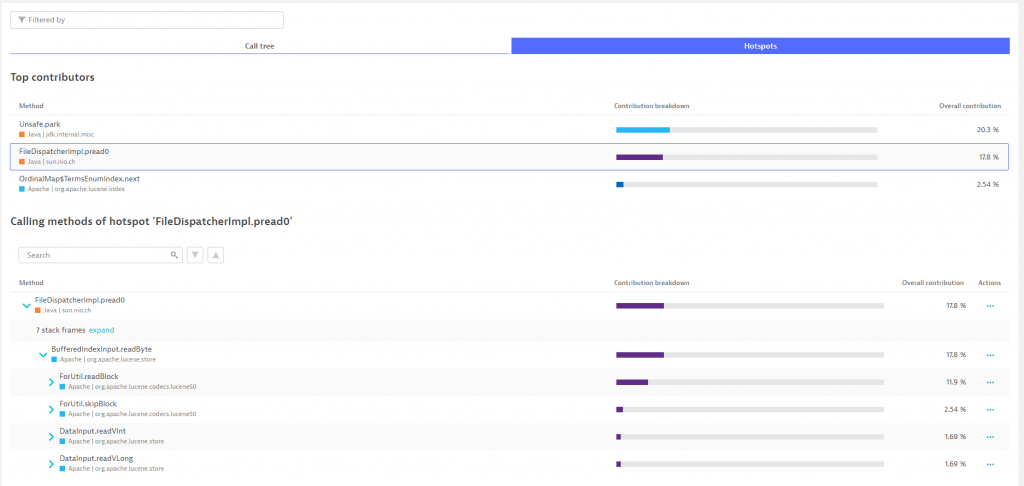
Robert’s development team has started using Dynatrace to optimize their server-side implementation on a regular basis, which ensures they’re not introducing any bad performing code, unnecessary calls to depending services or querying the same data multiple times in the same transaction instead of fetching it from a cache. Besides using diagnostics screens above they sometimes drill down to the individual Dynatrace PurePath’s as shown in the following screenshot:
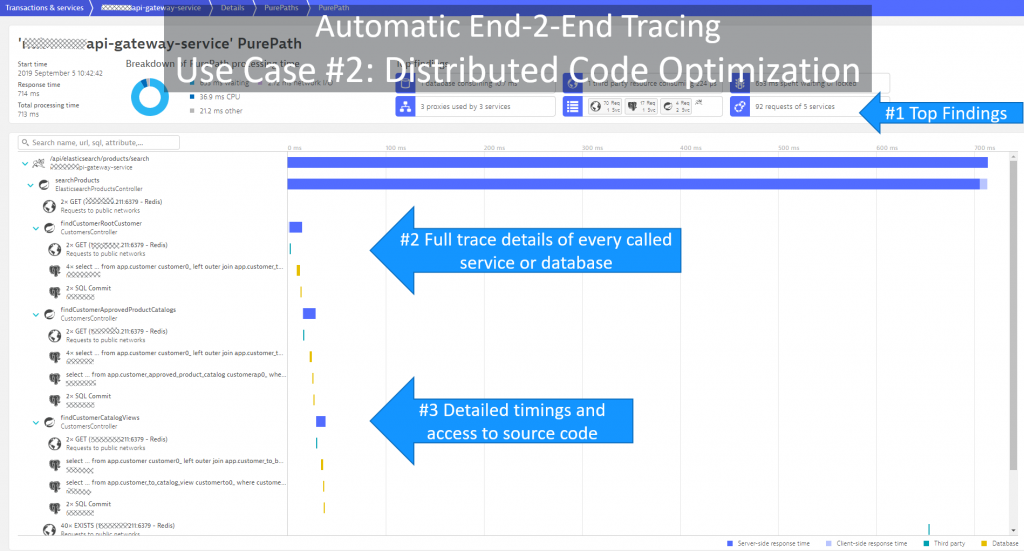
#3 Log Analytics
While Dynatrace’s distributed tracing gives you automated code level visibility, we understand that having the logs in the context of these traces combines the best of both worlds. Dynatrace OneAgent automatically detects log files written by your containers and we have additional capabilities to ingest logs via integrations.
If you want to learn more about log analytics, check out my YouTube tutorial on Log Analytics and look out for our product team’s blog on log analytics.
Below is a screenshot showing some of the logs Dynatrace has captured on Robert’s k8s production cluster – all in context with Smartscape, which allows Dynatrace to also factor in log events into its problem and root cause detection:
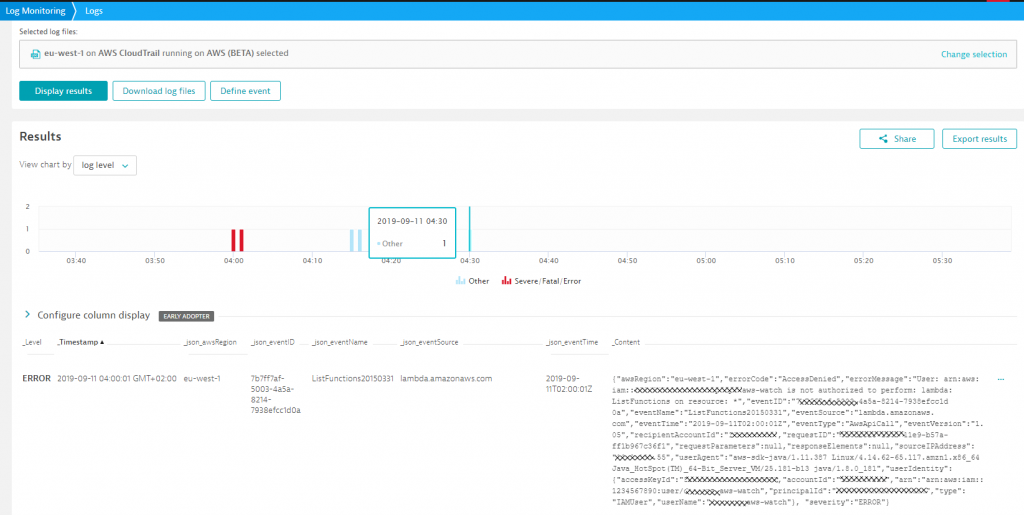
If you’re are a developer, then MaaSS for your k8s deployed containers gives you automatic feedback on where your code has performance or scalability bottlenecks. If you want to learn more check out my YouTube Tutorial on Advanced Diagnostics.
Monitoring as a Self-Service is just the First Step
Providing MaaSS as explained here not only allows you to better leverage the k8s platform and build better cloud native apps from the start. Within our organization, and with some of our customers, we’ve seen that having data accessible as a self-service enables a cultural shift towards more engineering autonomy. Engineers feel more empowered as they get immediate feedback on their code in production. They also start to feel more responsible for their actions for the same reason.
Once this first very important step is done it’s time to make the next steps towards what we call “Autonomous Cloud Management” (ACM). ACM has four building blocks, which we already discussed the first:
- #1: Automate Monitoring aka “Monitoring as a Self-Service”
Monitoring has to be fully integrated into every environment and be consumable as a self-service for development, quality engineers, architects, DevOps, SRE, Operations & Business. - #2: Automate Quality aka “Performance as a Self-Service”
Integrate Monitoring with your Continuous Performance Testing practices by allowing everyone to request specific performance feedback as a self-service. - #3: Automate Delivery aka “Unbreakable Continuous Delivery”
Integrate Monitoring into your Continuous Delivery pipeline. Let it act as quality gates in pre-production and as deployment validation for blue/green, canary deployments. - #4: Automate Operation aka “Through Auto-Remediation to NoOps”
Integrate Monitoring into your auto-remediation efforts. With increased level of automation, you’ll reach a state where no traditional operation tasks are needed to keep a system in a healthy state.
Your first steps start here
If you want your cloud native projects to succeed, make sure you can provide MaaSS to everyone involved. If you don’t yet have Dynatrace, simply sign up for the SaaS-based Trial. The steps you must do in order to get the same level of visibility as Robert and his team are:




Looking for answers?
Start a new discussion or ask for help in our Q&A forum.
Go to forum