Dynatrace gives you out-of-the-box service-level insights into Istio Ingress/Egress Envoys with all the benefits that Dynatrace is known for: the Davis AI causation engine and entity model, Smartscape automatic topology detection, auto-baselining, automated error detection, and much more.
The popularity of microservices and container platforms like Kubernetes and Cloud Foundry is in large part due to the associated benefits of faster deployment cycles, more flexibility in resource utilization, and reduced technology/vendor lock-in. These are however just some of the reasons why we’re now seeing these platforms in use in customer environments around the world.
The increasing number of smaller, decoupled services brings new challenges for controlling complexity within systems. To solve these operational challenges around deployment, resilience, and security, many Kubernetes users are adopting service meshes, like Istio. However, in order to enable Istio to effectively solve such operational challenges, you need to have visibility into Istio’s critical components.
Instantly see what’s going on in your Istio Ingress/Egress Envoys
Unlike other solutions on the market that force you to manually deploy and configure monitoring, Dynatrace gives you out-of-the-box service-level insights with full end-to-end traces into your microservices. Additionally, with OneAgent version 1.205, out-of-the-box service-level insights into your Istio Ingress/Egress Envoys is also generally available. Of course, this comes with all the benefits that Dynatrace is known for: the Davis® AI causation engine and entity model, automatic topology detection in Smartscape, auto-baselining, automated error detection, and much more.
Understand Istio, the Kubernetes native service mesh
Istio is one of the most popular service meshes It allows you to manage complex microservice architectures based on configuration—there’s no need to change any application code. Although Istio is essentially platform agnostic, it’s used primarily on Kubernetes-based platforms where to address a broad spectrum of operational requirements, including simple operations like automatic load balancing and more complex operations like applying rich routing rules, fail overs, or fault injection. Istio manages this with the help of Envoy, a lightweight remote configurable proxy server that can dynamically route traffic through a service mesh. Envoys are injected as sidecars next to each microservice (in Kubernetes these are dedicated containers in the same Pod) and they’re also often used as ingress and egress gateways.

In an Istio managed service mesh the Envoys determine how specific requests are to be handled. Therefore, Envoys come with basic built-in distributed tracing capabilities based on OpenTracing. One often over-looked fact is that, unless all deployed services/applications propagate trace headers, full end-to-end tracing is not possible. One other drawback is that some manual configuration is required just to make basic tracing work. This, combined with the need to manually adapt all microservices, often disqualifies Istio managed service mesh as a viable solution for larger, more complex environments.
Easily identify bottlenecks with out-of-the-box service-level insights into your Ingress/Egress Envoys
With OneAgent version 1.195 we added the capability to get service level insights for the Ingress and Egress Envoy proxies. This is especially important as these are the gatekeepers for all incoming and outgoing traffic. This works with no manual configuration changes just by deploying OneAgent via the OneAgent Operator or the Helm script on Kubernetes. All this comes with the insights that OneAgent delivers out-of-the-box, like service and application metrics, deep code level insights, automated topology detection, and much more.
If your applications and microservices are already monitored by Dynatrace, OneAgent will take care that the trace headers are automatically propagated through your monitored services and applications—and that sidecar proxies are displayed as proxies in the Service flow.
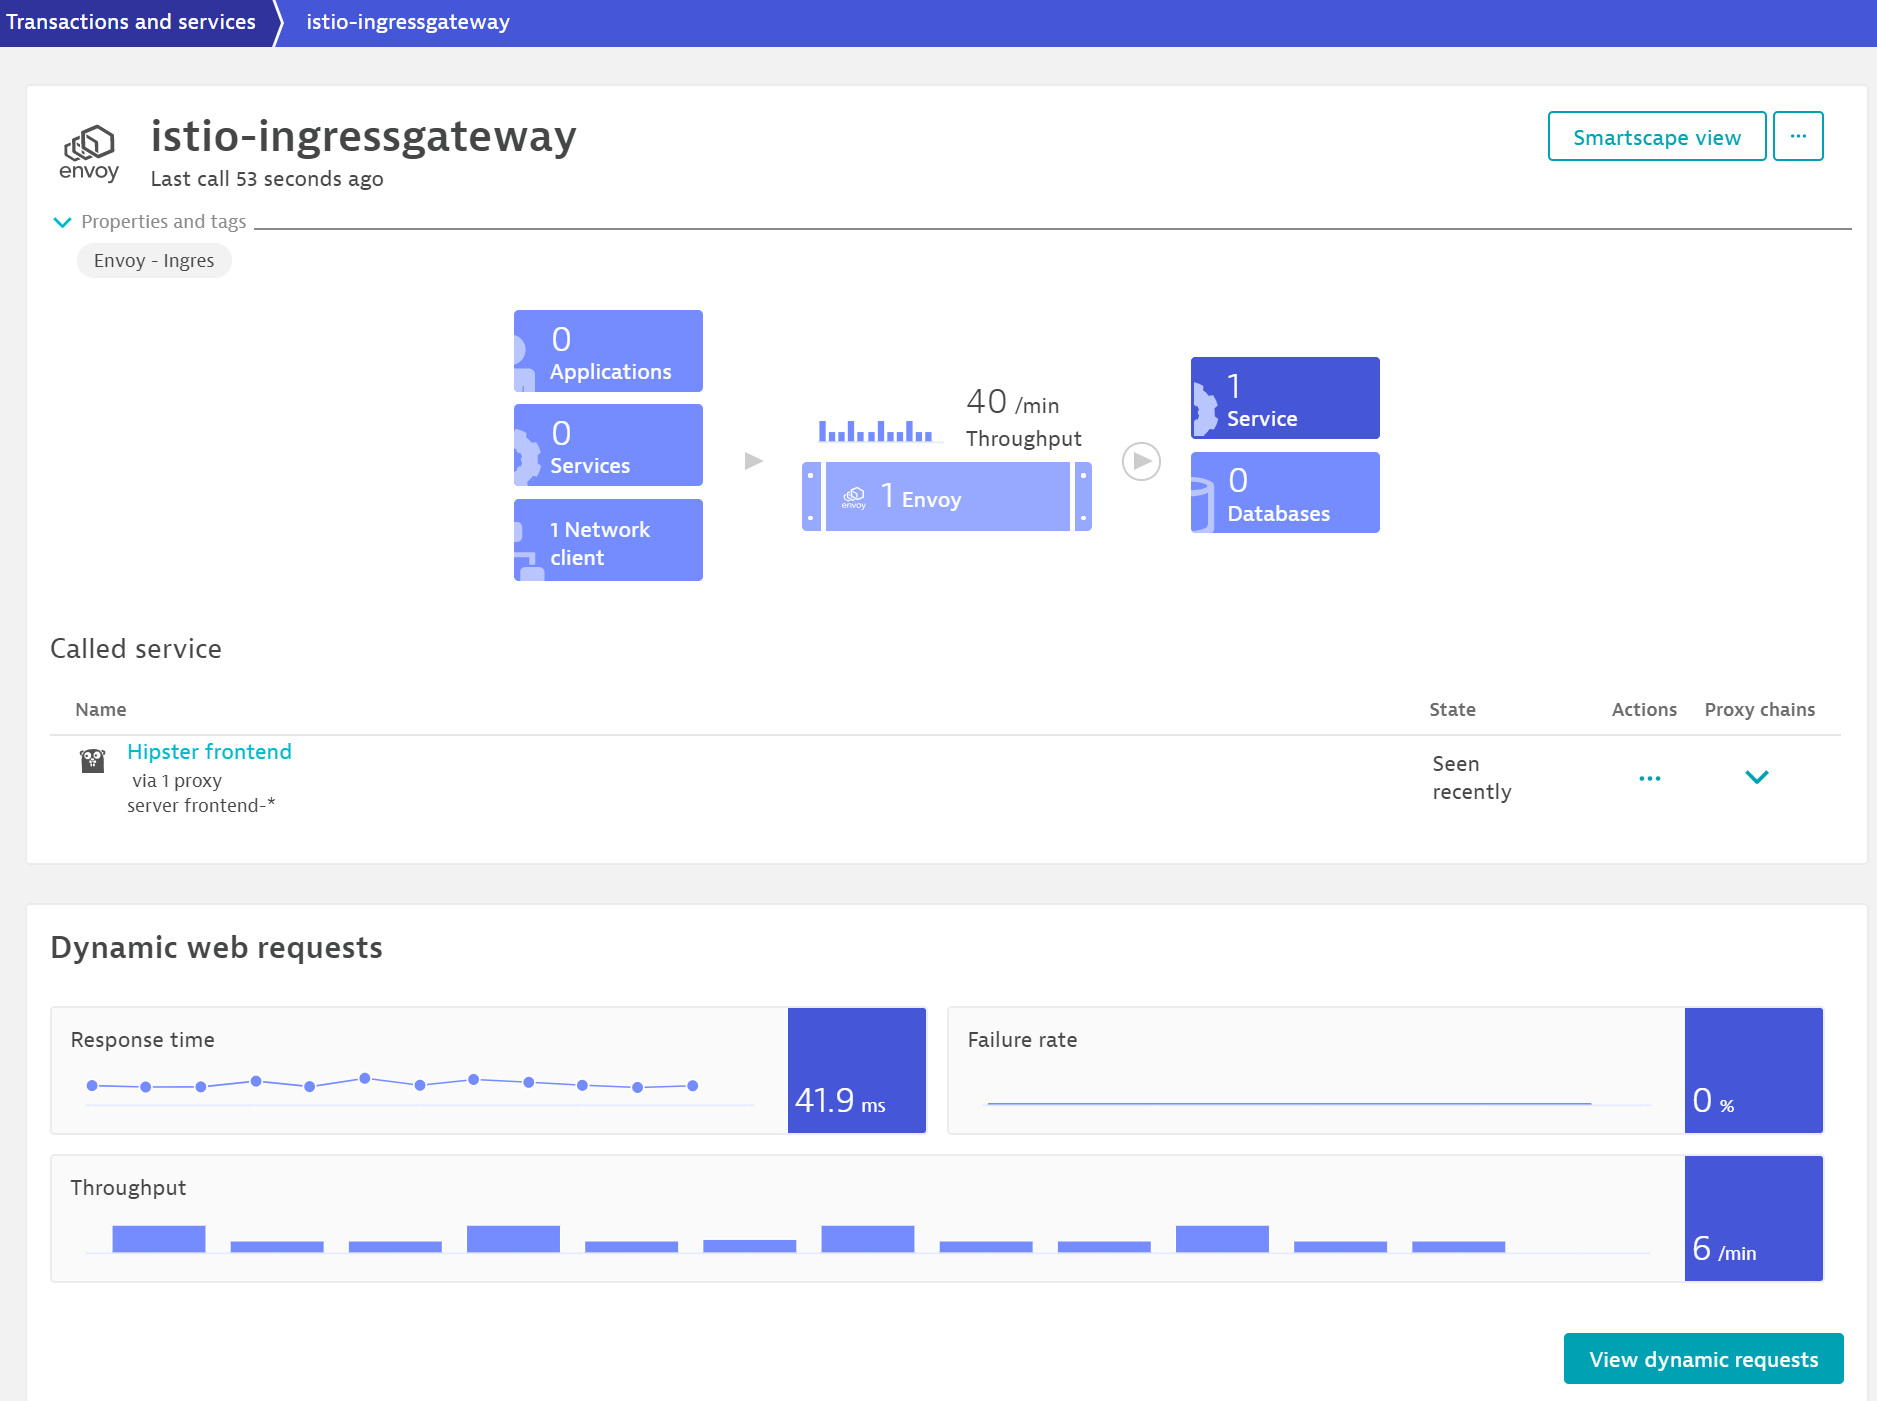
As soon as Envoy monitoring is activated, Dynatrace begins automatically detecting dedicated services for your Envoy-based Ingress and Egress gateways. You get all the benefits of having the Envoys included in the Davis AI entity model together with automatic baselining and error detection.
Below you can see the Istio-ingressgateway that forwards requests to our Hipster-front-end sample web application.

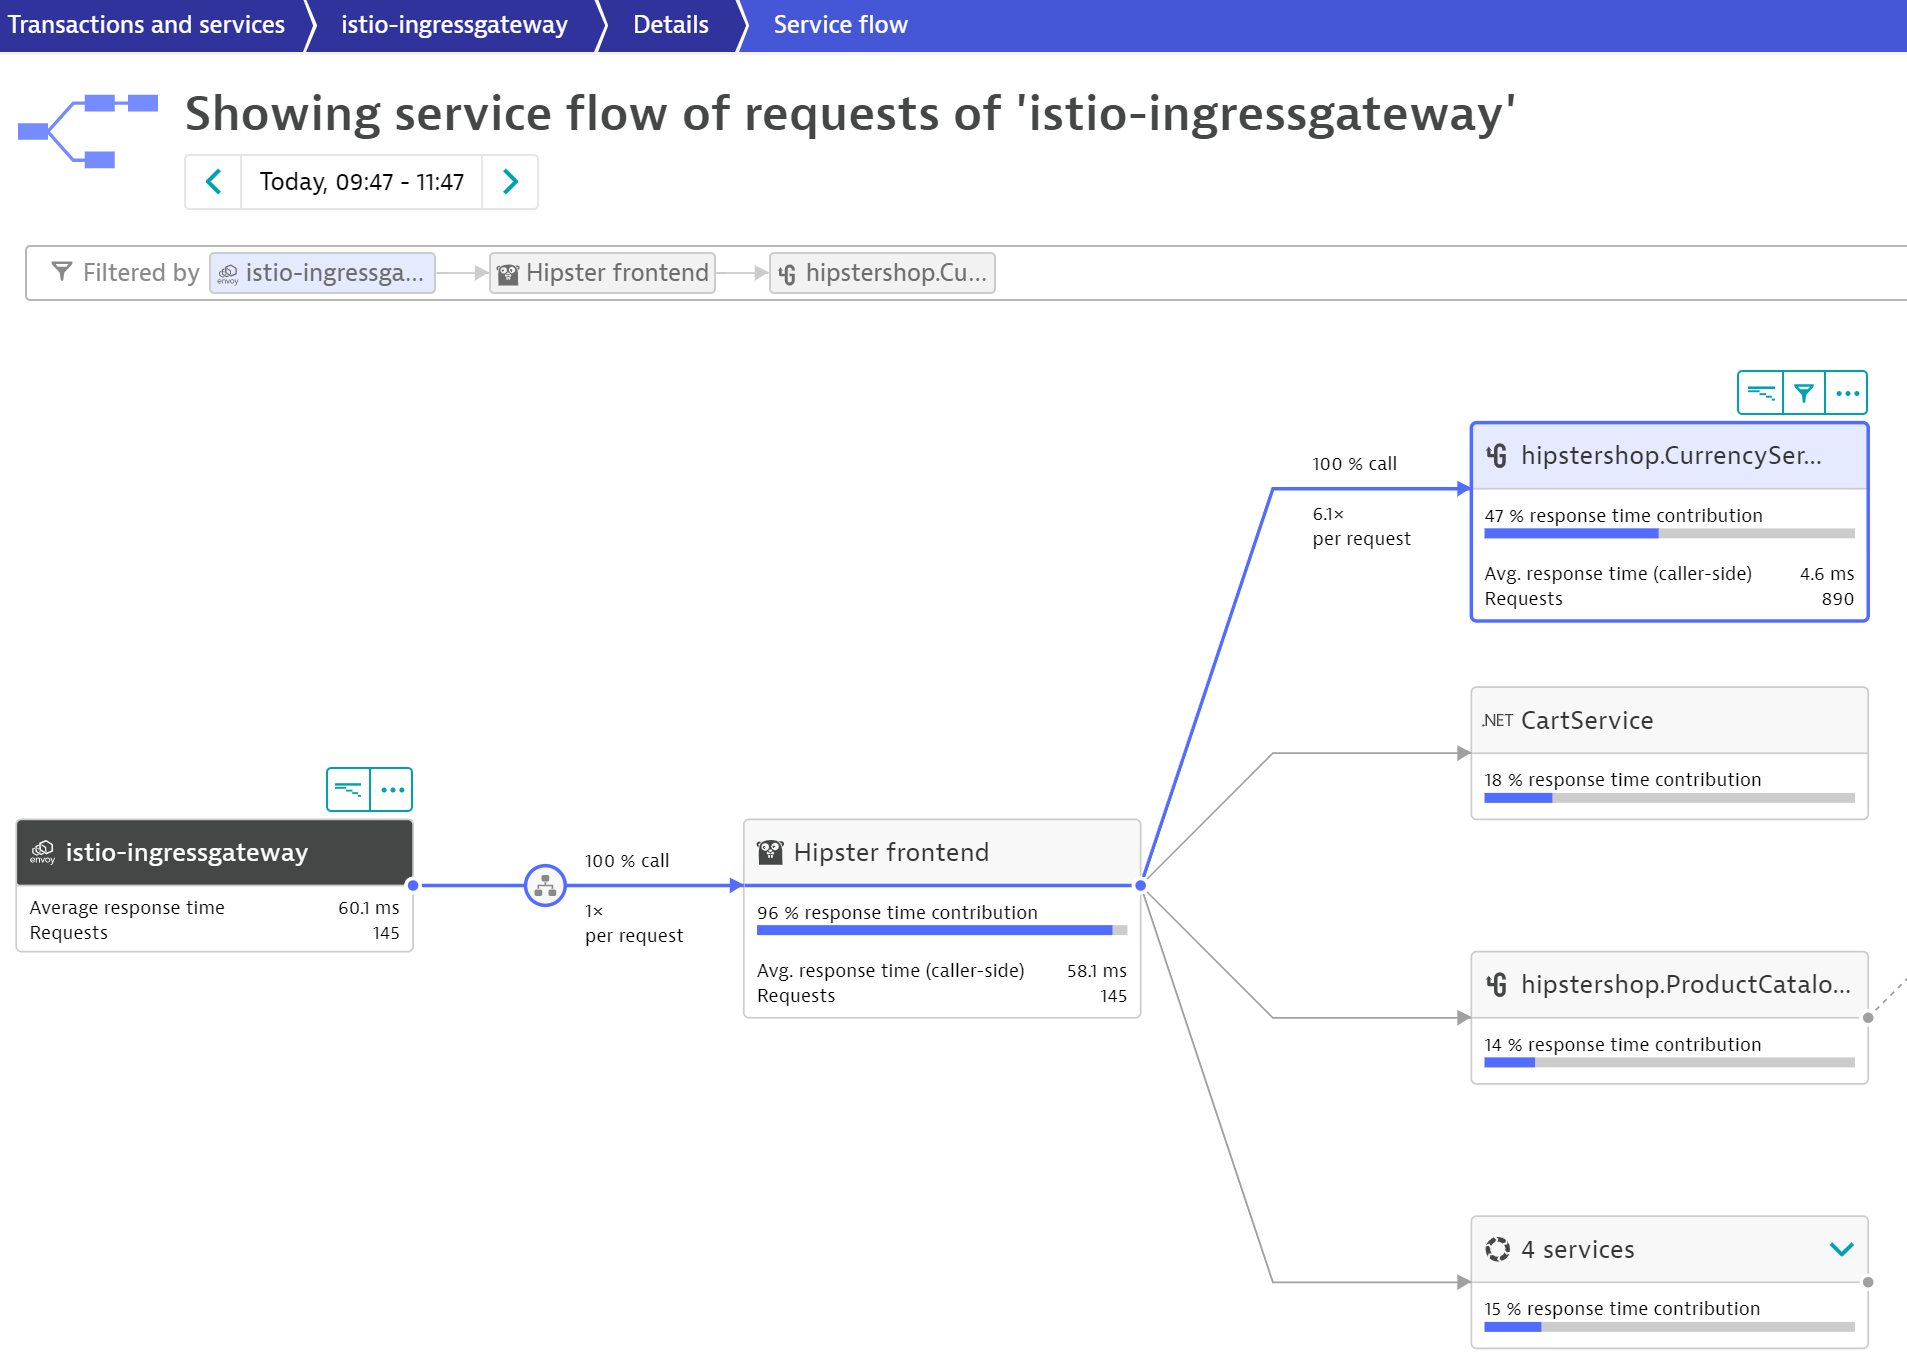
When opening the Service flow from the Istio-ingress controller you can immediately see and understand how your HTTP service calls are distributed through the environment. This allows you to easily identify load and error distribution in addition to bottlenecks.

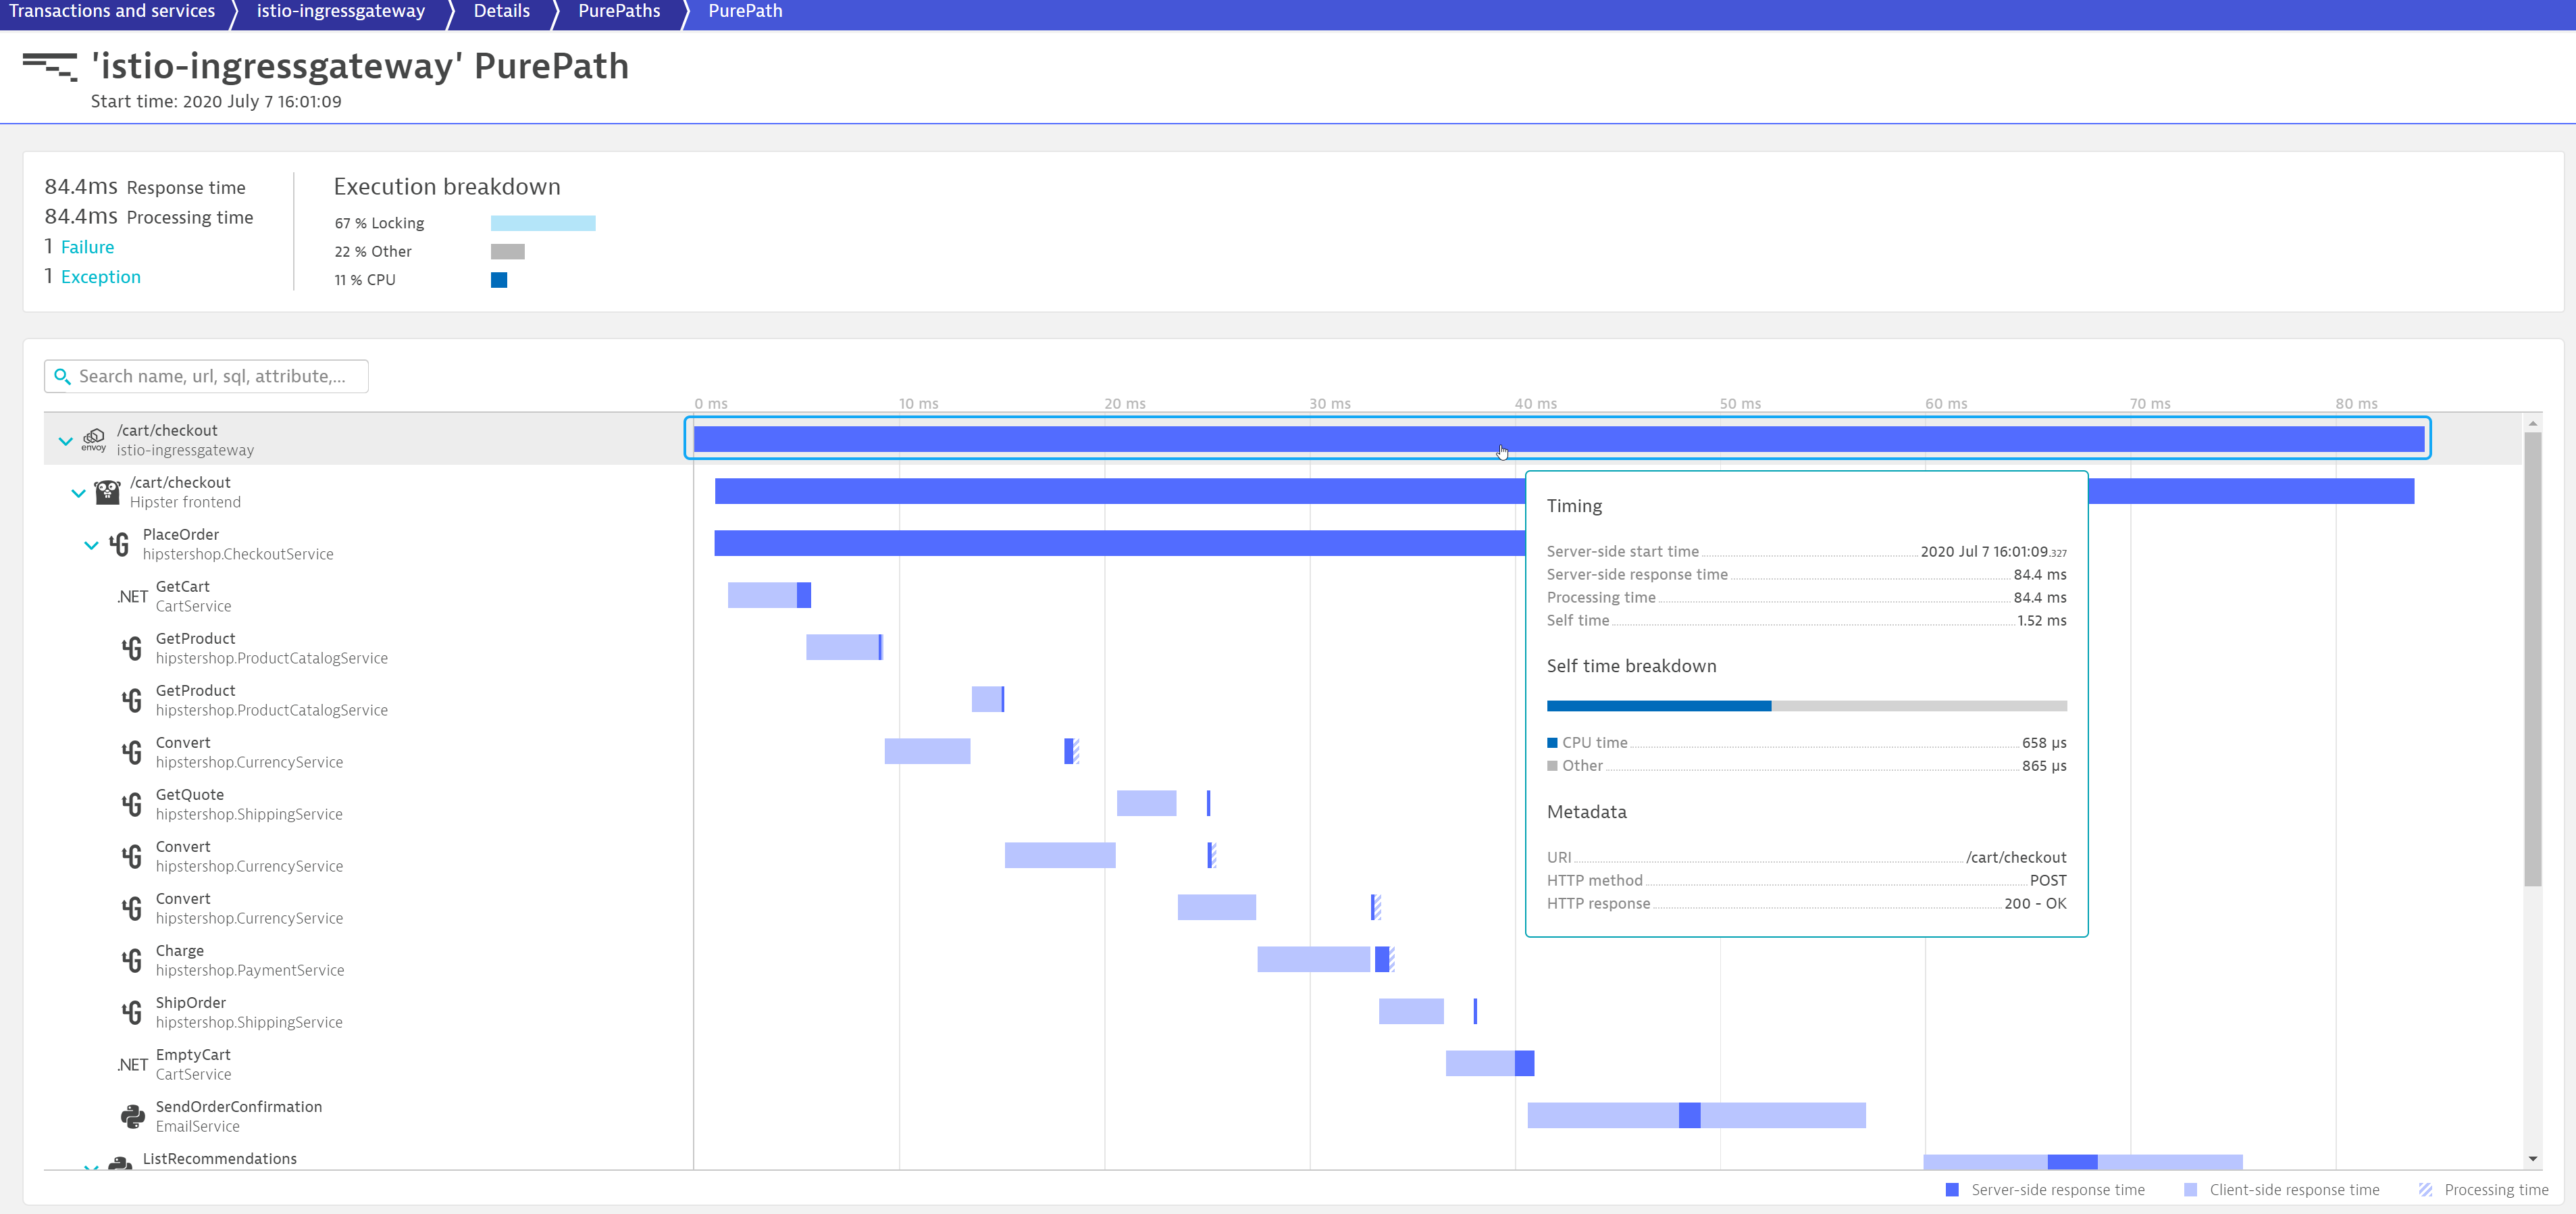
The ingress controller is also visible on the PurePath® distributed trace level. This allows you to see all the details of each trace, including the URI, HTTP method and response codes, and timing details. Here you can also investigate all the details about the downstream calls that occur in the context of this single transaction.

All of this works out-of-the-box. Just deploy OneAgent in Full Stack mode, ideally via the OneAgent Operator or Helm script. These approaches provide the additional benefit that deployment variants will maintain correct Istio configuration for enabling OneAgent data to reach your Dynatrace environments.
Get started
- Make sure that OneAgent version 1.205+ is deployed on all hosts where your Envoys run.
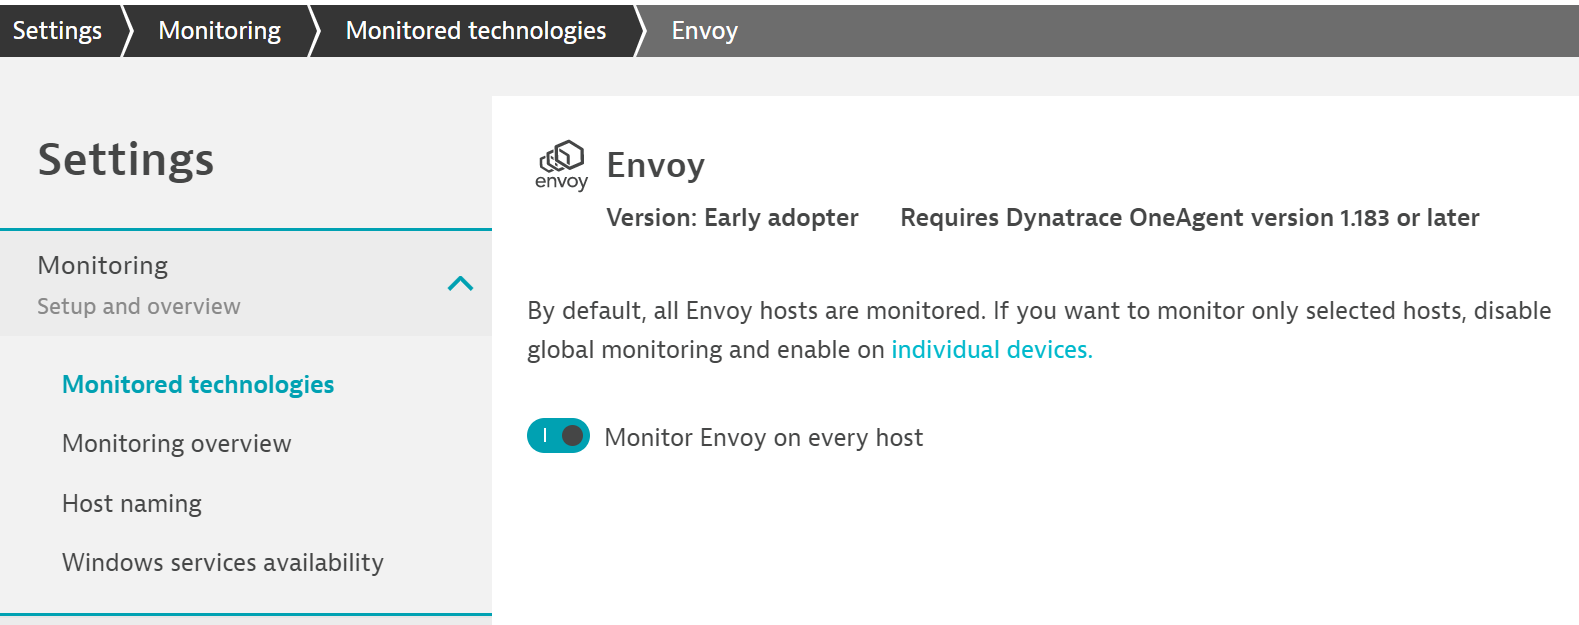
- Activate Envoy monitoring at Settings > Monitored technologies > Envoy.

- Restart your Envoy services.
- Make sure that HTTP requests are traversing your Envoys and applications.
- Find your Envoys on the Transactions and services page (in large environments, try filtering the list of technologies by
Envoy).
For Dynatrace environments created earlier than Dynatrace version 1.205, activation is required. Go to Settings > Server-side service monitoring > Deep monitoring > New OneAgent Features > Envoy Istio Sidecar monitoring.
Are you new to Dynatrace?
If so, start your free trial today!


Looking for answers?
Start a new discussion or ask for help in our Q&A forum.
Go to forum