Unravel the power of the Davis® AI for your OpenTelemetry metrics to ensure enterprise-grade observability at scale.
Welcome back to the second part of our blog series on how easy it is to get enterprise-grade observability at scale in Dynatrace for your OpenTelemetry custom metrics.
In Part 1, we announced our new OpenTelemetry custom-metric exporters that provide the broadest language coverage on the market, including Go, .NET, Java, JavaScript/Node.js, and Python. Our metric exporters allow for ingestion of OpenTelemetry-instrumented custom metrics into the Dynatrace open analytics and AI platform, giving you precise and actionable analytics across the entire software life cycle. You’ll find this helpful in use cases such as:
- Collecting the number of sales per country per continent, to continuously provide business insights to management
- Getting specific metrics from libraries that are pre-instrumented with OpenTelemetry (for example, database drivers)
- Gathering performance metrics like memory usage from systems where an agent can’t be installed
After the seamless integration of your OpenTelemetry-instrumented custom metrics, Dynatrace takes care of storing and analyzing telemetry data at web scale, and providing an enterprise-grade single pane of glass. To show you the power of Dynatrace, today we’re diving deeper into the first two use cases mentioned above.
Ensure continuous business insights by adding semantics to collected business metrics
In our first use case example, we’ll show you how you can add semantics to collected business metrics via OpenTelemetry source-code instrumentation and use Dynatrace for detailed analysis.
For demonstrating the annotation of OpenTelemetry custom metrics with useful semantics, we’ve set up a shopping cart microservice example using serverless technologies on AWS. The checkout cart service, a Node.js Lambda function, has been annotated with OpenTelemetry custom metrics to ensure collection of sales statistics that can be split by region and also per country for further analysis:
const { MeterProvider } = require('@opentelemetry/metrics');
const {
  DynatraceMetricExporter,
} = require('@dynatrace/opentelemetry-exporter-metrics');

const exporter = new DynatraceMetricExporter({
  prefix: '***',
  url: '***',
  APIToken: '***',
});

const sales = meter.createValueRecorder('lambda.checkout.sales', {
  description: 'Sales Metrics',
});
async function recordSale(country, value) {
  console.log('recrd sale');
  const labels = {
    country,
    continent,
  };
  return sales.bind(labels).record(value);
}
For this example, we’ve used the OpenTelemetry metrics exporter for JavaScript/Node.js, which plugs in to the OpenTelemetry metrics SDK for JavaScript, to start ingesting sales metrics into Dynatrace.
After the OpenTelemetry metrics exporter is effortless set up, it seamlessly taps into the instrumented custom sales metrics and ships them to the specified Dynatrace environment.
In this specific use case, we’re interested in getting insights into sales statistics because we want to follow up on unexpected metric drops. If the sales suddenly drop for a specific region, we need to ensure proper remediation actions for the related Lambda function.
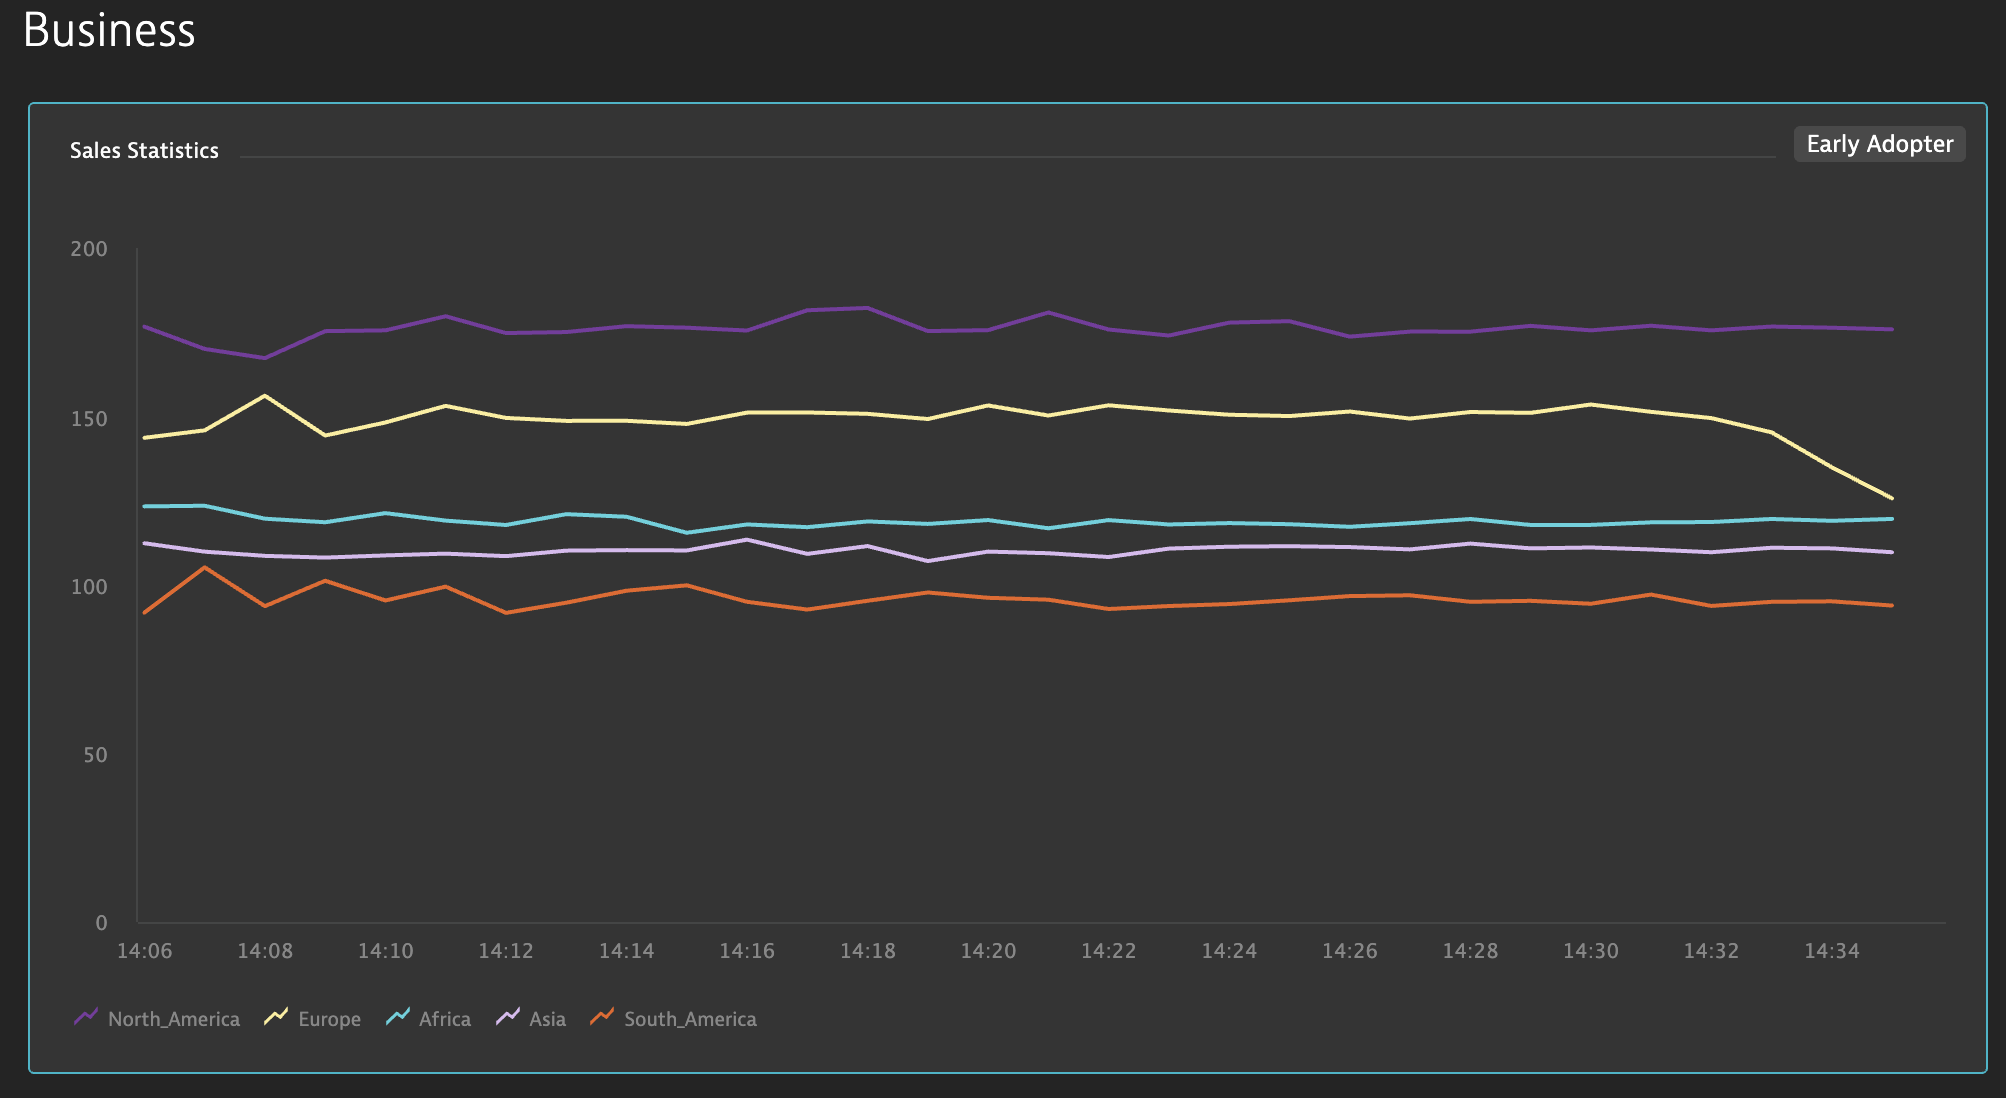
Therefore, we’ve set up a custom event to ensure that we’re alerted to any detected anomalies for the sales metric. And as you can see in the chart above, there has been a drop in the sales for Europe, which triggered an alert in Dynatrace.
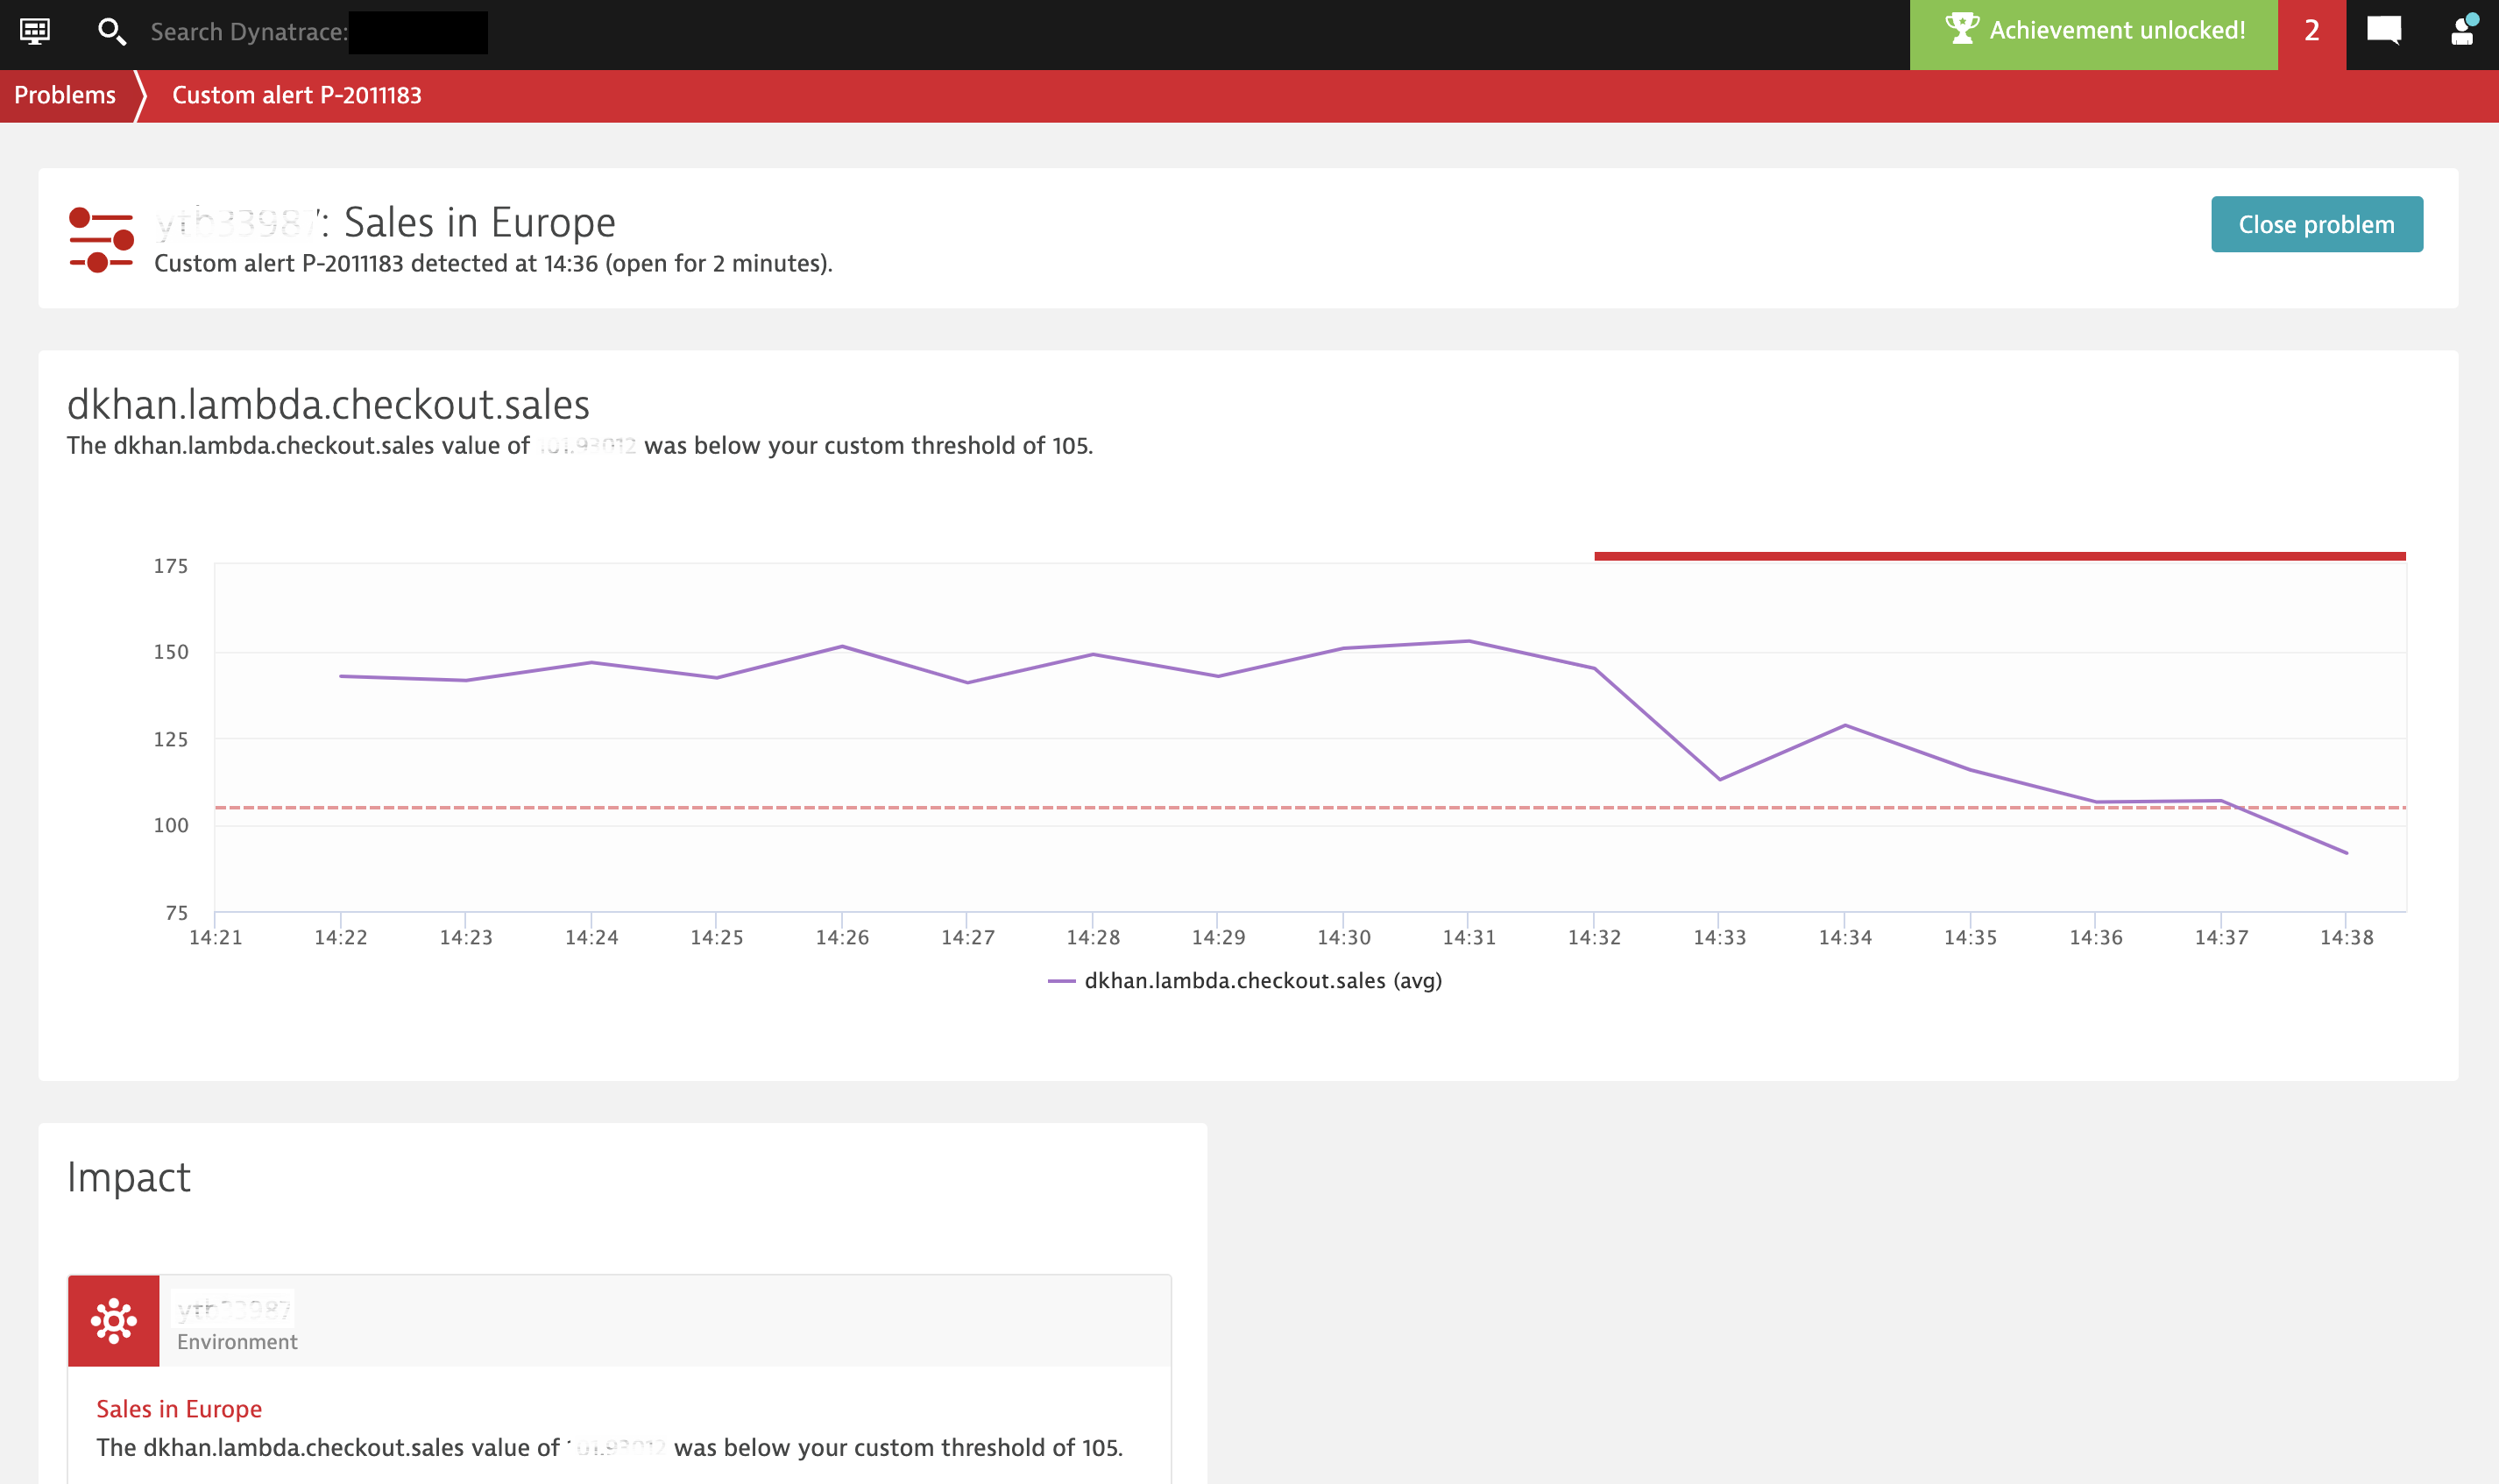
As the owner of the respective Lambda function, now you can decide on proper remediation actions to address this issue.
Collect usage statistics by pre-instrumenting an open-source framework
“We want every platform and library to be pre-instrumented with OpenTelemetry and we’re committed to making this as easy as possible.” Sergey Kanzhelev (Google)
In our second example, we focus on pre-instrumenting an open-source framework with OpenTelemetry, which is a key goal of the OpenTelemetry standard. As Dynatrace supports the OpenTelemetry community, we want to lead by example when it comes to pre-instrumentation of open-source frameworks. So we’ve decided to pre-instrument keptn to collect metrics provided by its statistics service.
Keptn is an open source CNCF project providing an event-based control plane for continuous delivery and automated operations for cloud-native applications. Our pre-instrumentation aims at getting keptn usage statistics and allows for exporting these metrics to several observability platforms.
We’ve leveraged the OpenTelemetry metrics exporter for Go as well as the OpenTelemetry Go helper for pre-instrumenting keptn’s statistics service. The resulting usage statistics are ingested into the Dynatrace platform for further analysis.
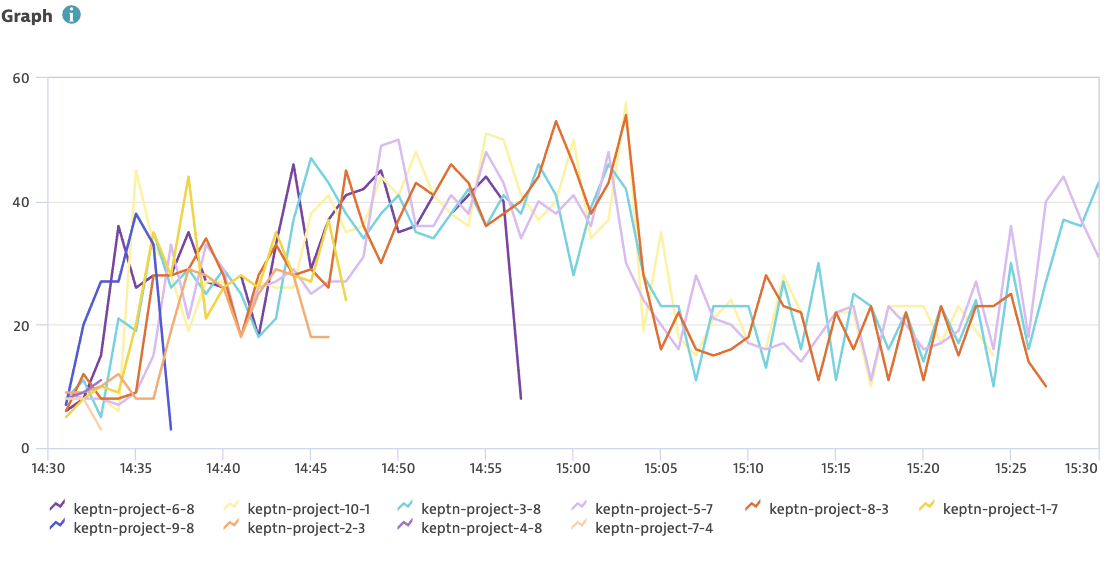
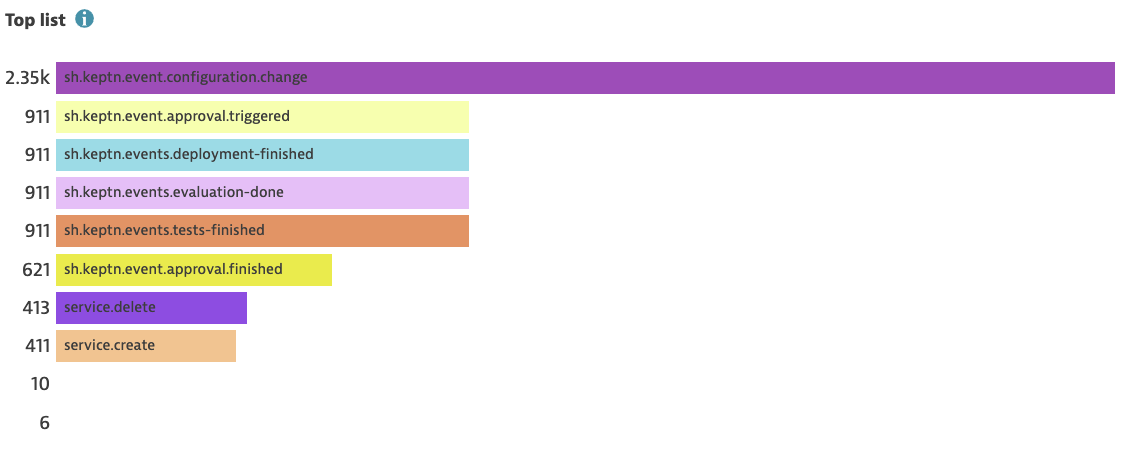
If you’d like to learn more about shipping OpenTelemetry with an open-source project, we recommend watching the on-demand session “Batteries included: Shipping OpenTelemetry with your Open Source Project”, which has been prerecorded for KubeCon + CloudNativeCon North America 2020.
If you’re interested in using keptn, contributing to keptn, or joining the community, please visit keptn.sh or follow keptn on Twitter via @keptnproject.
Observability at scale with Dynatrace and OpenTelemetry
If you already have Dynatrace OneAgent in place you can, of course, take advantage of the built-in OneAgent multidimensional metric API for ingesting your OpenTelemetry custom metrics. With this approach, you don’t have to concern yourself with scale, encryption, firewalls, or even where your metrics should be sent for analysis—OneAgent takes care of all this for you.
Get ready to be amazed!
New to Dynatrace? Get enterprise-grade observability into your OpenTelemetry custom metrics by starting your free trial today.
Join the community and contribute today
The OpenTelemetry metrics exporters are open source projects, available on GitHub. The exporters represent a starting point for ingesting OpenTelemetry-instrumented custom metrics into the Dynatrace platform and will be maintained by our open source integrations team. All user contributions are welcome! The best way for you to do this is via the GitHub repository issue tracker.
Please note that the OpenTelemetry community is still working towards a release candidate for the metric API which means the API is not yet production ready. Consequently, the OpenTelemetry metrics exporters are currently not meant to be used in production environments.
If you’re interested in learning more about OpenTelemetry or joining the community, a good place to start is the OpenTelemetry GitHub repository. To get involved with the community, you can either join the relevant weekly SIG meetings or reach out to them on Gitter.
Stay tuned
Watch out for upcoming announcements around the capture of OpenTelemetry and OpenTracing trace data and providing extended end-to-end traceability for pre-instrumented third-party libraries that emit OpenTelemetry and OpenTracing telemetry data. In the meantime, learn how Dynatrace is fully embracing OpenTelemetry with PurePath 4 seamless integration of OpenTelemetry data.



Looking for answers?
Start a new discussion or ask for help in our Q&A forum.
Go to forum