Carbon Impact, a purpose-built app created using Dynatrace AppEngine, provides organizations with the data and tools to measure, understand, and act on hardware and software instances that generate carbon emissions. The app supports data center, host, and code-level optimization initiatives and is extended with Notebooks for powerful ad-hoc analytics.
Carbon Impact leverages business events, a special data type designed to support the real-time accuracy and long-term granularity demands common to business use cases. For Carbon Impact, these business events come from an automation workflow that translates host utilization metrics into energy consumption in watt hours (Wh) and into greenhouse gas emissions in carbon dioxide equivalent (CO2e). These metrics are automatically enriched with Smartscape® topology context, connecting them to their source systems to enable flexible and granular analysis.
The methodology and algorithms were designed by Dynatrace with guidance from the Sustainable Digital Infrastructure Alliance (SDIA), expanding on formulas from the open source project Cloud Carbon Footprint. Carbon Impact measures and reports IT energy consumption and the carbon footprint of all OneAgent-instrumented hosts across an organization’s entire hybrid and multicloud environment in a single interface.
The Carbon Impact app
Carbon Impact provides a unified interface to explore and analyze energy consumption and carbon emissions. Carbon Impact uses host utilization metrics from OneAgents to report the estimated energy consumption for CPU, storage I/O, memory, and network. Energy consumption is then translated to CO2e based on host geolocation. This is important because each region uses a different mix of energy sources to generate electricity, and each source has a different environmental impact. In other words, the CO2e from 1 kWh of energy produced from solar or wind is less than that produced from coal or gas.
Carbon Impact reports two main KPIs:
- Energy consumed by the IT stack (Wh)
- Emissions generated by that energy (CO2e grams)
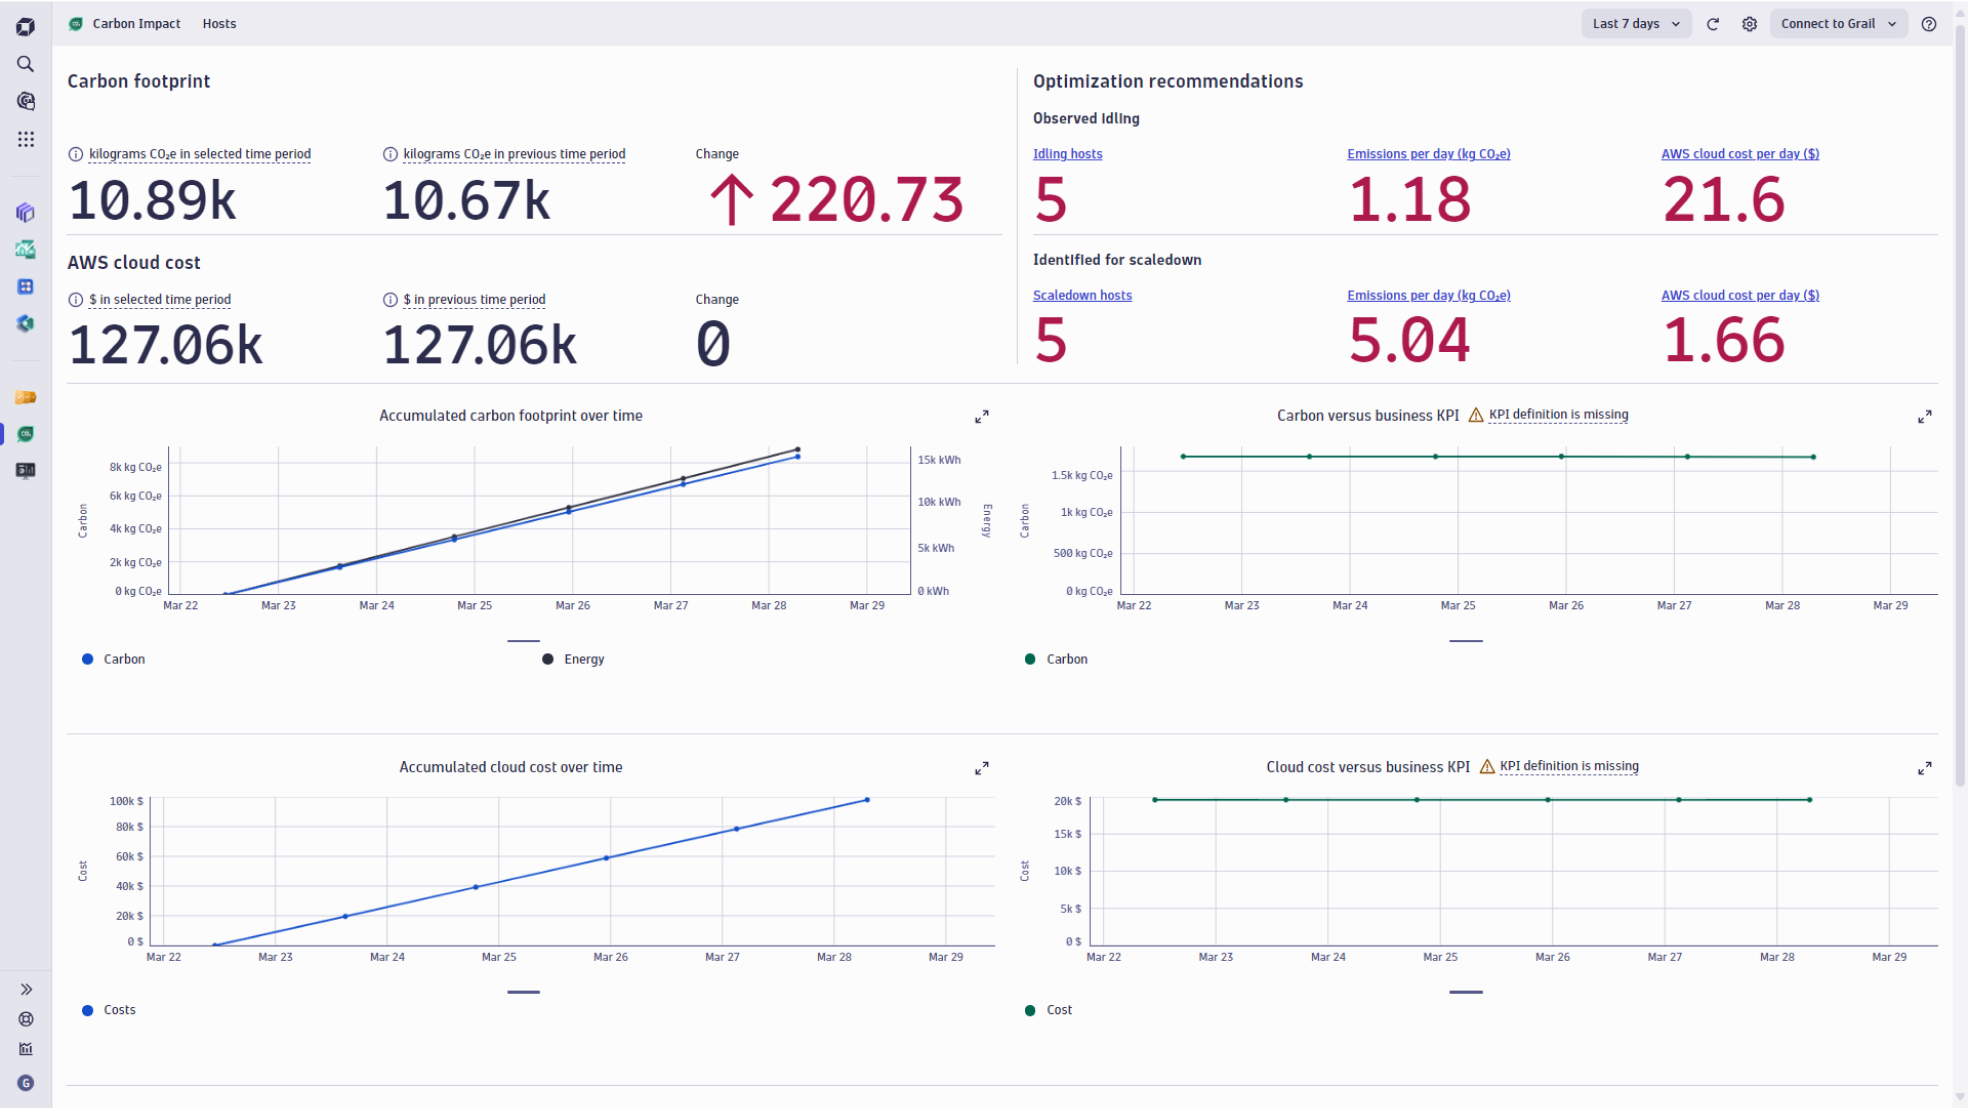
Carbon Impact provides two different types of optimization recommendations based on discovered idling and underutilized hosts, as these are often good candidates for downsizing or shutting down. To evaluate the impact of implementing these recommendations, Carbon Impact connects directly to the Hosts view to explore host details, including running services.
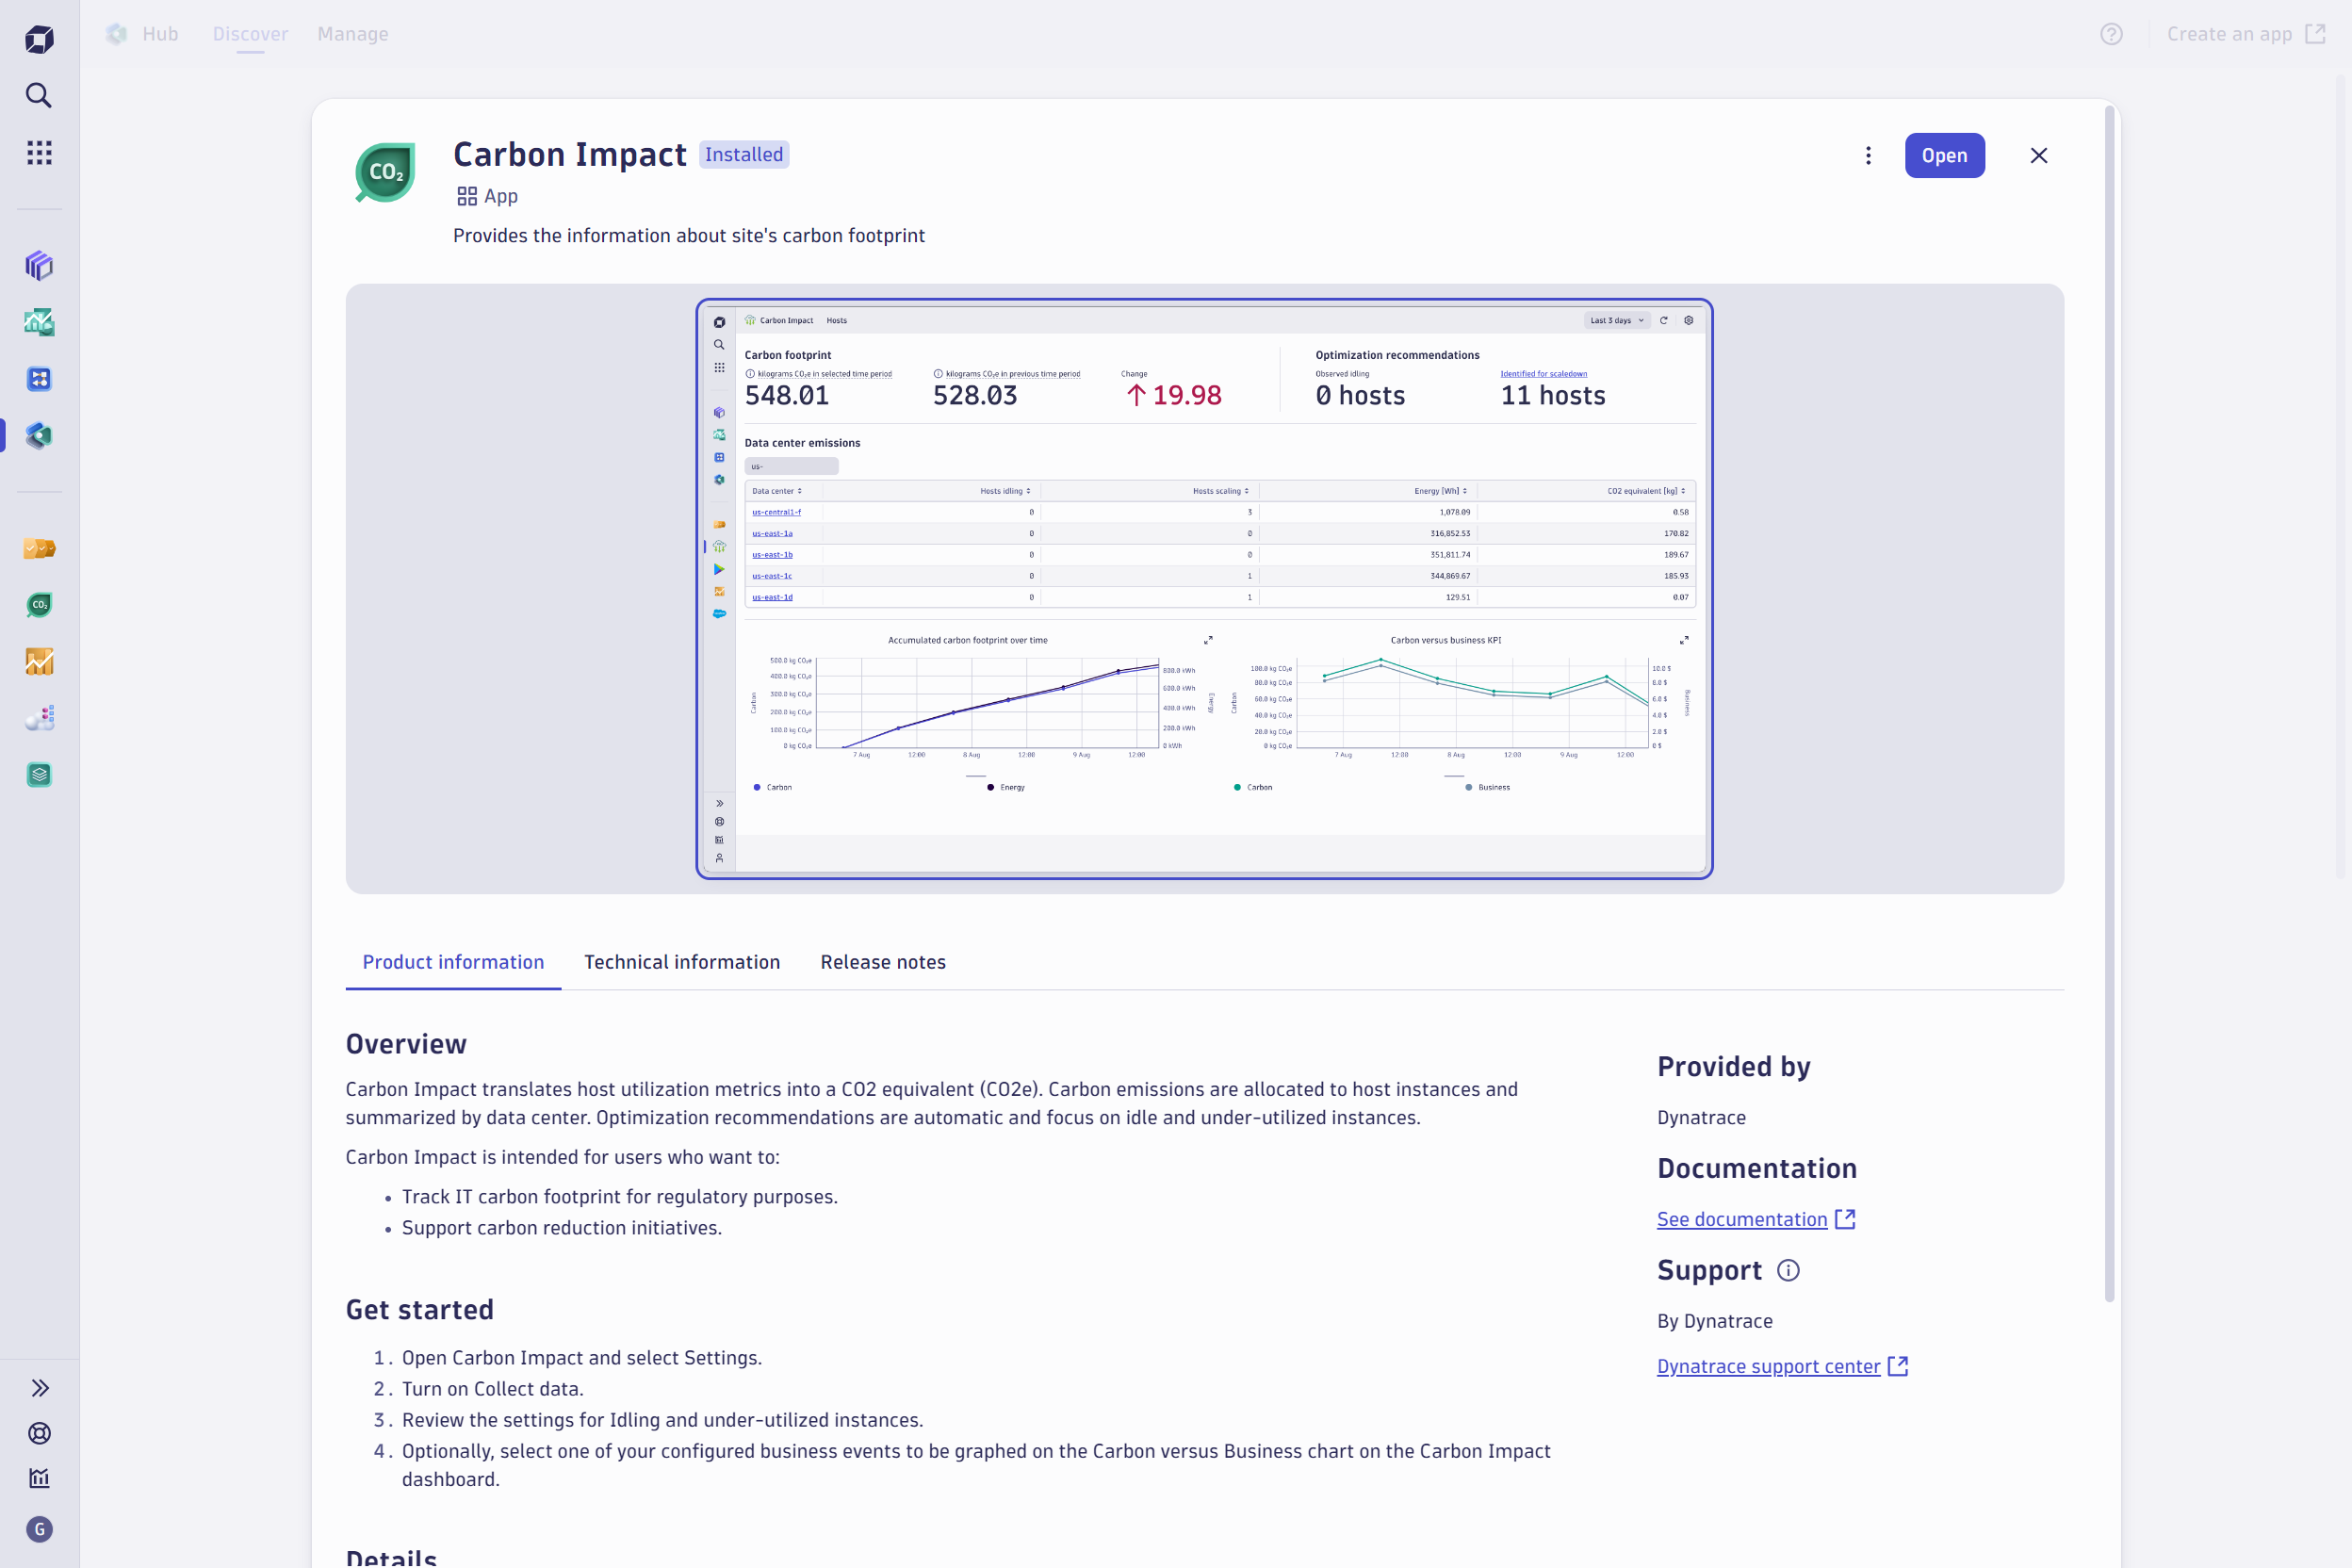
To get started with Carbon Impact, add the app from Dynatrace Hub and follow the setup guide.
Use DQL to perform ad-hoc analysis of energy consumption and carbon emissions
Carbon Impact simplifies evaluating your carbon footprint at data center and host levels. The app automatically builds baselines, important reference points for analyzing the environmental impact of individual hardware or software instances. Optimization initiatives can then be measured against these baselines to report progress toward defined or aspirational reduction goals.
Some use cases benefit from dashboards or ad-hoc analytics, complementing the insights from Carbon Impact. In the following example, we use DQL to answer questions not directly covered by Carbon Impact. We provide a Notebook for you to follow along in your Dynatrace tenant; you can run or download the Notebook from the Dynatrace Playground and upload it to your tenant. This Notebook uses data already generated by Carbon Impact, leveraging the simple and clear common schema to facilitate ad-hoc analysis.
Understanding the schema and how to leverage topology and entity metadata is the starting point for deriving greater insights into the energy consumption and carbon emissions generated by your IT stack. The schema of the data generated is defined in the Dynatrace Semantic Dictionary.
The Dynatrace Query Language (DQL) statement we use to explore the raw data that Carbon Impact generates is quite simple: We filter by the event type carbon.measurement defined by Carbon Impact.

Know your data before starting ad-hoc analysis
The schema of a carbon data point generated by Carbon Impact contains data specific to the host components contributing to energy consumption: CPU, memory, storage IO, and network. In the same data point, based on the host cloud.region, energy consumption is transformed into grams of CO2e using localized energy carbon intensity. Carbon intensity is a measure of how much CO2 emissions are produced per kilowatt hour of electricity consumed, used to transform watt hours into grams of CO2e. The mix of energy sources determines the localized carbon intensity.
With this understanding, let’s generate a list of the main carbon contributors to focus our optimization initiatives where the impact would be most significant.
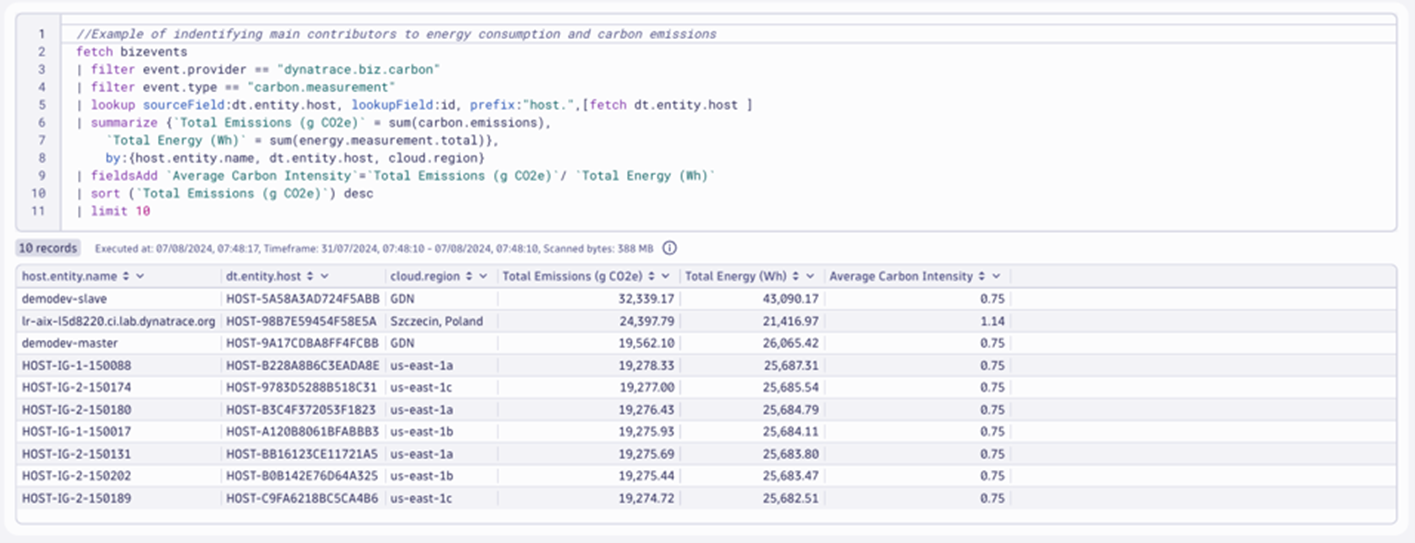
Start with the main contributors as candidates for optimization while greening your IT
The DQL for this analysis is relatively simple. We use dt.entity.host to group two summarizations: one for total energy consumption (Wh) and one for total emissions (CO2e). We can calculate an average carbon intensity for every host and cloud region with those two summarized values. With this information, we can evaluate the impact of moving a workload to a different location on carbon emissions.
This is an example of what we call level 1 optimization, described in this blog post. Decisions at this level focus on minimizing emissions, as measured by carbon intensity or power usage effectiveness (PUE).
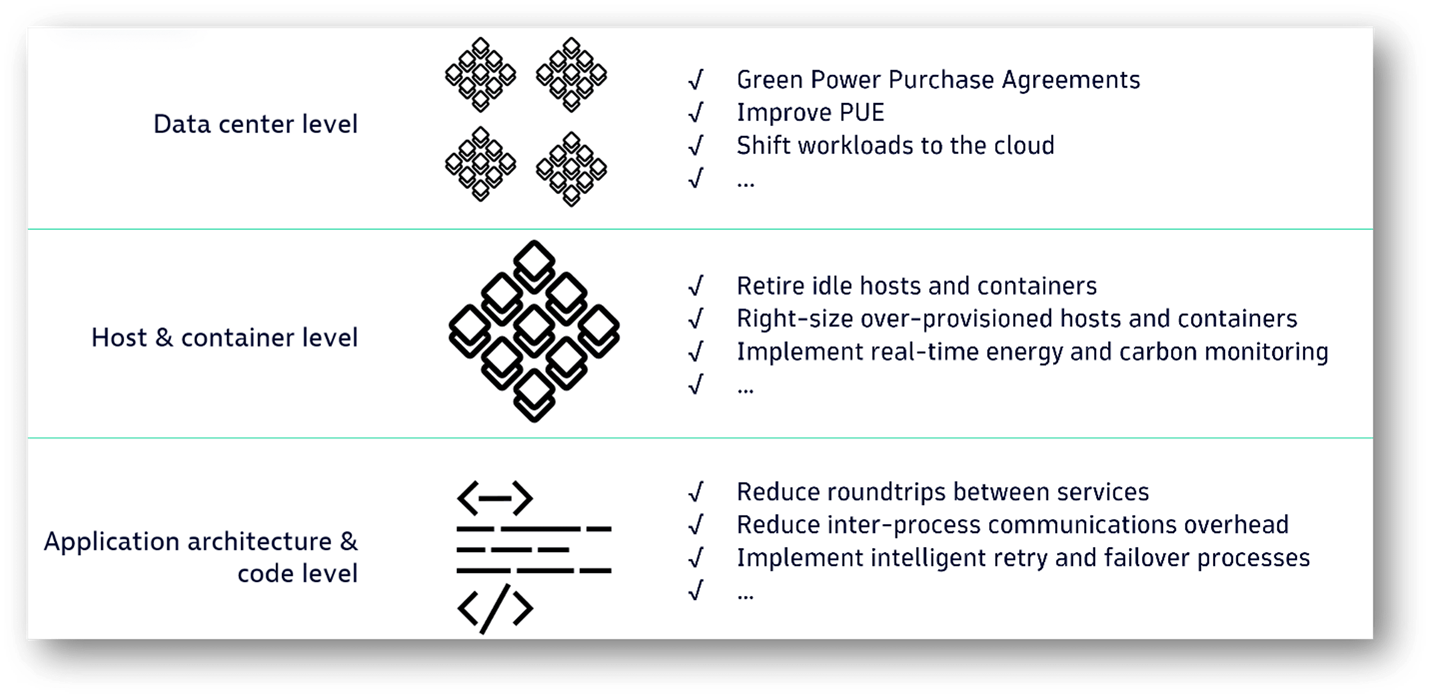
To provide contextual topology information, we connect the attribute dt.entity.host with host properties to extract the custom name of the host using a lookup command against the host entity model. In an upcoming release, we will use that attribute to navigate through Smartscape topology to answer questions about the host location and its processes.
To continue our level 1 optimization analytics, we can examine the distribution of our carbon footprint among the providers of our hybrid cloud. Based on these insights, we can make data-driven decisions to move our workloads from on-premises to the cloud or to distribute them among different cloud vendors.
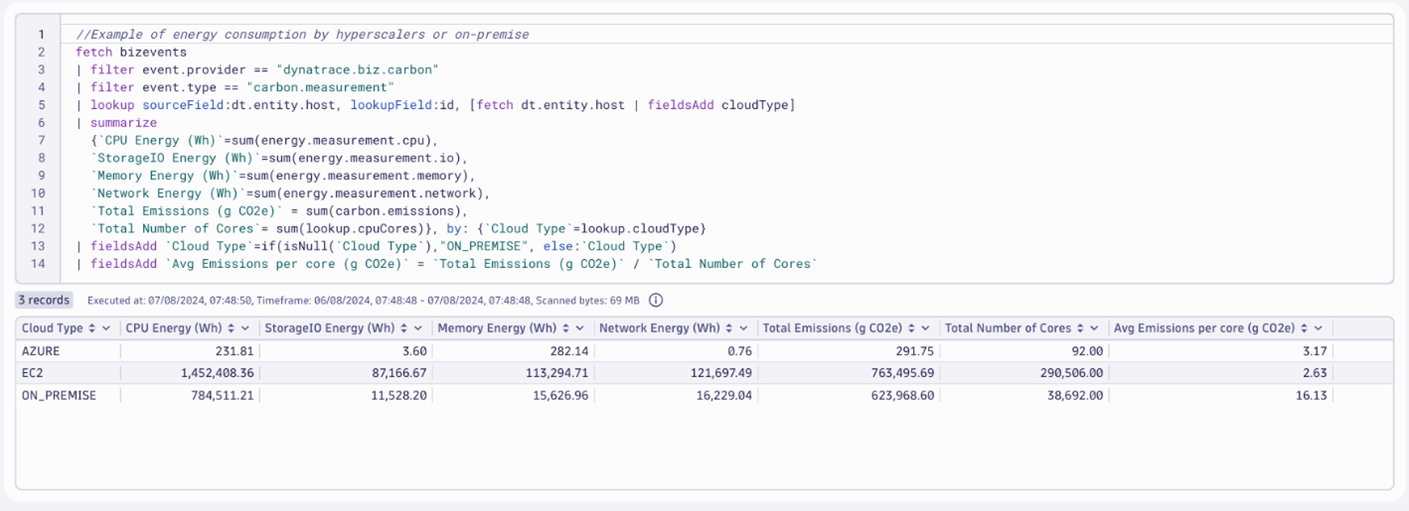
Distribution of emissions and hardware usage distributed by cloud type
Again, without complex DQL, we can extract emissions data from Carbon Impact, enriching the results with the cloudType host property and the total number of cores that the host contains. DQL enriches the data line by line, allowing us to distribute energy consumption, emissions, and average CPU core emissions across cloud providers and private data centers.
We can use the same approach to distribute energy and emissions at the VMware hypervisor level. Since that information is included in the topology metadata, enriching the dataset with the hypervisor running the virtualized hosts is simple.

Detailed energy consumption and carbon emissions by VMware hypervisors
Green coding: Add emissions to classic APM
The above examples focus on analyzing hosts and data centers to evaluate the benefits of shifting workloads or re-sizing hosts.
Organizations should begin their carbon optimization efforts by evaluating these options first, as they often result in significant quick wins. For ongoing optimization, carbon reduction practices can be embedded in coding principles.
The optimization approach varies and is democratized across development teams in green coding initiatives. Coding best practices that optimize process communications, remove redundant loops, or reduce data transmission volumes result in reduced energy consumption and carbon emissions. These optimizations might sound similar if you’re acquainted with Application Performance Management (APM) best practices. In fact, most of the proposed optimizations for computational efficiency and improved performance will also reduce energy consumption. In other words, APM best practices are close to Green Coding best practices.
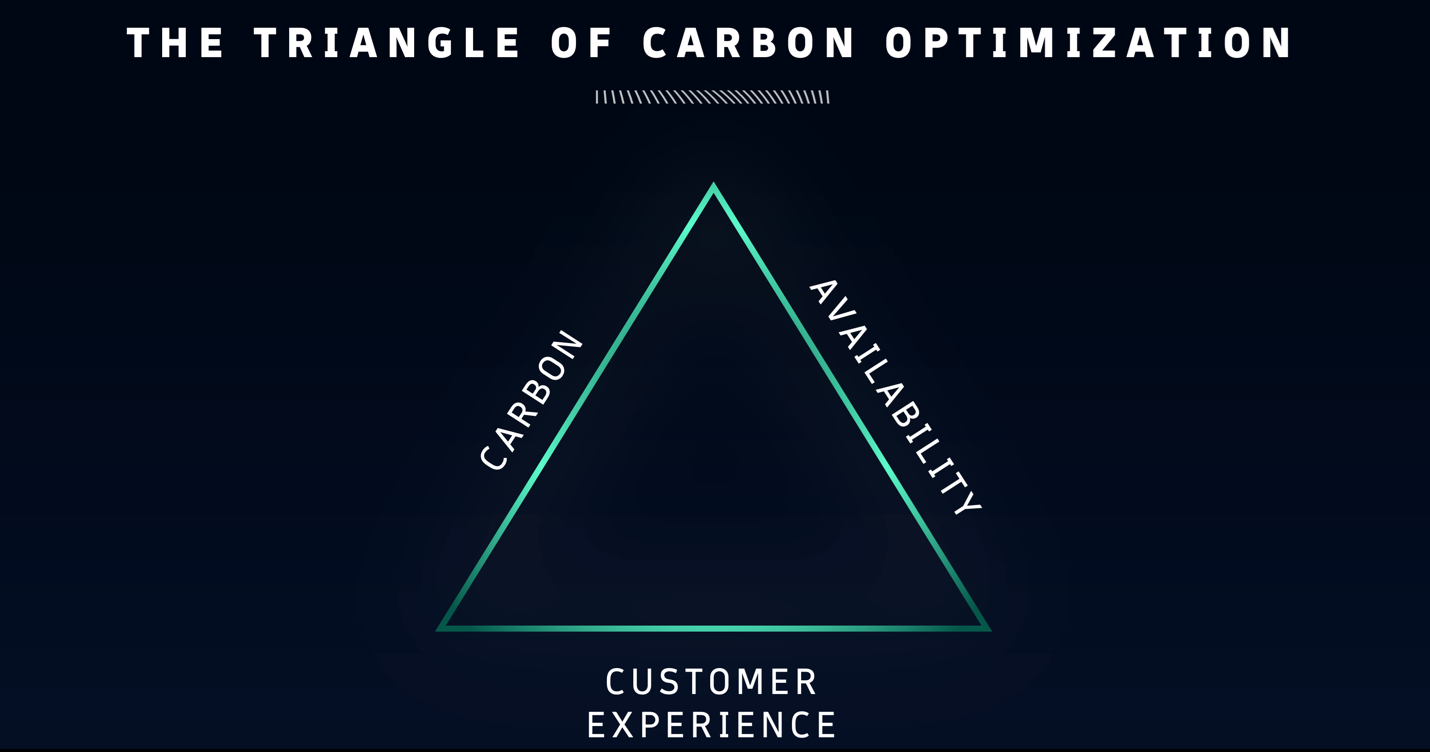
And the good news is that by reducing your energy consumption, you’re also reducing your carbon emissions.
Green coding focuses on the software that is running on our digital infrastructure. Any approach to make our software greener benefits from the foundational step of measuring energy and carbon emissions baselines.
Moving up through a technology stack, on top of hosts, processes are run. The challenge then becomes measuring the energy consumed by a process by a specific piece of software. If you think this was difficult at the hardware level, it’s significantly more difficult for software. Let’s take some of the mystery out of it.
We can follow the same approach to evaluating the carbon emissions of hosts and hypervisors. Again, utilization metrics are the key to distributing emissions by individual software processes.
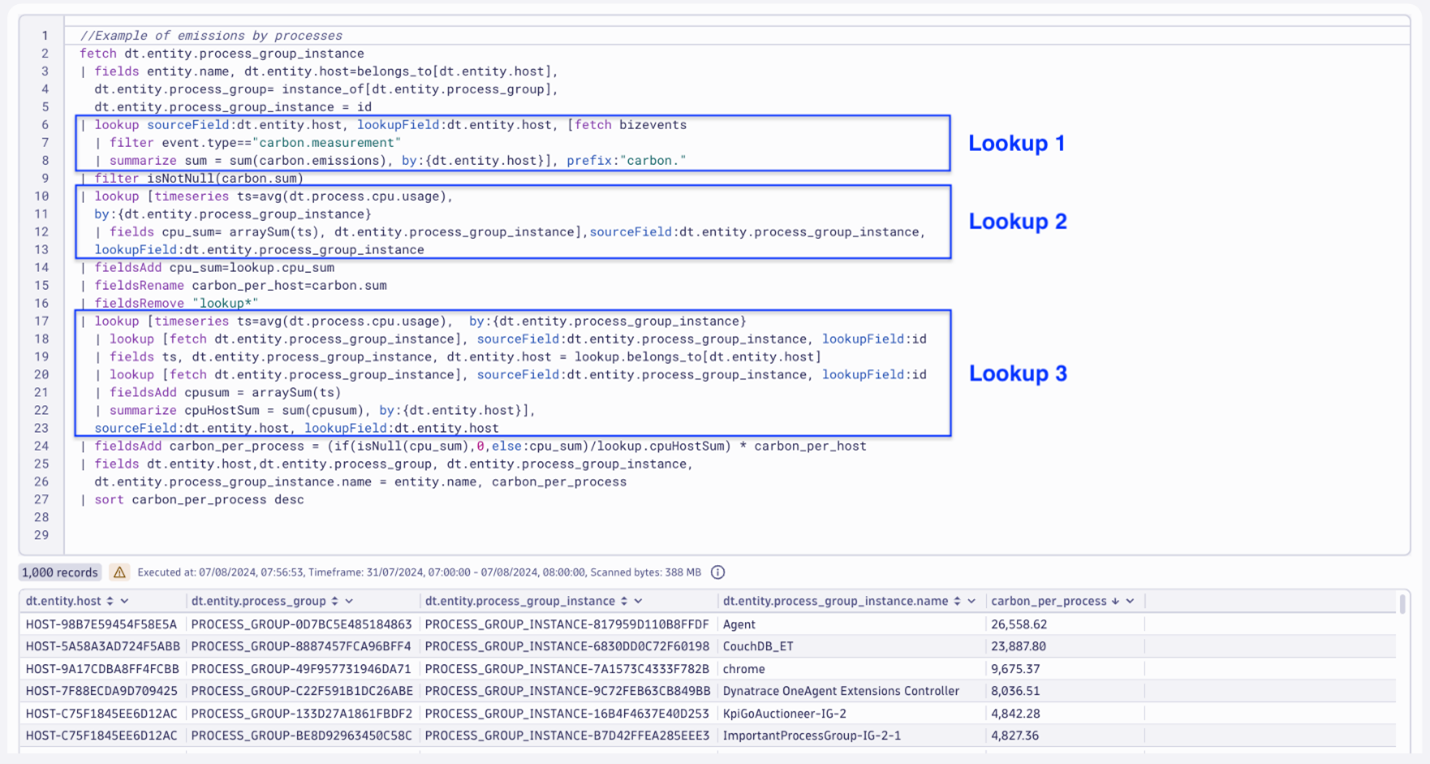
Navigating through Smartscape and allocating emissions by software components that run on the instrumented host
Here, the DQL query is a bit more complex as it navigates through the list of processes running on each host, enriching the data with emissions data from those hosts, including the CPU utilization of each process.
Instead of directly querying the emissions data, we now generate a list of all the running processes. From there, we enrich the data with the associated hosts and process group.
To get process-level emissions and CPU utilization, use the following sequence of lookup queries:
- The first lookup collects the total emissions generated for each host in the calculation time frame.
- The second lookup collects CPU utilization, querying the process.cpu.usage metric for each process instance.
- The third lookup collects a summarization at the host level of the process.cpu.usage metric, so it is possible to have the total amount of CPU used to build a ratio for each process of CPU usage.
With these three new attributes collected for each process, it’s easy to build a ratio that simply distributes emissions per host to individual processes, comparing the CPU usage of one process with the overall CPU usage for all processes on a single host.
Once we allocate emissions for each process, it’s easy to prioritize the best candidates for green coding attention, focusing on reducing energy consumption and the resulting emissions.
Conclusion
Sustainability goals and the efforts required to meet those goals are varied and broad. For most organizations, the digital infrastructure that supports the business is fast becoming a key focus area. Embedding optimization best practices and the tools to support them will help meet these goals. Dynatrace Carbon Impact combines granular emissions metrics with comprehensive application and infrastructure observability to jumpstart your hybrid cloud carbon reduction initiatives.



Looking for answers?
Start a new discussion or ask for help in our Q&A forum.
Go to forum