AIOps helps enterprises find potential slowdowns before they happen. Learn how Lockheed Martin uses the combination of Dynatrace, ServiceNow, and Ansible to speed innovation for DevSecOps.
Businesses today are fighting fires across the DevSecOps spectrum — from staving off ever-evolving security threats to remediating slowdowns and outages. As a result, many IT teams are turning to artificial intelligence for IT operations (AIOps), which integrates AI into operations to automate systems across the development lifecycle. AIOps enables self-healing IT before problems impact operations, which makes life easier for DevSecOps teams.
Dynatrace’s AIOps platform uses causation-based, deterministic AI to spot potential slowdowns and outages before they occur and to trigger automated actions that prevent failures. Organizations can also automate diagnosis and remediation with Dynatrace’s AIOps. This automatic analysis enables engineers to spend more time innovating and improving business operations.
The combination of Dynatrace, ServiceNow workflows, and the Ansible automation platform can proactively self-heal countless workflows and critical outages. At Dynatrace Perform 2022, David Walker, a Lockheed Martin Fellow, and William Swofford, a full-stack engineer at Lockheed Martin, discuss how to create a self-diagnosing and self-healing IT server environment using this AIOps combination for auto-baselining, auto-remediation, monitoring as code, and more.
Automating AIOps with automatic and intelligent observability
An IT organization is often unaware a critical server has gone down until a user reports it. Then, the server administrator must investigate the cause, create a service ticket, and remediate the problem, which can take anywhere from minutes to hours.
An AIOps stack featuring Dynatrace, ServiceNow, and Ansible automates and shortens that process for Lockheed Martin, Walker and Swofford explain. Each piece of the AIOps triumvirate plays a crucial role in the automation process to speed innovation.
Dynatrace’s automatic and intelligent observability and causation-based AI identify the root cause of the slowdown or outage in context. This platform-based approach to observability enables IT teams to automate remediation efforts. In the event of an outage or slowdown, Dynatrace generates a ticket in ServiceNow, which manages the workflow. Dynatrace also issues a playbook request to Ansible, which begins the DevSecOps toolchain automation with a self-healing script. The script then restarts the web service and checks the server’s health.
An example of the self-healing web
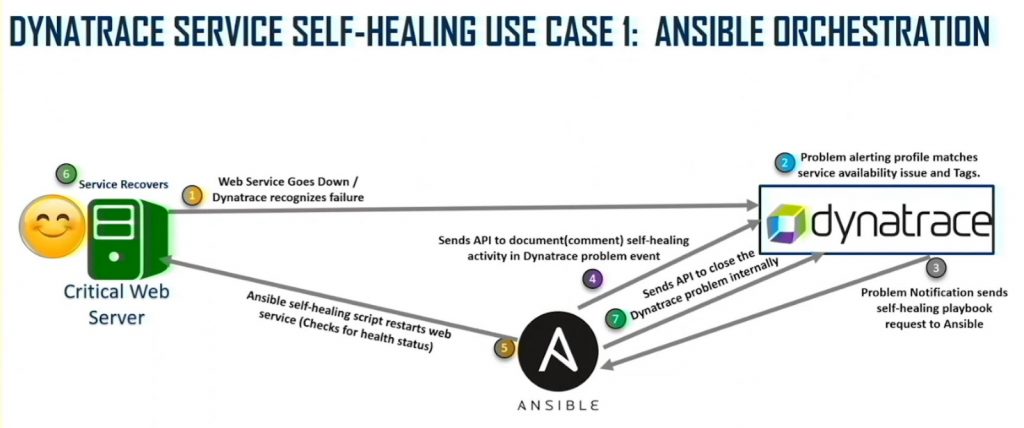
For example, a typical use case involves a web server running an analytics and reporting system. If the service goes down, Dynatrace recognizes the failure and, through its integration with ServiceNow, automatically creates an IT ticket to trigger the remediation (Figure 1).

“Instead of the trigger being a failure, our trigger is a point of time before failure,” Swofford says. “Now, we know beforehand what’s going to happen. We’re actually moving our failure point to just a slowdown point or a nuisance point instead of it actually being a down service.”
The auto-generated incident in ServiceNow sends a call to Ansible Tower to initiate a remediation script. Ansible sends an API to document self-healing IT activity in Dynatrace. Then, Ansible generates the self-healing script, recovers the service, and closes the problem in Dynatrace and ServiceNow. The benefit for DevSecOps teams is the incident report allows them to conduct a root-cause analysis using the information ServiceNow receives from Dynatrace.
“Any incident we generate has a root-cause analysis,” Swofford says. “You can actually go and solve the root-cause issue instead of just [continuing to] keep resolving and remediating.”
Dynatrace AIOps solves the case of the forgotten archive
In a hypothetical scenario Walker and Swofford presented, an enterprise service director needs to access a budget report each month. But performance is typically so slow that the report doesn’t load. After several months, the service director asks the system administrators to investigate.
It turns out a colleague has been adding new records to the database without archiving old ones. That causes the size of the database to grow and performance to suffer. The employee has been asked to archive old records in the past, but frequently forgets.
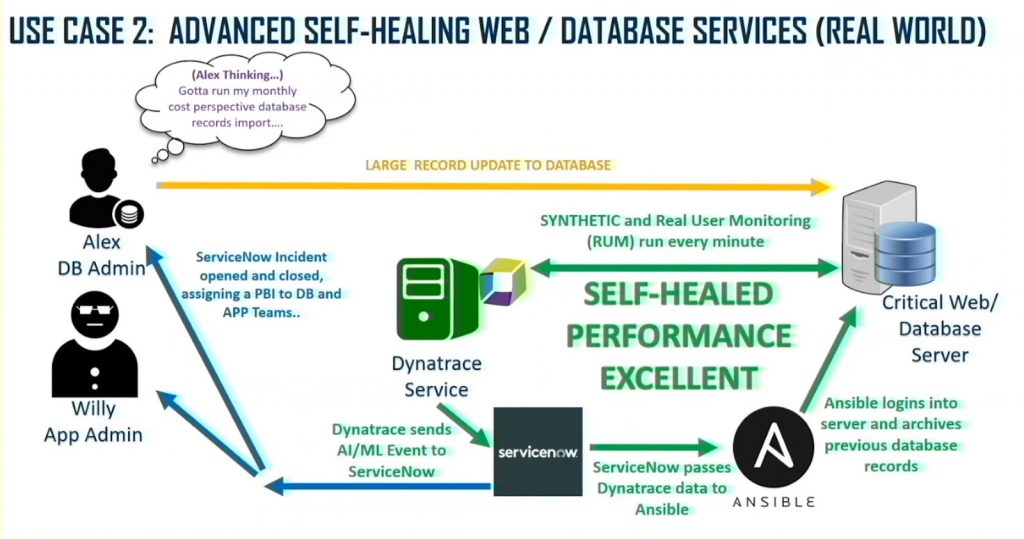
The solution is to orchestrate Dynatrace, Ansible, and ServiceNow, making the server self-healing. Dynatrace Synthetic Monitoring and Real User Monitoring (RUM) are set to run every minute to provide a realistic view of the server’s performance.
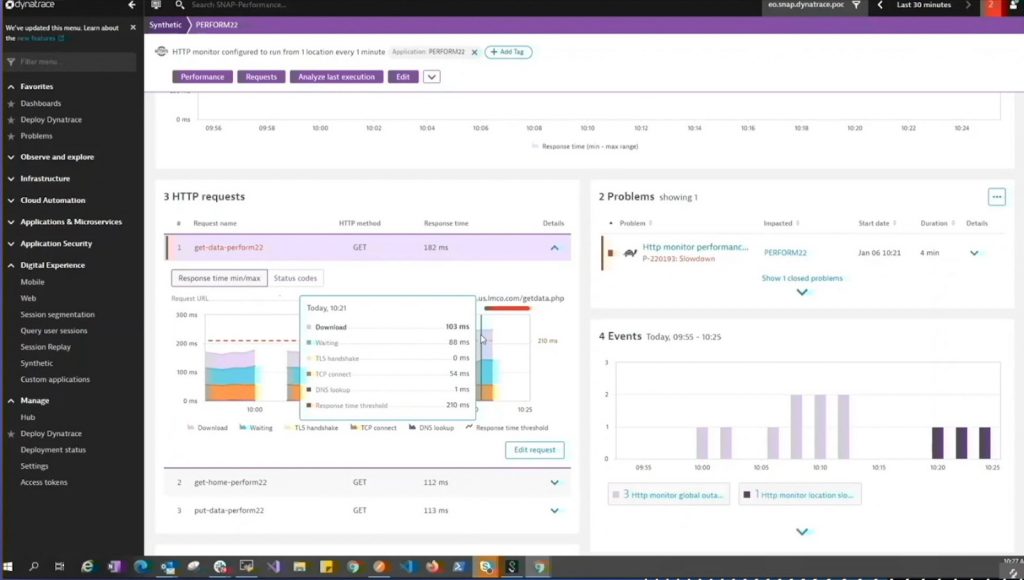
Dynatrace Synthetic Monitoring shows availability, uptime, and average load and response times. The simulated user monitoring service can take these measures from locations simultaneously and across many different types of site content. Additionally, it can show response time by request, so DevSecOps teams can compare normal responses with those from the slowed-down server.
An example of service self-healing using Ansible
Dynatrace Synthetic Monitoring and RUM simulate real-life events, such as reports and database queries. Now, when someone adds new database records and doesn’t archive the old ones, Dynatrace will detect the long loading times. If the load times exceed a certain threshold, Dynatrace sends an event to ServiceNow. In turn, ServiceNow logs the service ticket, posts a message to Slack, and passes the Dynatrace data to Ansible (Figure 2). Ansible then logs into the database, archives the old records, refreshes the web server, and reports the restart to Dynatrace.

Database and application teams can perform root-cause analysis using the Dynatrace data and ServiceNow event logs. The goal is to prevent failures entirely by isolating the triggers that precede an outage or slowdown and moving remediation to a point before failure occurs. This fully automated workflow generates all the necessary data to fix the problem. Additionally, the DevSecOps team can add a failsafe process to automatically archive the old records when a colleague adds new ones.
“The cases are endless of what you can do with Dynatrace and all these things,” Swofford says. “We can kind of see before things happen.”
Intelligent AIOps automation enables healing without humans
When the enterprise service director comes back to run a critical financial report, the server is already self-healed. The whole automated process took less than two minutes — about the time it takes an admin to log into the system.
When the website goes down, an event pops up in Dynatrace and kicks off an action. Troubleshooters can see Dynatrace initiated and completed service remediation. They can also see the affected infrastructure component and walk through the sequence of events. Logs show when Linux servers were restarted, and operations engineers can dig into the steps that started the process. Additionally, the engineers can drill down into the ServiceNow alert to see how long it took to fix issues. The alert includes SLA times, events, and incidents — Dynatrace tags all details.

These metrics can show DevSecOps teams whether the problem is with Apache, the central processing unit, MySQL, or a query issue. Admins can see the factors affecting load time, such as download speed, time spent waiting, TLS handshake, TCP connect, DNS lookup, and response time thresholds.
End-to-end self-healing IT
Thresholds set in Dynatrace can trigger alerts. Ansible logs show a script kicked off a Linux server restart. ServiceNow reveals the exact message from Dynatrace that triggered the script in Ansible.
ServiceNow Service Central shows the flow from the trigger to the creation of an incident record, posting a message to Slack, launching a job template, and completing the job.
“So now when we hit our threshold, we actually have a problem initiated. That’s what we’re triggering off of now,” Swofford explains.
Ultimately, Lockheed Martin’s AIOps stack uses automation to log the entire remediation process — from the start of the slowdown to the response and a return to normal operations.
To learn more about how to speed innovation with AIOps through automation, watch the full session, “Integrated Self-Healing with Dynatrace.”
For more coverage of Dynatrace Perform 2022, check out our Dynatrace Perform 2022 conference coverage guide, Themes to watch at Dynatrace’s annual conference.


Looking for answers?
Start a new discussion or ask for help in our Q&A forum.
Go to forum