Dynatrace Davis AI now automatically analyzes Spring Boot application metrics by Micrometer without any configuration effort on your side. OneAgent enriches the analysis with additional metadata, creating automatic topology discovery across all your hosts, processes, services, pods, containers, and clouds in real time.
Every company has its own strategy as to which technologies to use. To remain flexible in observing all technologies used in their organization, some companies choose open-source solutions, which allow them to stay vendor-neutral. One of these solutions is Micrometer which provides 17+ pre-instrumented JVM-based frameworks for data collection and enables instrumentation code with a vendor-neutral API. Micrometer is used for instrumenting both out-of-the-box and custom metrics from Spring Boot applications.
Spring Boot, on the other hand, is a Java framework for building cloud-native Java applications. Spring Boot 2 uses Micrometer as its default application metrics collector and automatically registers metrics for a wide variety of technologies, like JVM, CPU Usage, Spring MVC, and WebFlux request latencies, cache utilization, data source utilization, Rabbit MQ connection factories, and more.
That’s a large amount of data to handle. Since Micrometer conforms data to the right form and then sends it off for analysis, companies need an easy way to analyze massive amounts of data, get actionable insights in real time, and interpret the resulting alerts and responses. This creates a lot of complexity given different data sources, components, and tools.
Davis topology-aware anomaly detection and alerting for your Micrometer metrics
Here’s how Dynatrace can help you by automatically collecting, extending, and analyzing this telemetry data in context with Davis AI, the Dynatrace AI engine. As with all other custom metrics ingested into Dynatrace via open API interfaces like StatsD, Telegraf, and Prometheus, you can use the full power of Davis AI topology-aware anomaly detection for:
- Auto-adaptive baselines for all your Micrometer metrics.
- Topology-related custom metrics for seamless reports and alerts.
- Any pre-instrumented metrics provided by Micrometer and Spring Boot out-of-the-box and any custom metrics alike.
Deploy at scale with auto-configuration and secure communication
Here’s how it works. Micrometer uses a registry to export metrics to monitoring systems. The Dynatrace registry v2 is available starting with version 1.8.0 of Micrometer. It exports any pre-instrumented metrics for JVM, CPU Usage, Spring MVC, and WebFlux request latencies, cache utilization, data source utilization as well as custom metrics to the Dynatrace Metrics API v2. To use it, simply add a dependency to your Gradle or Maven project in the Dynatrace registry. This can be set up with a couple of lines of code in your Spring Boot project. You can find all the details and sample code in our documentation.
No cumbersome endpoint URL and token management
Auto-configuration is available for all OneAgent-monitored hosts. Metrics are exported directly and securely to Dynatrace without the need to specify a metrics endpoint URL or create an API token. This is to ensure that you can easily collect Micrometer metrics on hundreds of hosts without needing to manage and maintain cumbersome configurations.
Add topology context to your Micrometer metrics
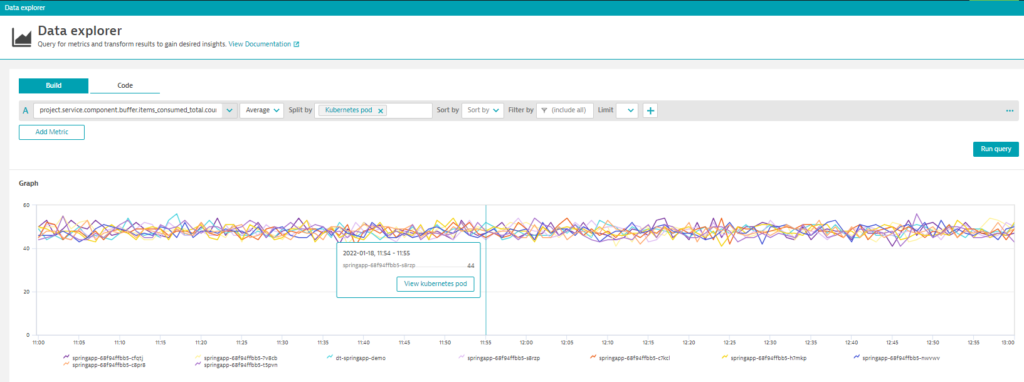
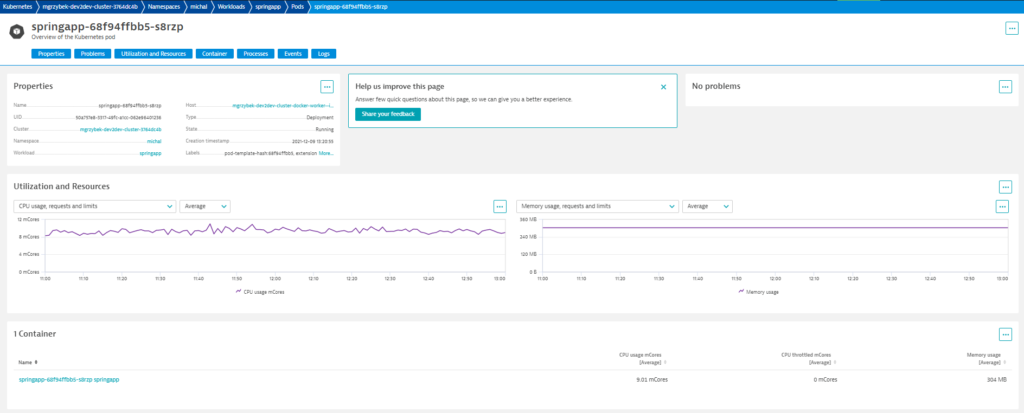
After they are ingested, Micrometer metrics are automatically put in context with all the other observability signals that are collected across your heterogeneous data sources. Every data point is connected to the host, process, workload, and even the pod from which the data was emitted. This enables deep explorative analysis.


To learn more, see our documentation.
You can also look at this blog post to learn more about topology-related custom metrics and how you can use them for reporting and alerting on your specific business needs in Dynatrace.
New to Dynatrace?
If you haven’t used Dynatrace yet, try it out by starting your Dynatrace free trial today.


Looking for answers?
Start a new discussion or ask for help in our Q&A forum.
Go to forum