Learn how the Dynatrace SNMP Traps extension helps IT admins, SREs, and ITOps teams resolve day-to-day challenges. Improve observability and leverage Davis AI and log monitoring skills to accelerate problem solutions.
Complexity and data volume for IT infrastructure soars to new heights
The volume of data and events grows in tandem with the rising complexity of IT infrastructure. Monitoring modern IT infrastructure is difficult, sometimes impossible, without advanced network monitoring tools. While the market is saturated with many Network Administrator support solutions, Dynatrace can help you analyze the impact on your organization in an automated manner.
We took the first step in bringing network infrastructure data to the Dynatrace platform with the introduction of SNMP extensions some time ago. Since then, the extensions’ capabilities have been substantially improved, not just for data but also in the presentation layer and topological model.
Various network devices, such as routers and switches, employ the Simple Network Management Protocol (SNMP) to report a device’s overall condition. SNMP provides access to availability and performance indicators. The protocol was launched in 1988, and three versions have since been released to accommodate growing technological demands. Given its long history, the entire infrastructure industry now supports SNMP, from basic network equipment like printers and switches to highly specialized devices like load balancers and firewalls.
While SNMP allows you to query monitored devices for performance information, SNMP traps are used to proactively report certain types of events. These can range from routine state transition events to critical problem reports. So not only does the purpose of such event data differ, but so does its availability: polled vs. pushed.
How SNMP traps help detect problems
SNMP traps can contain a variety of event-data types. The catalog of recorded events varies depending on the manufacturer and kind of device, with the simplest devices reporting only configuration or status changes. Unfortunately, some trap occurrences might be reported continuously during an incident, resulting in so-called “trap storms.”
Interface state change is the most typical event type. While they can be produced by routine maintenance tasks, in more critical scenarios, they can demand immediate action from IT Ops. The most common type of occurrence recorded related to interface-state transition is port (or link) flapping, in which the interface regularly shuts down and reboots. The issue might be temporary or persistent and is often caused by link synchronization errors, such as those driven by physical connectivity concerns.
Another set of examples includes various sensor states. Most network devices have temperature and fan speed sensors, and some even function as standalone devices, such as contact switches. Temperature sensors can indicate a device’s excessive load, a faulty fan, or an AC problem. Contact switches are used to notify, for example, on the opening of a rack/room door, which is critical in controlled-access zones.
Finally, there are device-specific notifications, which vary greatly depending on the device type and vendor. These alerts might signal excessive resource consumption, which leads to inefficient operation or other problems. If your critical business infrastructure depends on such devices, it’s crucial that you understand their impact.
In any of these scenarios, immediate action might be necessary to keep your infrastructure working and mitigate the potential risk.
Dynatrace enables observability and AI-powered alerting for SNMP Traps
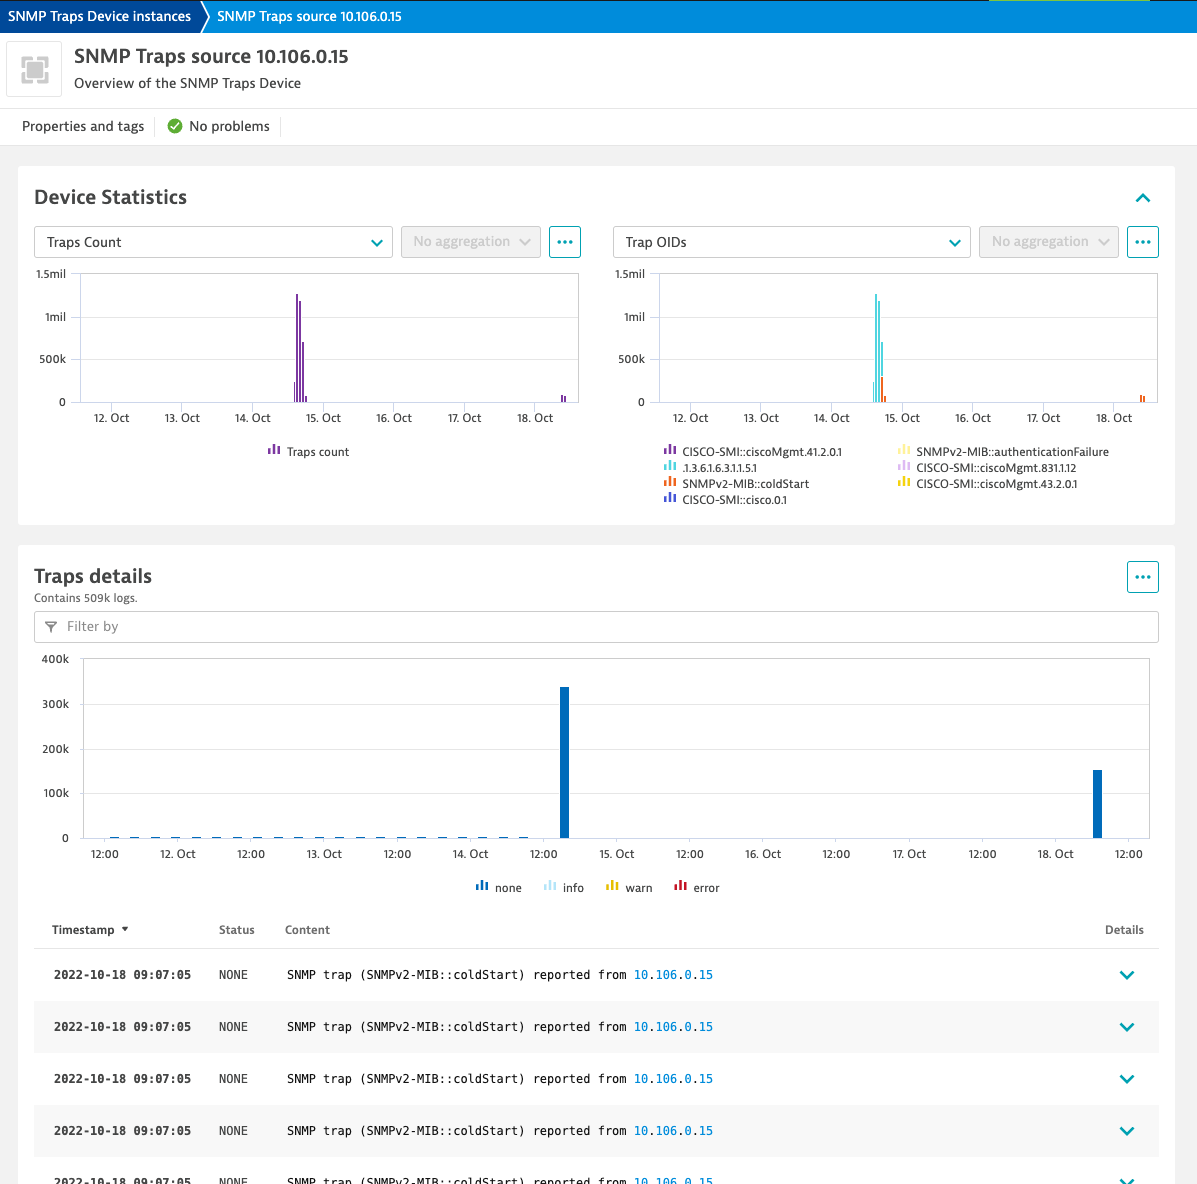
The primary aim of monitoring SNMP traps is to notify on anomalies so that prompt and appropriate action can be taken to limit the potential repercussions of critical events. While a trap event can provide enough information on its own to remedy a stated problem in certain circumstances, it’s essential that you can assess the impact of events so that you can take appropriate measures. The SNMP Traps Device instances overview page shows all the critical data you need to uncover metric abnormalities associated with a recorded trap event, allowing IT Ops to swiftly identify the root cause.
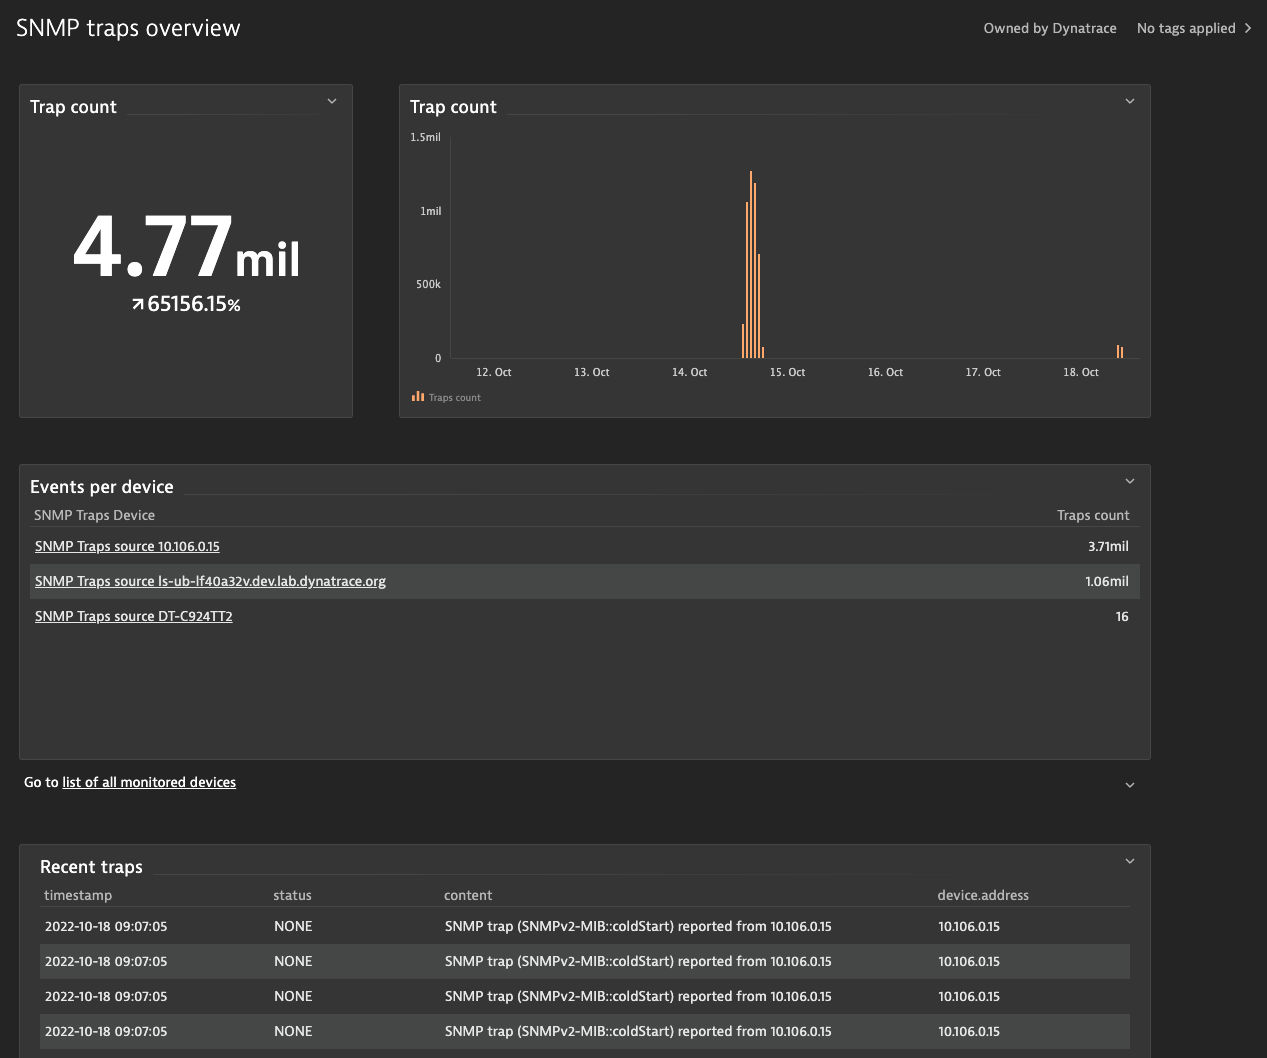
The SNMP Trap extension has a dedicated dashboard that can be used to obtain an overview of all reported traps. You can examine which devices report the most trap events and, if necessary, configure settings to focus solely on the most important events.
Enable intelligent alerting and avoid trap storms
With Dynatrace Davis, AI-driven alerting can be automated. You can configure alerts so that a notification is sent whenever a trap is reported.
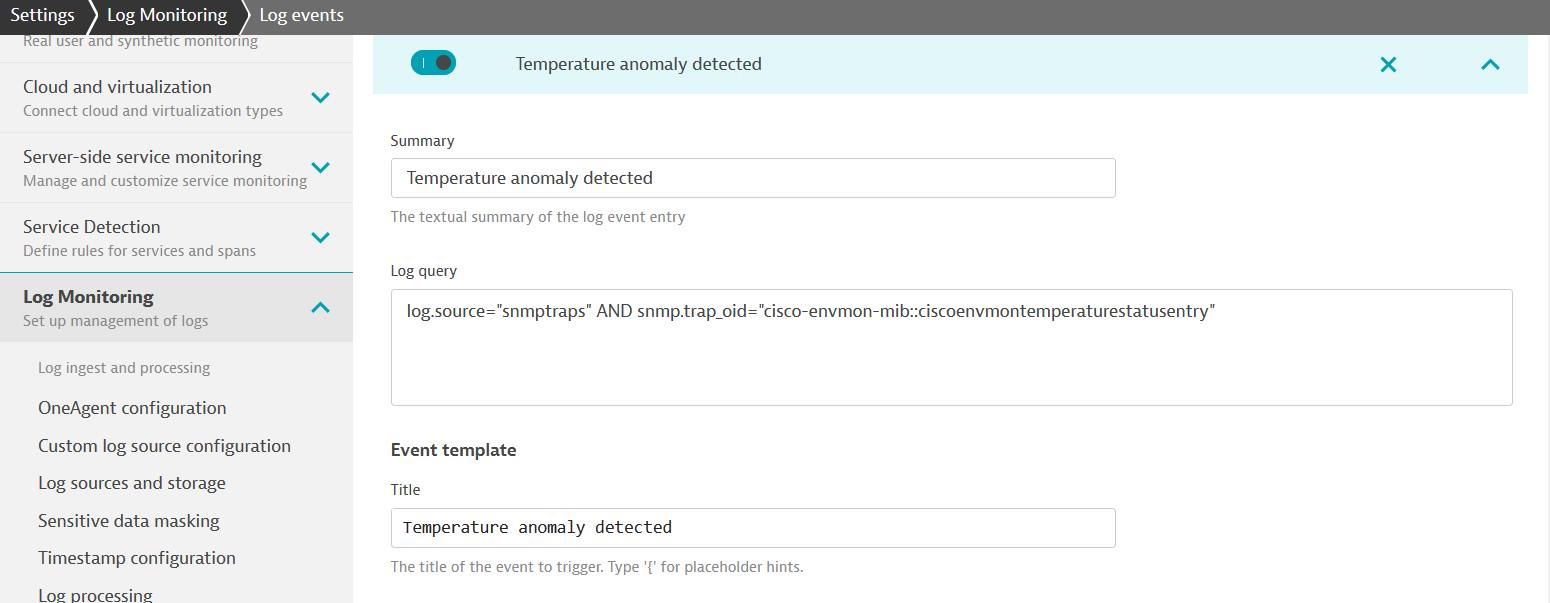
Dynatrace Davis AI automatically establishes a baseline and reports problems as soon as an anomaly is detected:
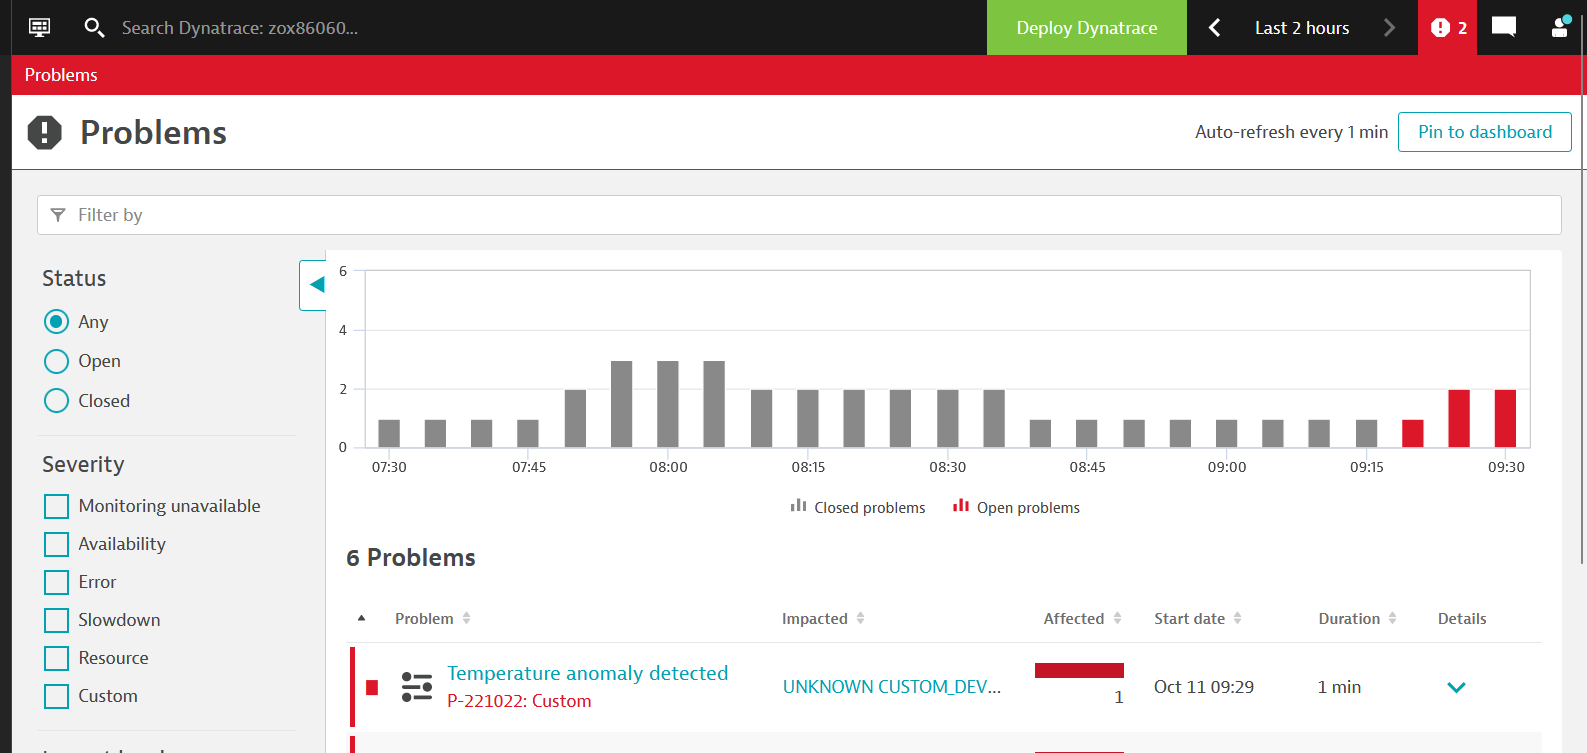
The SNMP Traps extension delivers data on trap events in two ways:
- Log events include all specified events, with each variable binding (variable-bindings) expressed as a single log event attribute.
- Log processing can extract and process the information from an SNMP trap event.
You can also extract a metric from any trap event attribute and track it as a regular metric or set up an alert.
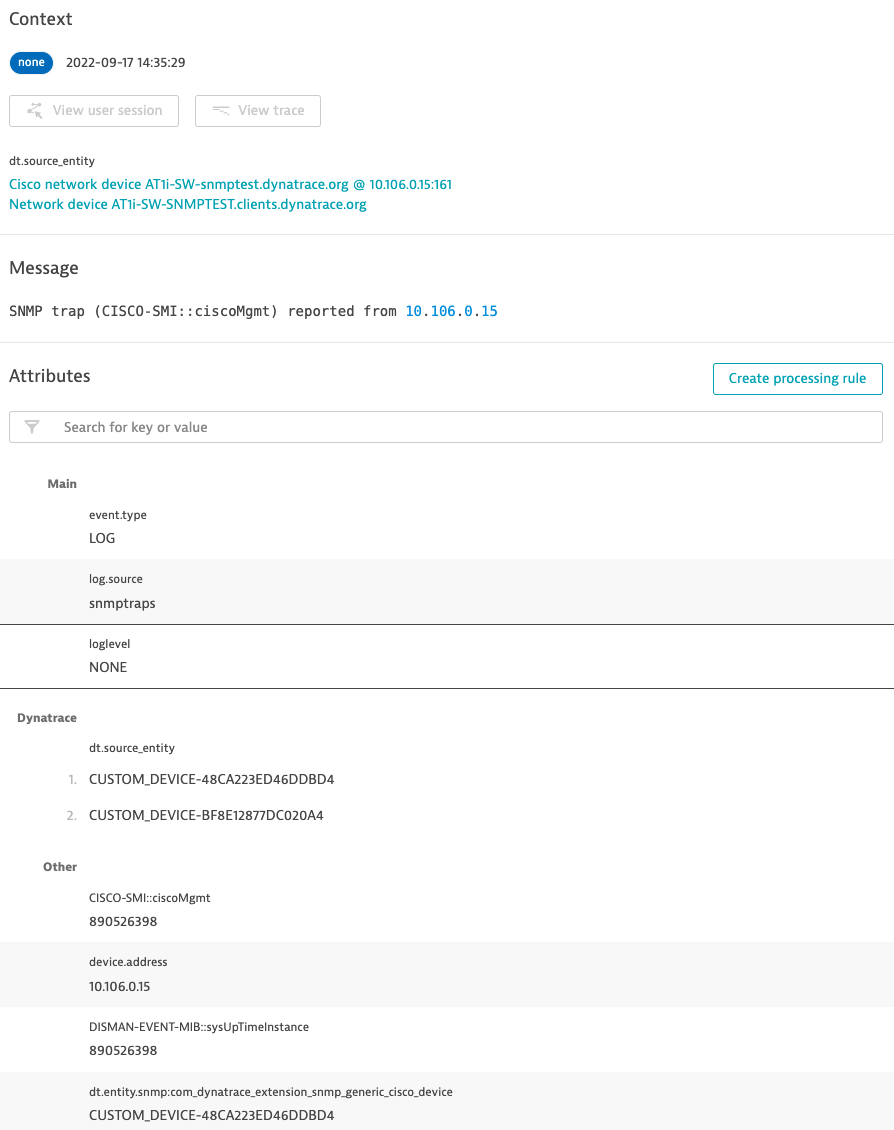
While trap events contain all the relevant details, it’s enough to know how many traps were reported of a specified type in the case of an SNMP trap storm—it’s not necessary that you analyze each individual event. You can leverage a trap counter metric to raise an alert for any event generated using a trap counter metric that shows a trap storm.
Capture SNMP traps in a few clicks
A few configuration steps are required to track SNMP traps.
The configuration begins with extension activation and configuration, which allows you to define the SNMP version and monitoring scope using the IP address range and community.
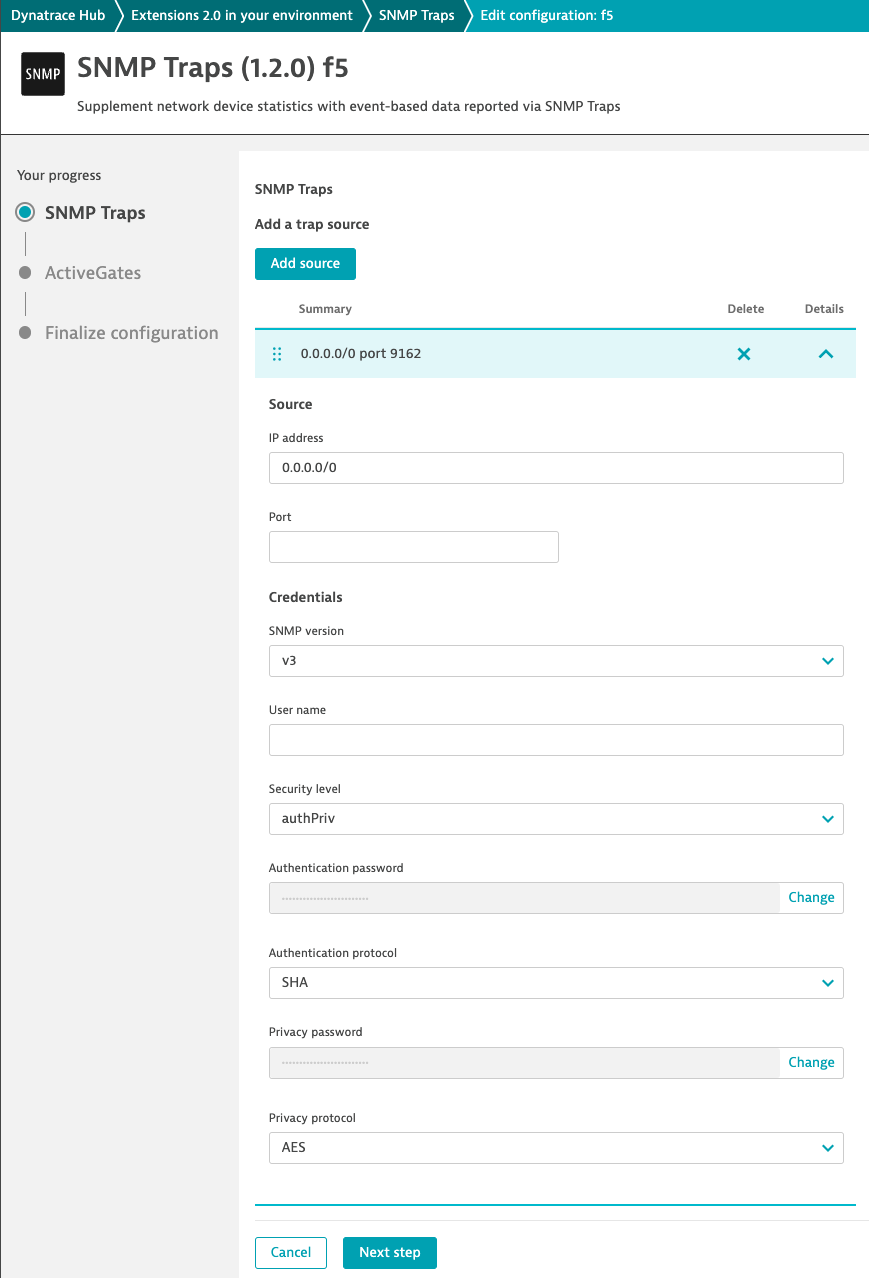
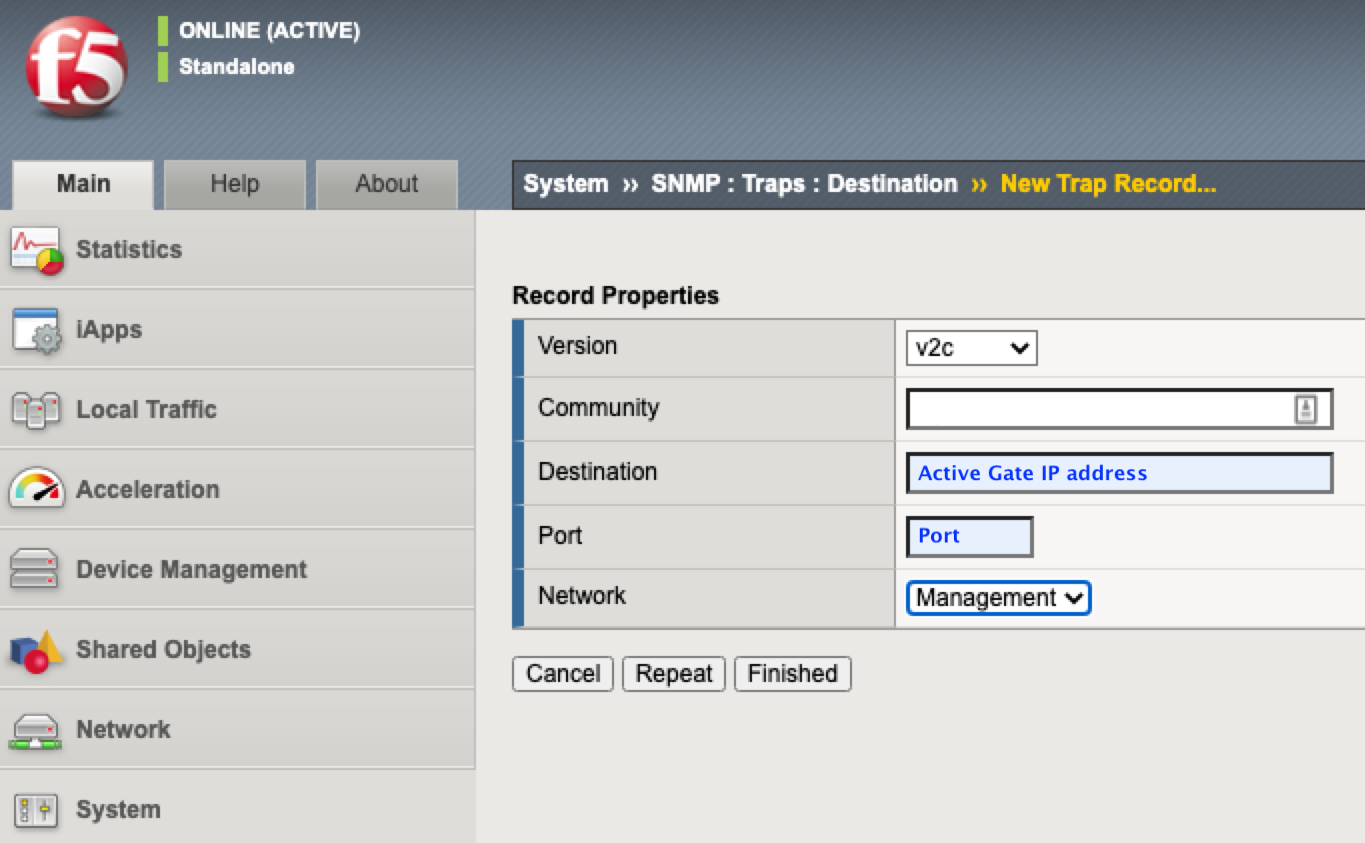
The trap target must be specified on each device to enable devices to report events. This is a necessary manual step. This is an ActiveGate operating as a trap listener in a Dynatrace deployment, where the extension will run and process received traps.

What’s next?
Dynatrace network observability is constantly evolving. While SNMP metrics and trap events provide the fundamentals of network device observability, they’re insufficient for generating meaningful insights into a device’s impact on overall infrastructure health.
The Dynatrace generic topology model lets you model your internal architecture and helps IT Ops better comprehend the complexity and connections between entities. We plan to use topology model capabilities to show all network devices in a single interface, allowing you to rapidly identify problematic devices.
When it’s feasible to specify dependencies between network devices and the services that rely on them, the Dynatrace topology model will assist you in analyzing those relationships, utilizing the Davis AI root cause analysis engine to offer actionable answers.
Your feedback is greatly appreciated.
We need your feedback to improve the Dynatrace network experience. Please share your feedback and product ideas on the Dynatrace Community so we can work together to produce a solution that perfectly tailored to your needs.


Looking for answers?
Start a new discussion or ask for help in our Q&A forum.
Go to forum