In my recent Performance Clinic with Stefano Doni, CTO & Co-Founder of Akamas, I made the statement, “Application development and release cycles today are measured in days, instead of months. Configuration options of the tech stack continue to increase in scope and complexity, with dependencies that have become unpredictable. Without automation, Performance engineers and developers can no longer ensure that applications perform as planned, and costs are minimized.”
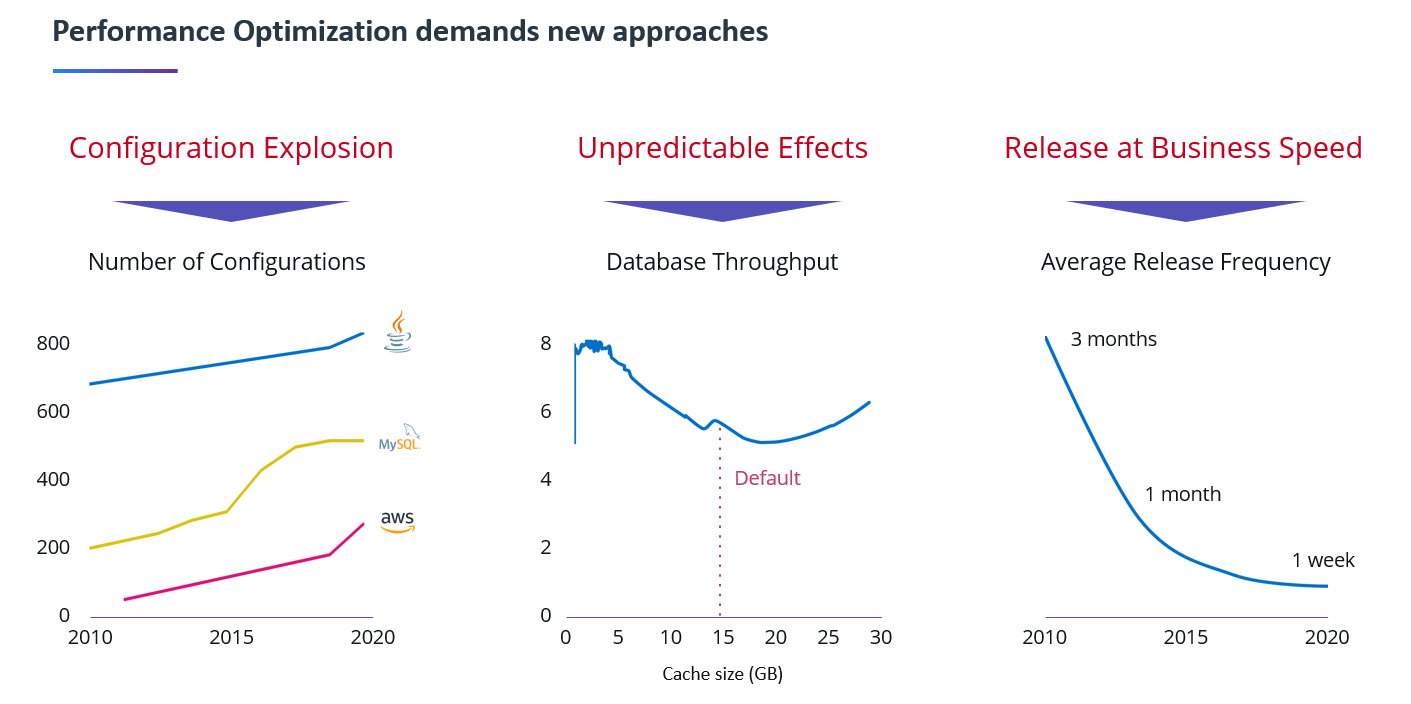
During the Performance Clinic episode, I asked Stefano to tell us more about this changing world and how we can leverage automation, AI and machine learning to optimize modern software stacks despite the increased complexity. Stefano started his presentation by showing how much cost and performance optimization is possible when knowing how to properly configure your application runtimes, databases, or cloud environments:
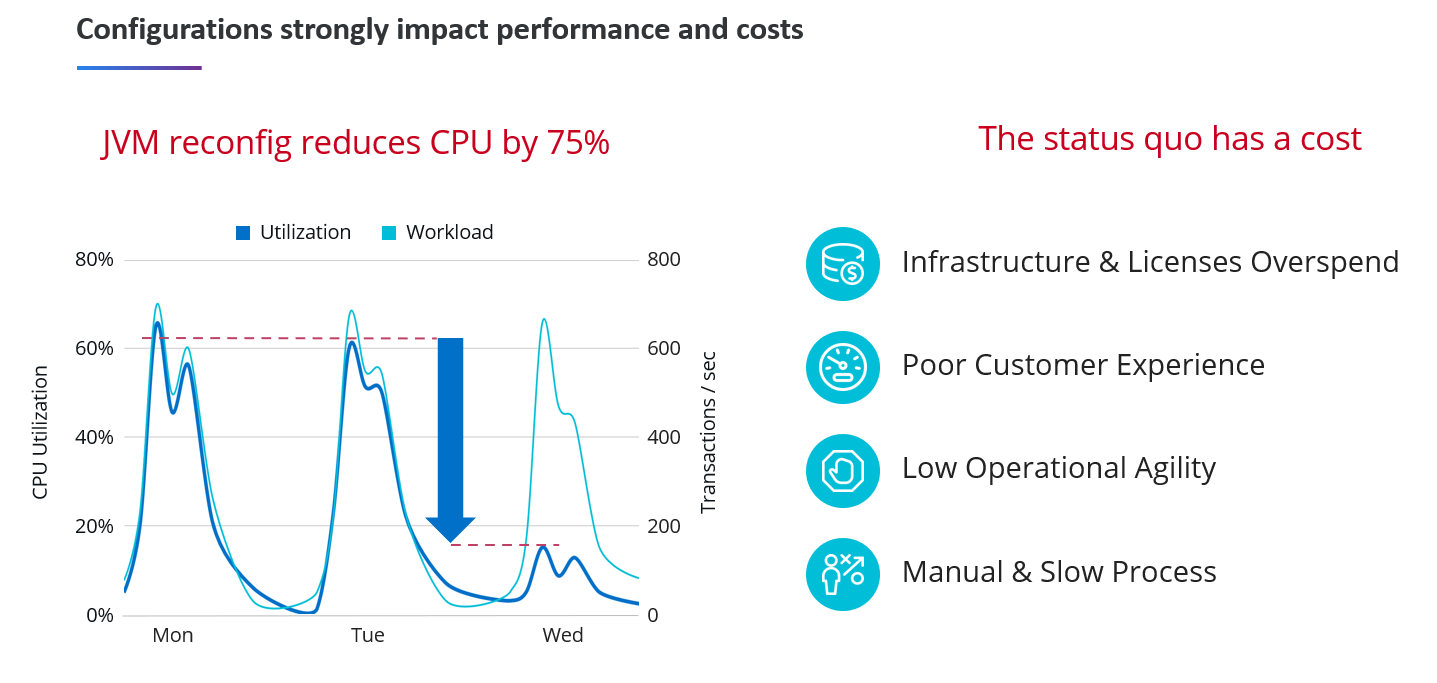
Let me give you an overview of what was shown and let me answer questions we couldn’t answer during the webinar due to a technical glitch on the webinar platform!
Autonomous Performance Optimization with Akamas & Dynatrace
If you want to see a more hands-on approach, I encourage you to watch the recording as Stefano did a live demo of Akamas’s integration with Dynatrace, showing how to minimize the footprint of a Java application with automated JVM tuning.
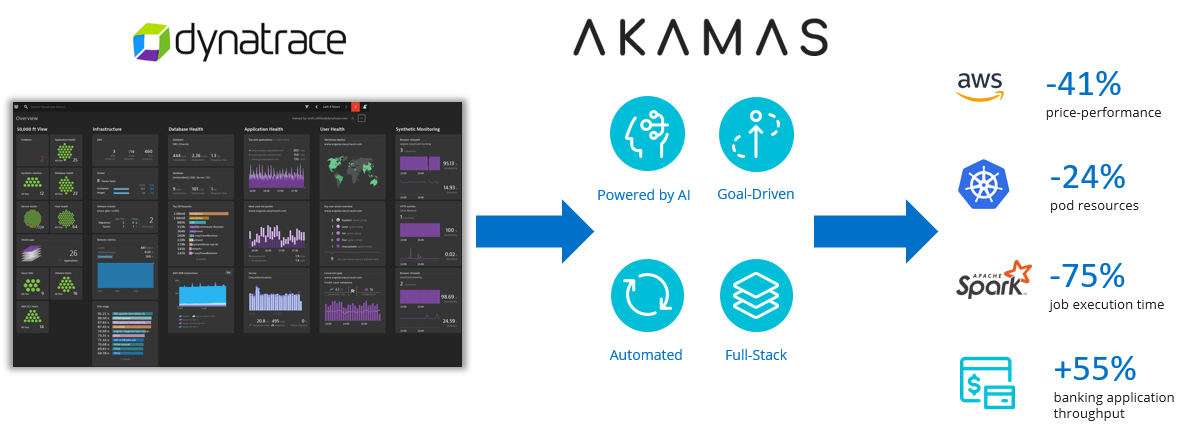
In a nutshell, Akamas uses an AI-driven optimization approach by running multiple experiments in sequence to optimize a goal the user can set, e.g. minimize resource consumption or maximize transaction throughput. After every experiment run Akamas changes application, runtime, database or cloud configuration based on monitoring data it captured during the previous experiment run. To prove this novel approach works have a look at some of the optimization results Akamas has achieved already:
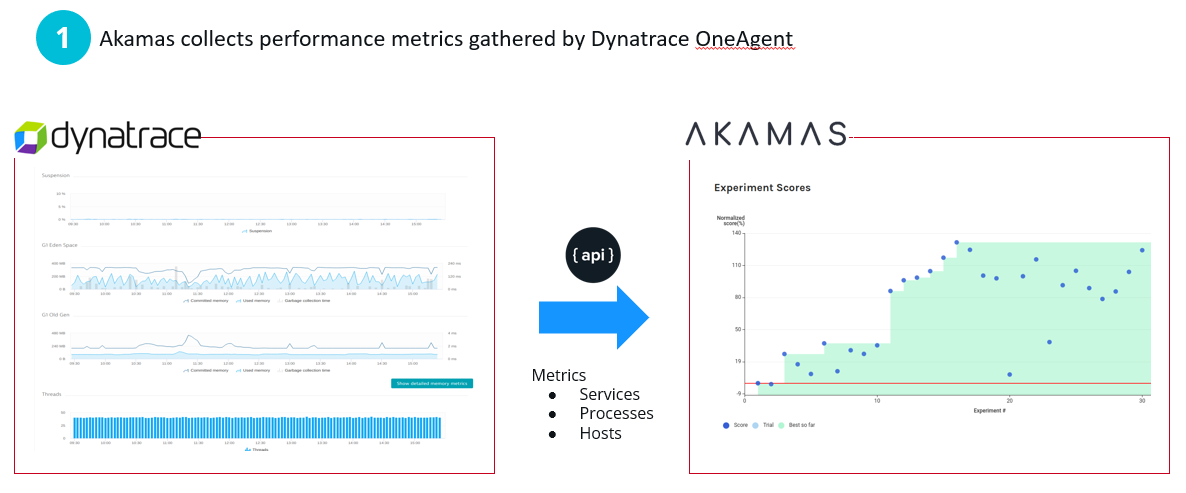
The integration with Dynatrace has two sides: first, it pulls metrics from Dynatrace while Akamas is executing an experiment. This data then flows into their AI and Machine Learning Engine to decide which configurations to change next:
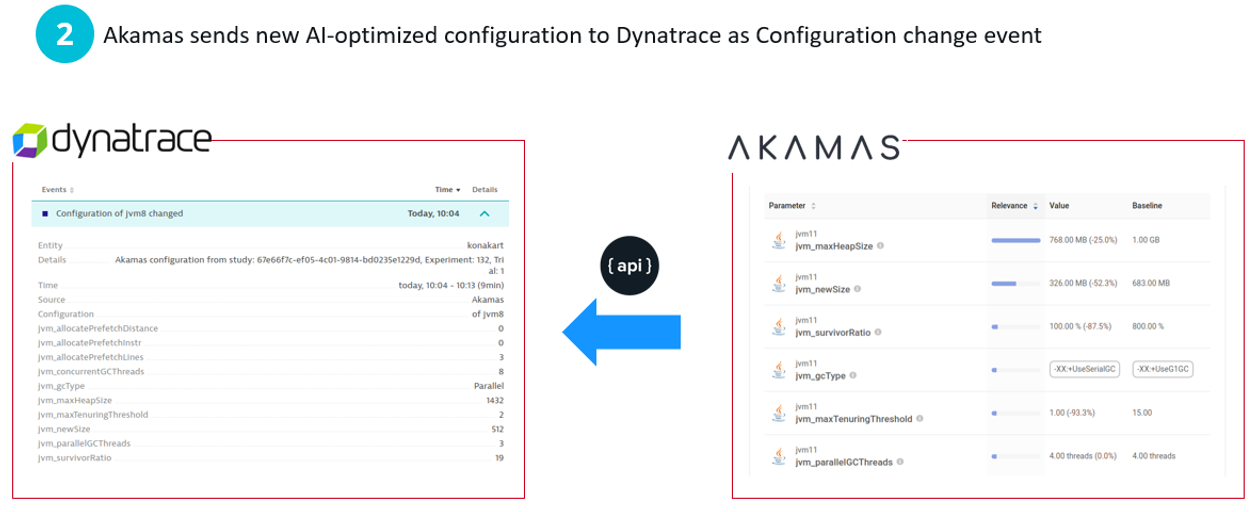
Every time Akamas changes a configuration, e.g. JVM Heap Sizes, Thread Pool Sizes and so on, it also informs Dynatrace about that change so Dynatrace is aware on which changes are made to the system it is monitoring:
If you want to try this yourself make sure you watch the webinar and then head over to https://www.akamas.io/.
Webinar questions we couldn’t answer
While we made it through the webinar without a glitch, we ran into a technical issue during Q&A which is why we couldn’t answer all questions live. I sat down with Stefano to answer the incoming questions offline and now using the rest of the blog to bring those answers to you:
Q1: What type of technologies does Akamas support?
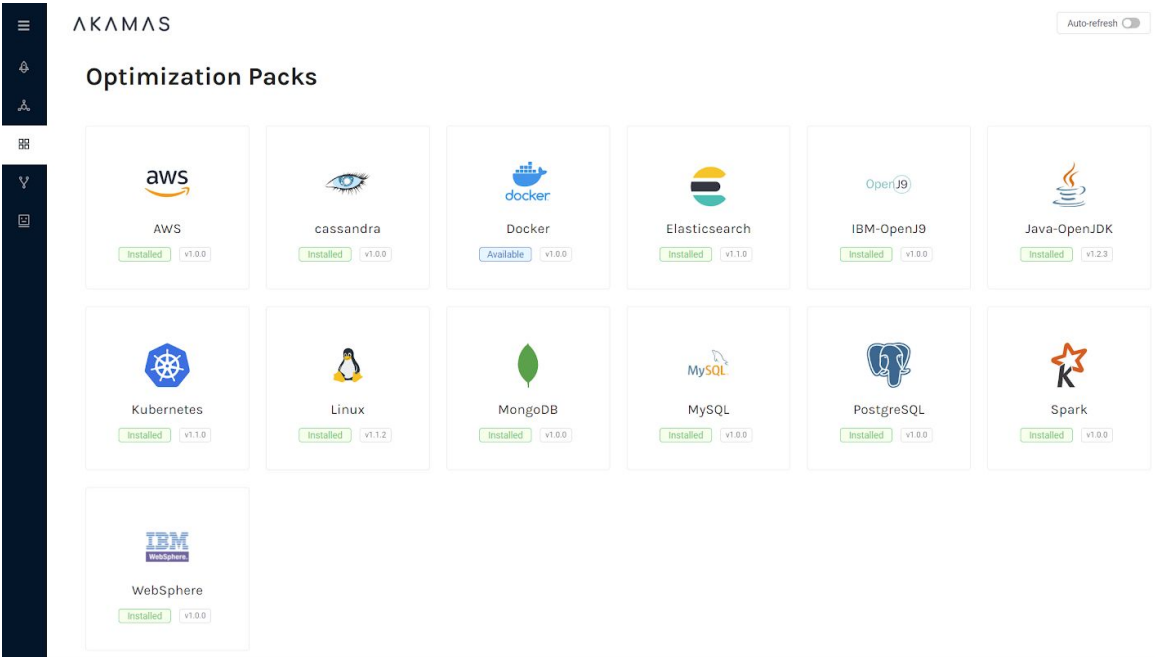
Akamas is a flexible optimization platform and optimizes many market-leading technologies thanks to its Optimization Pack library. Supported technologies include cloud services, big data, databases, OS, containers, and application runtimes like the JVM. Custom application settings can be easily optimized too, thanks to Akamas flexible AI-driven optimizer and powerful automation capabilities. A full list of currently-released Akamas Optimization Packs can be found on our website.
Q2: Can you specify certain conditions, e.g. a certain setting should be within a pre-defined range or something like which GC should be used in our JVM?
Yes! Akamas Optimization Packs already include the range of values that parameters can assume so that you don’t have to know all of them. For example, the jvm_gcType parameter already contains the list of GC types that are allowed in OpenJDK 11. You can also override the range: for example, you can say that jvm_gcType can be G1 or Parallel, and your jvm_maxHeapSize goes from 1 GB to 2 GB.
Q3: Is Akamas a SaaS offering or on-premise?
Akamas is an on-premises product and simply needs one virtual machine to get started.
Q4: Do you have a way to integrate new technology stacks to Akamas via a plugin mechanism?
Yes! Akamas comes with a library of Optimization Packs which contain all the knowledge required to optimize specific IT stacks like Java, Linux, or Docker (see answer no.1). Akamas is an open optimization platform: optimization packs for new technologies can be built very easily by the end-user, it’s just a matter of writing a few YAML files where you describe the technology parameters you want to optimize, and their ranges. Akamas AI will take them into consideration right away!
Q5: What’s the metric you pull for each experiment – is this an average across the timeframe of the experiment? or do you pull different percentiles?
Akamas integrates with many popular monitoring tools like Prometheus or Dynatrace and with load injection tools like Neoload or Loadrunner to gather performance data. Akamas gathers all the metrics that you have configured – such as average or percentiles of response times of a web application, the CPU usage of a container and more.
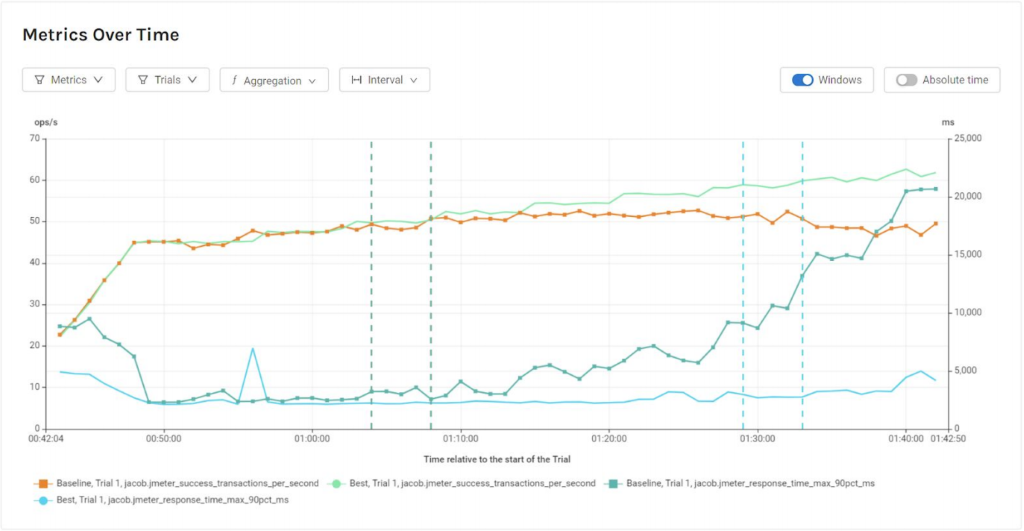
Akamas also enables you to automate the analysis of the experiment metrics in powerful ways. For example, our smart windowing feature can automatically identify the time window during the experiment (e.g. performance test) when the application reaches a stable throughput without violating response time constraints. The experiment score will be computed on the identified time window so that you can achieve truly reliable optimizations.
Q6: Does Akamas need to have an agent installed on each host/application? Or is it just a one-point integration with Dynatrace?
There is no Akamas agent to be installed on hosts or applications. Akamas integrates natively with monitoring and configuration management tools to gather metrics (e.g. from Dynatrace) and to apply optimized parameters (e.g. via Cloud APIs or plain simple SSH).
Automation is the key to optimizing our systems
Thanks again to Stefano Doni, CTO & Co-Founder of Akamas, for making performance optimization easier in a world that is becoming more complex every day. Tools like Akamas allow us to help our organizations deliver exceptional performance while keeping an eye on resource consumption and costs. If you’re interested in learning more feel free to reach out to us with your stories, thoughts or suggestions!
I encourage you to watch the full performance clinic – either on YouTube, on Dynatrace University (also includes slides download), by registering for the On-Demand version or below.



Looking for answers?
Start a new discussion or ask for help in our Q&A forum.
Go to forum