Monitoring resource consumption of processes alone may not give you the insights you’re looking for because processes that consume excessive resources usually don’t suffer from performance problems (it’s the other processes that suffer). There are two ways to approach such network-health analysis: read your network or read the tea leaves. This post explores one of these options; read on to find out which.
Most modern applications are built on a request/response model—typically using TCP for communication between application components and data delivery to end users.
Responsiveness
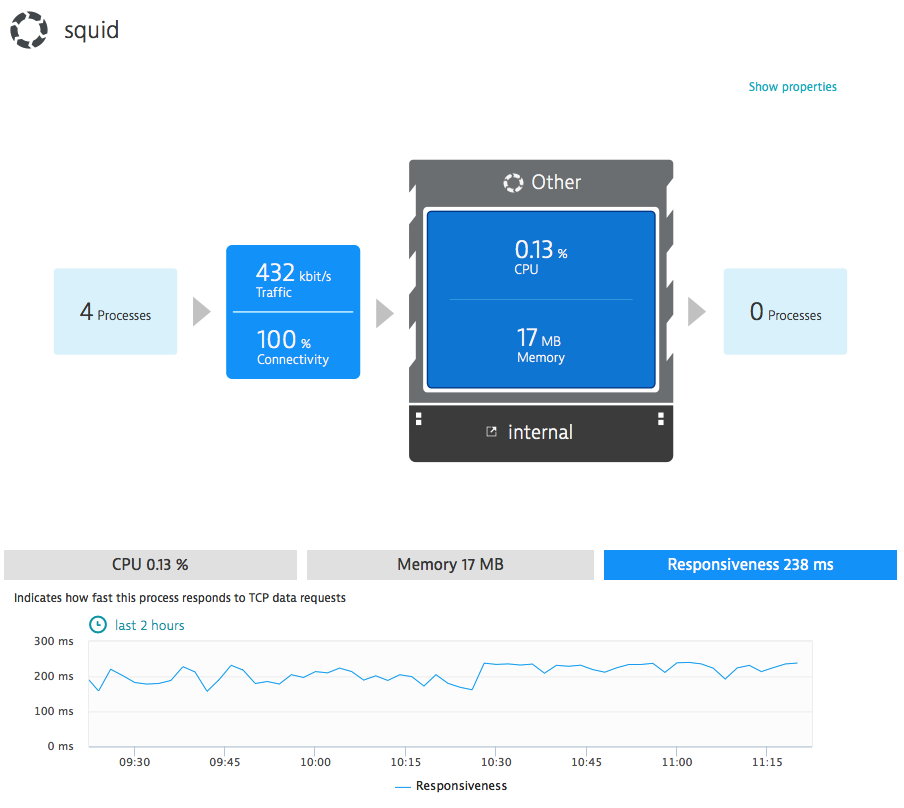
Process responsiveness is the measure of time between when a request is sent and when the response to the request is received. Dynatrace offers responsiveness metrics for all monitored processes (see example below).

Some processes have fairly steady responsiveness, while others—depending on traffic profile—show more variance. It’s important to watch the correlation between available hardware resources, process responsiveness, and the response time of services that rely on those processes.
The most valuable aspect of this metric is that it’s available for all monitored technologies that communicate via TCP sockets—so it works as well for your legacy applications as it does for your native processes.
Responsiveness of processes is a key metric used for response time analysis, but there’s more to the request/response cycle you should be aware of.
Response throughput
Imagine that a web server or SQL server produces a large response (a web page or SQL query result) that needs to be sent to the client. It’s up to the network to promptly deliver the response, otherwise the client will experience a delay, regardless of the speed of the server response.
We all know what network bandwidth is, but it’s not so easy to know how much bandwidth is available to server processes. This is because delivery of responses to clients is influenced by dozens of factors that fluctuate based on the shared nature of network resources and Internet links.
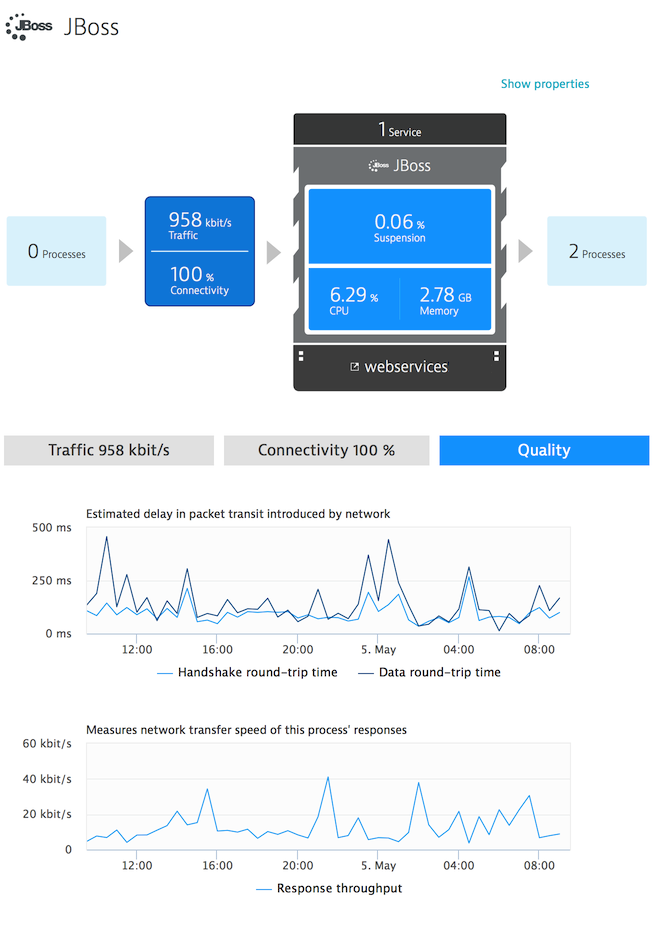
Here again, Dynatrace monitoring has you covered. Dynatrace delivers response throughput metrics for all monitored processes (see below).

Response throughput dictates the network (or Internet) connection speed experienced by clients, as it relates to front-end processes. It also dictates the effective network bandwidth between the hosts that support your application infrastructure.
Depending on the nature of how your processes communicate, there’s still another metric you should know about, especially when it comes to the “chattiness” of processes.
Round trip time
The time it takes for a packet to reach its destination varies largely on the geographical distance between servers. The chattier an application is, the more packets it requires, and the more sensitive it is to network latency.
Different types of round-trip time come into play depending on whether or not a process works with lots of smaller packages or with fewer but larger packets. This is why Dynatrace visualizes the round-trip-times of both handshakes and data transfers.
This distinction can provide valuable insights as it provides hints about possible optimizations. You may assume that it’s better to send fewer but larger packets rather than more smaller packets. By visualizing round-trip-times of both handshakes and data transfers Dynatrace shows you how your applications really perform, relieving you of guesswork.
The takeaway
The really revolutionary thing about these network metrics is that they are available for all monitored technologies. No matter whether you use C++, D or even assembler, Dynatrace provides detailed insight into the health of all technologies that communicate via the TCP network layer. This allows for quick process health assessments by measuring how well a process responds to requests from other processes or clients, regardless of resource consumption.
Ready to see for yourself?
Still haven’t tried Dynatrace? It’s about time then!
Sign up for Dynatrace today. It’s free to get started!


Looking for answers?
Start a new discussion or ask for help in our Q&A forum.
Go to forum