There's no way to accurately predict capacity of Kubernetes nodes or clusters without a high level of observability.
A decade ago, while working for a large hosting provider, I led a team that was thrown into turmoil over the purchasing of server and storage hardware in preparation for a multi-million dollar Super Bowl ad campaign. Our procurement decisions were based on trace data that was pulled from a handful of fragmented monitoring solutions. The data had to be painstakingly stitched together over the course of a few weeks, across each layer of our stack. The effort was exhausting to say the least.
Today, much of the world’s applications are in the cloud and moving to Kubernetes. And yet, Super Bowl-type advertising initiatives remain an expensive and risky proposition. There’s no way to accurately predict the capacity of Kubernetes nodes or clusters without a high level of observability.
Achieve observability with Dynatrace
Instant Kubernetes observability out-of-the-box with Dynatrace OneAgent
With Dynatrace OneAgent technology, your Kubernetes clusters gain self-managed observability as soon as a node is provisioned. Without this instant and self-managed feedback loop, your team wouldn’t be able to measure its own success—at least not reliably when, for example, a new security patch is deployed.
High fidelity data, zero developer involvement
Dynatrace industry-leading tracing, metrics, and log ingestion provide the level of high-fidelity data that teams need to make accurate predictions about capacity. Because OneAgent automatically detects service endpoints and stitches requests together, it doesn’t require that developers manually write trace code. This is important because manual tracing is super costly and there is a lack of information available on this topic to assist developers.
Super Bowl-scale capacity decisions demand instant observability out of the box, including lifecycle management for upgrades and patches. Such decisions must be attainable with little to no developer involvement in surfacing traces, metrics, and logs. Thankfully, Dynatrace has been working on just such a solution for years.
In this blog post, we’ll look at how Dynatrace provides you with observability throughout your application stack. We’ll look at lifecycle management and then move on to tracing, while sharing some exciting announcements about Google Kubernetes Engine along the way.
Easily build automation scripts and execute quick changes with the OneAgent Helm chart
Two years ago we were the first player in the observability market to build an Operator using the Operator framework for managing the lifecycle of OneAgent in Kubernetes. Using the OneAgent Operator, DevOps teams gain full observability within minutes across all applications and services in the cluster. Equally important, they can easily deploy security patches, new features, and patches directly from Dynatrace whenever they’re available. No tickets need to be filed, and no emails need to be sent to roll out a new release.
We remain the only observability vendor in the industry to provide this full lifecycle approach.
This year we made further improvements by using Helm on top of the Operator Framework. The new OneAgent Helm chart introduces a parameter-based approach, which spares your team the annoyance of editing yet-another set of YAML files to deploy the Operator. This approach saves time and headaches in building automation scripts and makes it easy to execute quick changes via the command line. The OneAgent Helm chart, which is now available to all Dynatrace users in a GA release, is listed on Helm Hub and installable using the helm CLI.
As I hinted in the opening paragraph, the OneAgent Helm chart also unlocks some important marketplace integrations, most notably the GCP marketplace for Google Kubernetes Engine. I’ll dive into this after a closer look at the inner workings and additional value that the Helm chart provides.
The OneAgent Helm chart is one-of-a-kind
Helm offers much needed package management for Kubernetes. In the latest version of Helm, the project removed an Operator-like component named Tiller. This is a positive change as it reduces complexity and allows Helm 3 to shine at what it does best, parameter-based package management using the helm CLI.
Our new OneAgent Helm chart installs OneAgent Operator for you, which provides all operational responsibilities for OneAgent. This separation blends the strengths of these two technologies, decreasing the amount of configuration your team needs to think about, and increasing the level of automation you can achieve.
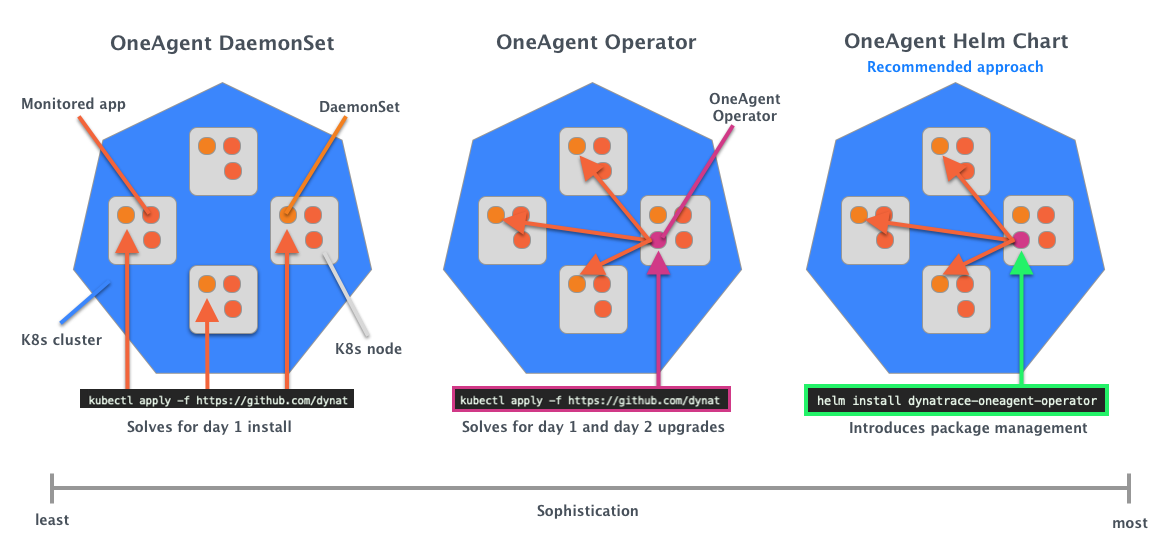
With this new method of deployment, you now have three alternatives for deploying OneAgent, which gives you a tremendous amount of flexibility based on your requirements. You can continue to use the OneAgent Operator without Helm, or the DaemonSet by itself, if you prefer to reproduce the sophistication we provide in your own Ansible, Chef, or Puppet tool chains.
Using sophistication as a dimension for evaluating these three methods of deployment is helpful (see diagram below). Notice that the new OneAgent Helm chart, which is the most sophisticated, is the one that’s recommended for Kubernetes.
Rapid OneAgent rollouts on Google Kubernetes Engine
The new OneAgent Helm chart is great news for those on GKE. Using the Helm chart, we built a streamlined integration for GKE, which is available as a marketplace integration.
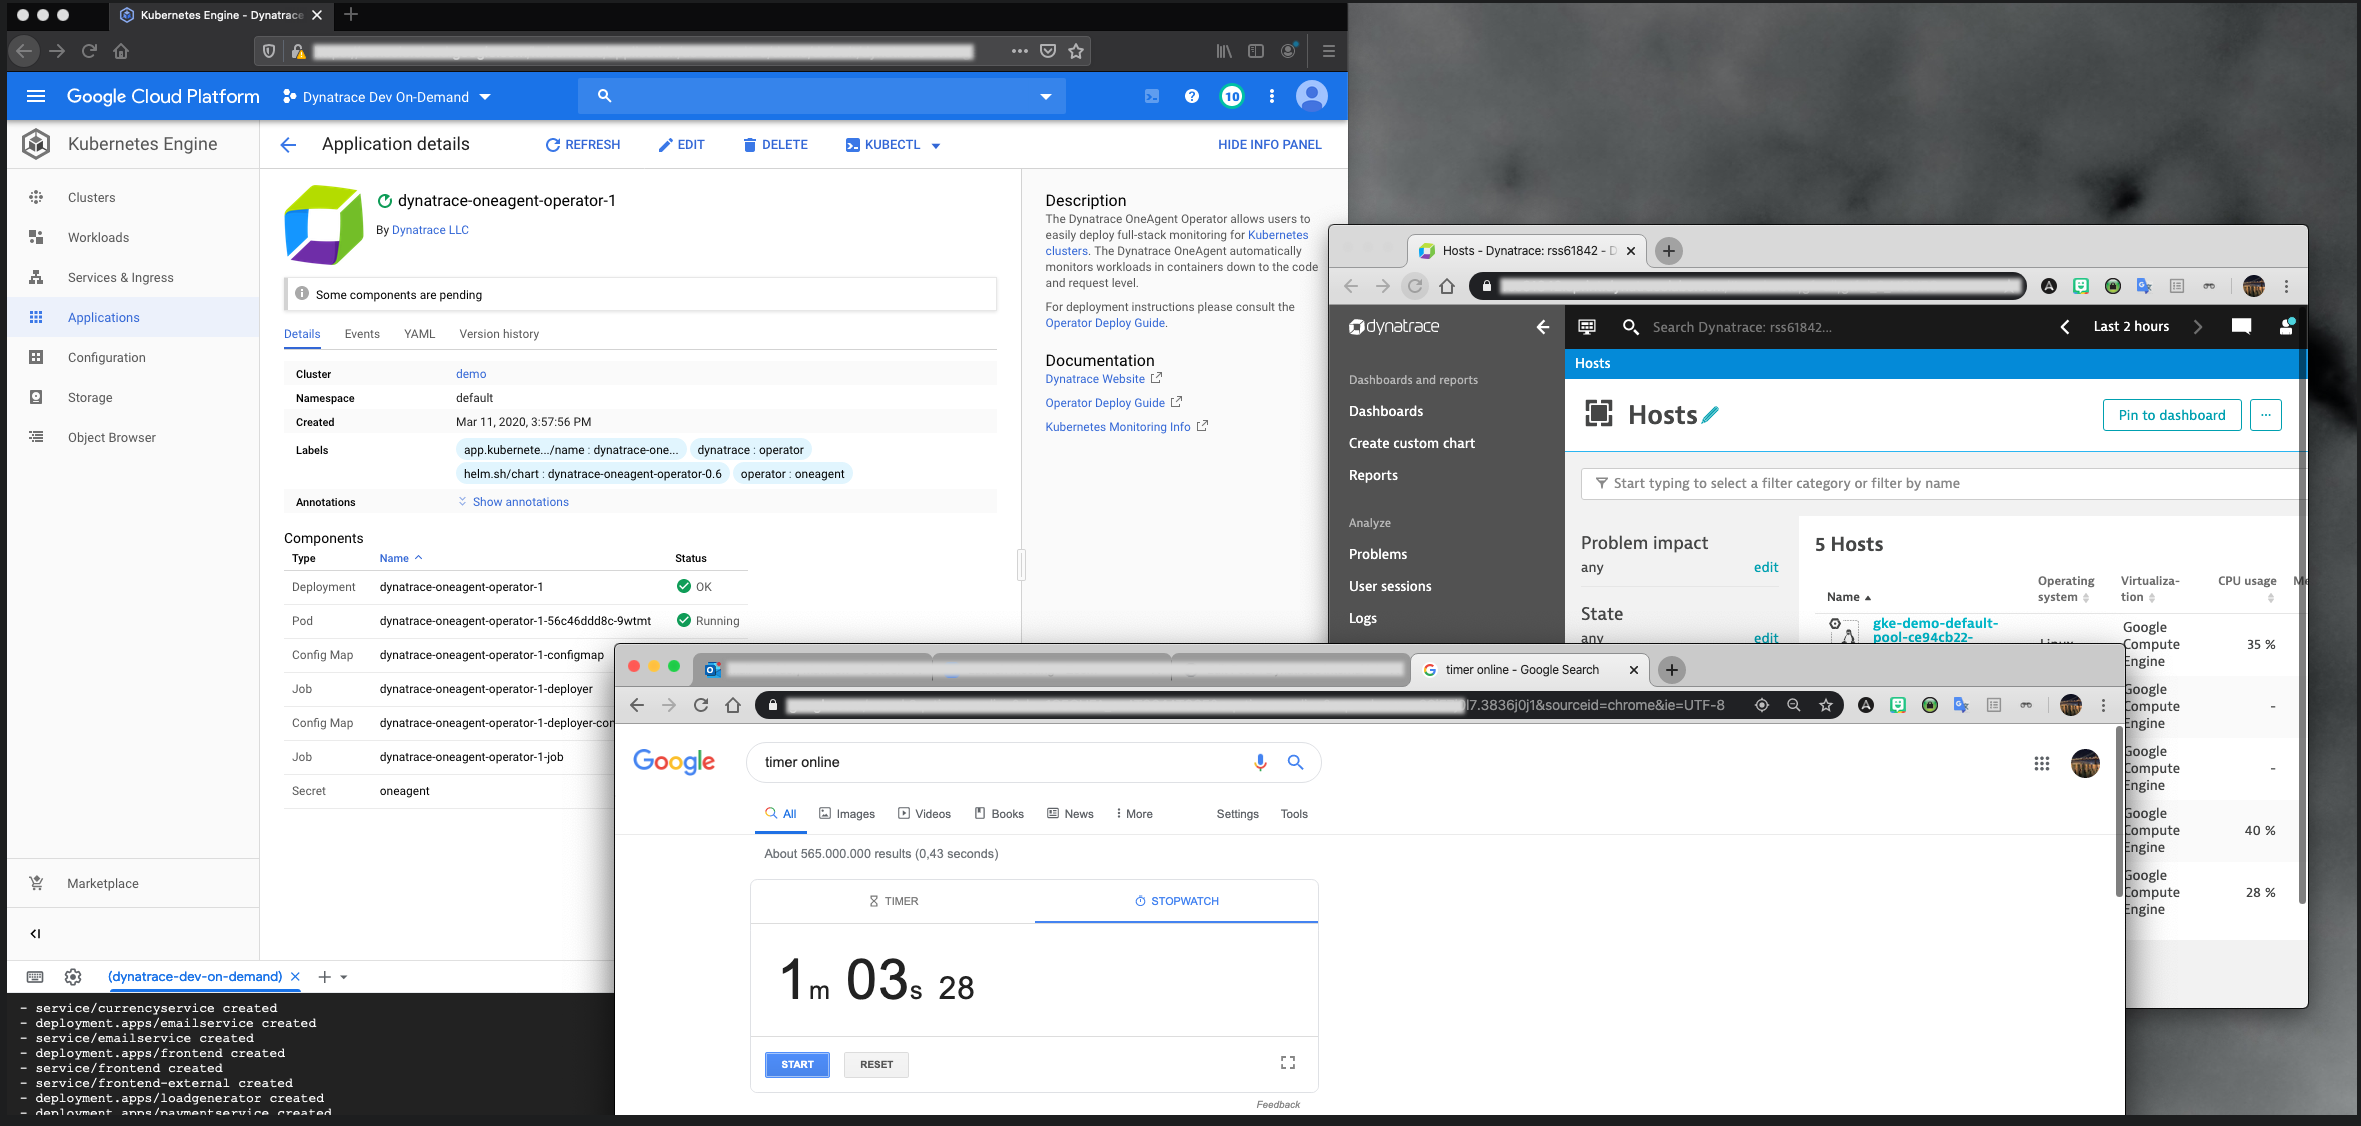
I gave an early glimpse of the Google integration last month at our annual Perform user conference in Las Vegas. Customers were impressed at how fast it deployed. In front of an audience, I started a timer to measure the deployment time. You can see the timer (showing 1 minute and 3 seconds), the OneAgent rollout, and the Kubernetes node metrics flowing into Dynatrace in the screenshot below.

Achieve comprehensive observability on GKE using OneAgent alone
Unrivaled Dynatrace lifecycle management satisfies the first observability requirement of Super Bowl-scale growth patterns. The second requirement is to gain comprehensive observability without an engineering burden. This is exactly what you get with Dynatrace (and, notably, on GKE). Again, let’s take a look at tracing to highlight this point.
Despite plenty of buzz in the industry around tracing, things haven’t changed much in the decade since my team was forced to stitch calls together in an attempt to model capacity plans around performance. Without Dynatrace service discovery and auto-injection, tracing wouldn’t work without engineering involvement, which is expensive and time-consuming. It’s also unnecessary with our best-in-class distributed tracing.
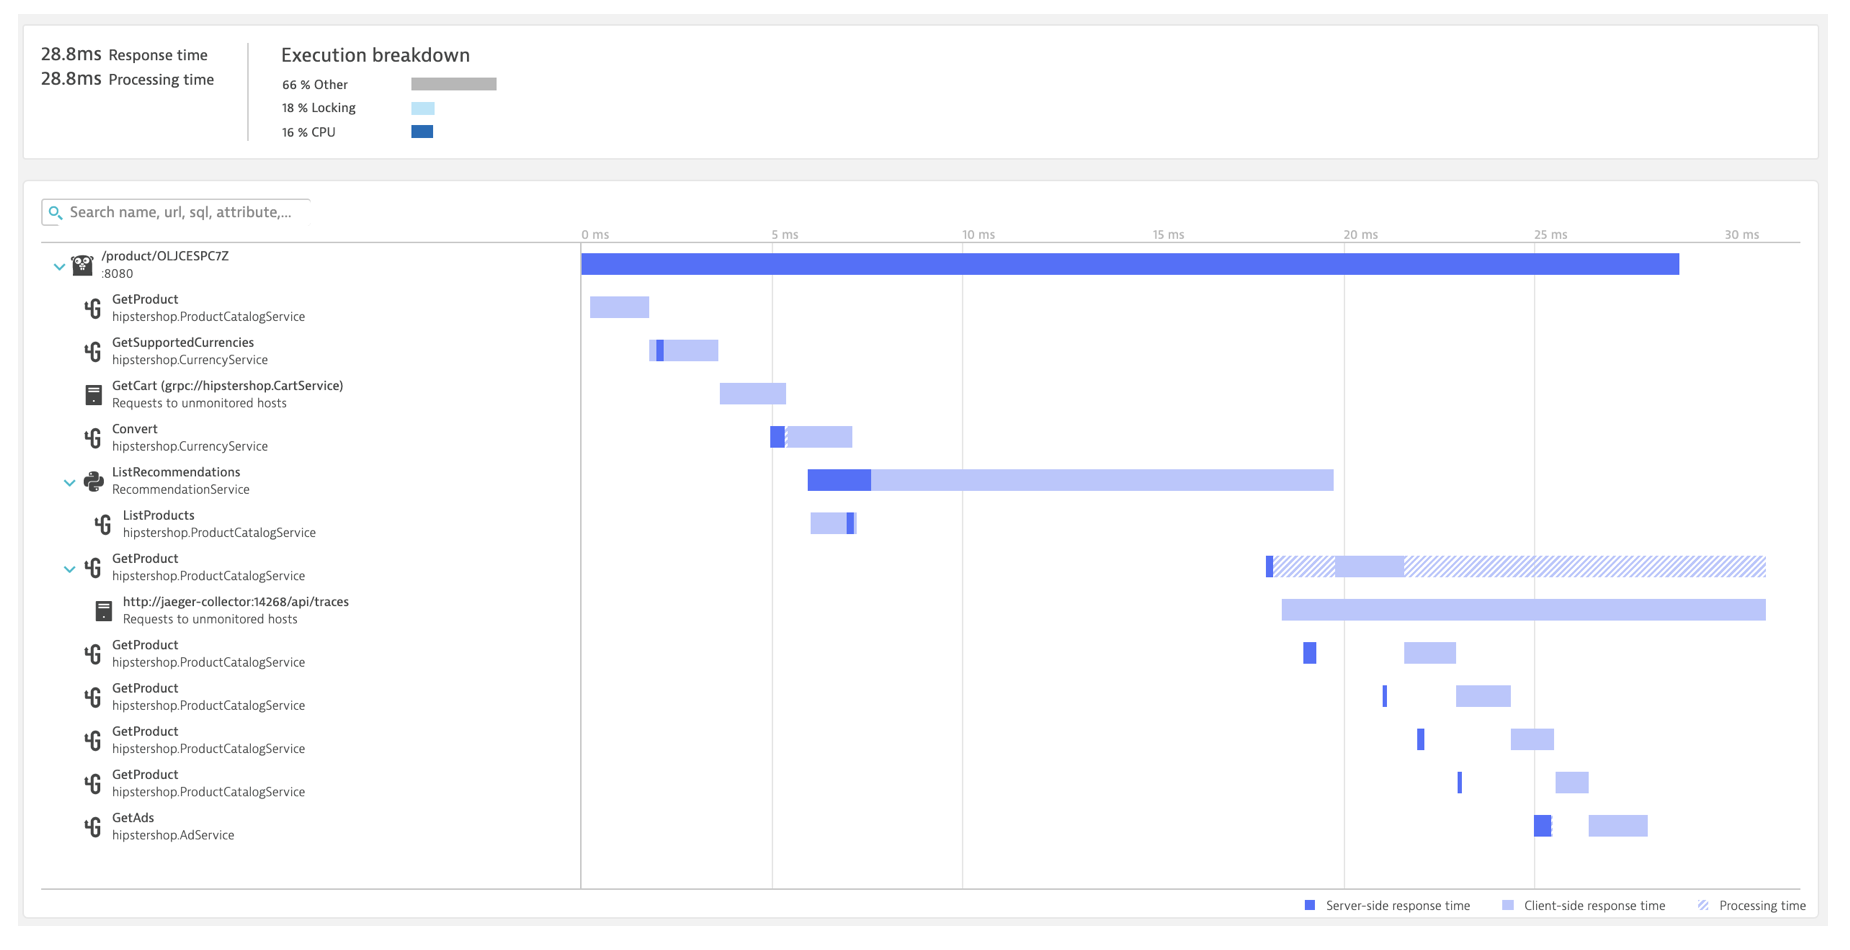
Take a look at the GKE cluster I instrumented in Las Vegas to see how tracing works without any special code commits.
The screenshot above shows Dynatrace PurePath view of “Hipster Shop,” the Google sample application. The tracing data starts at the top, with a 28ms response time from the product service. As you look down the page, you can see the results of our distributed trace, showing service calls that comprised the total execution time broken out into separate segments. The distributed trace data shows the longest execution time in a service called ListRecommendations
We can also see the frequency with which any given service is called. For instance, the GetProduct microservice is called a handful of times in a row, which suggests that there should be a higher level of throughput allocated as we plan growth. I can also drill into the service and look at the code-level method calls, with an eye on the amount of time waiting for CPU, or responses from other services.
Achieving these levels of observability in a Kubernetes environment requires zero developer intervention, and no additional software beyond Dynatrace OneAgent technology.
Get started with Dynatrace on GKE today!
Nothing stands in your way of testing the new Dynatrace GKE integration and gaining industry-leading observability on Google Cloud. Ready to try it out for yourself? Get started by opening your GCP console and accessing the Dynatrace marketplace integration.


Looking for answers?
Start a new discussion or ask for help in our Q&A forum.
Go to forum