
One of the greatest joys in building and releasing products is seeing them working for the first time in production, a customer demo, or a user's hands. And if you love the product you’re working on, this feeling doesn’t disappear after the second, tenth, or even hundredth time.
Working with customers brings its own joys, often unexpected ones. At Dynatrace, we’re amazed by the creative and unexpected ways our customers use our platform.
We recently announced Dynatrace Live Debugger, which gives developers unprecedented access to real-time data and runtime behavior insights. This powerful tool can be leveraged across various environments, including production, to enhance development processes and ensure robust application performance. Following are some of the coolest things we’ve seen engineers do with Live Debugger.
White box testing
The nicest thing about deploying UI changes to production is that you can immediately see the changes in action. You can see when a new version is deployed, test it to ensure everything works as expected, and you’re done.
On the other hand, deploying new code on the backend is complex and offers no such transparency. How can you tell if an algorithm or data source changed or a new feature flag worked?
Many developers attempt to mitigate this challenge with logs, but that’s a tedious and error-prone process. Not to mention, if logs are missing, you’ll have to deploy your applications and services all over again.
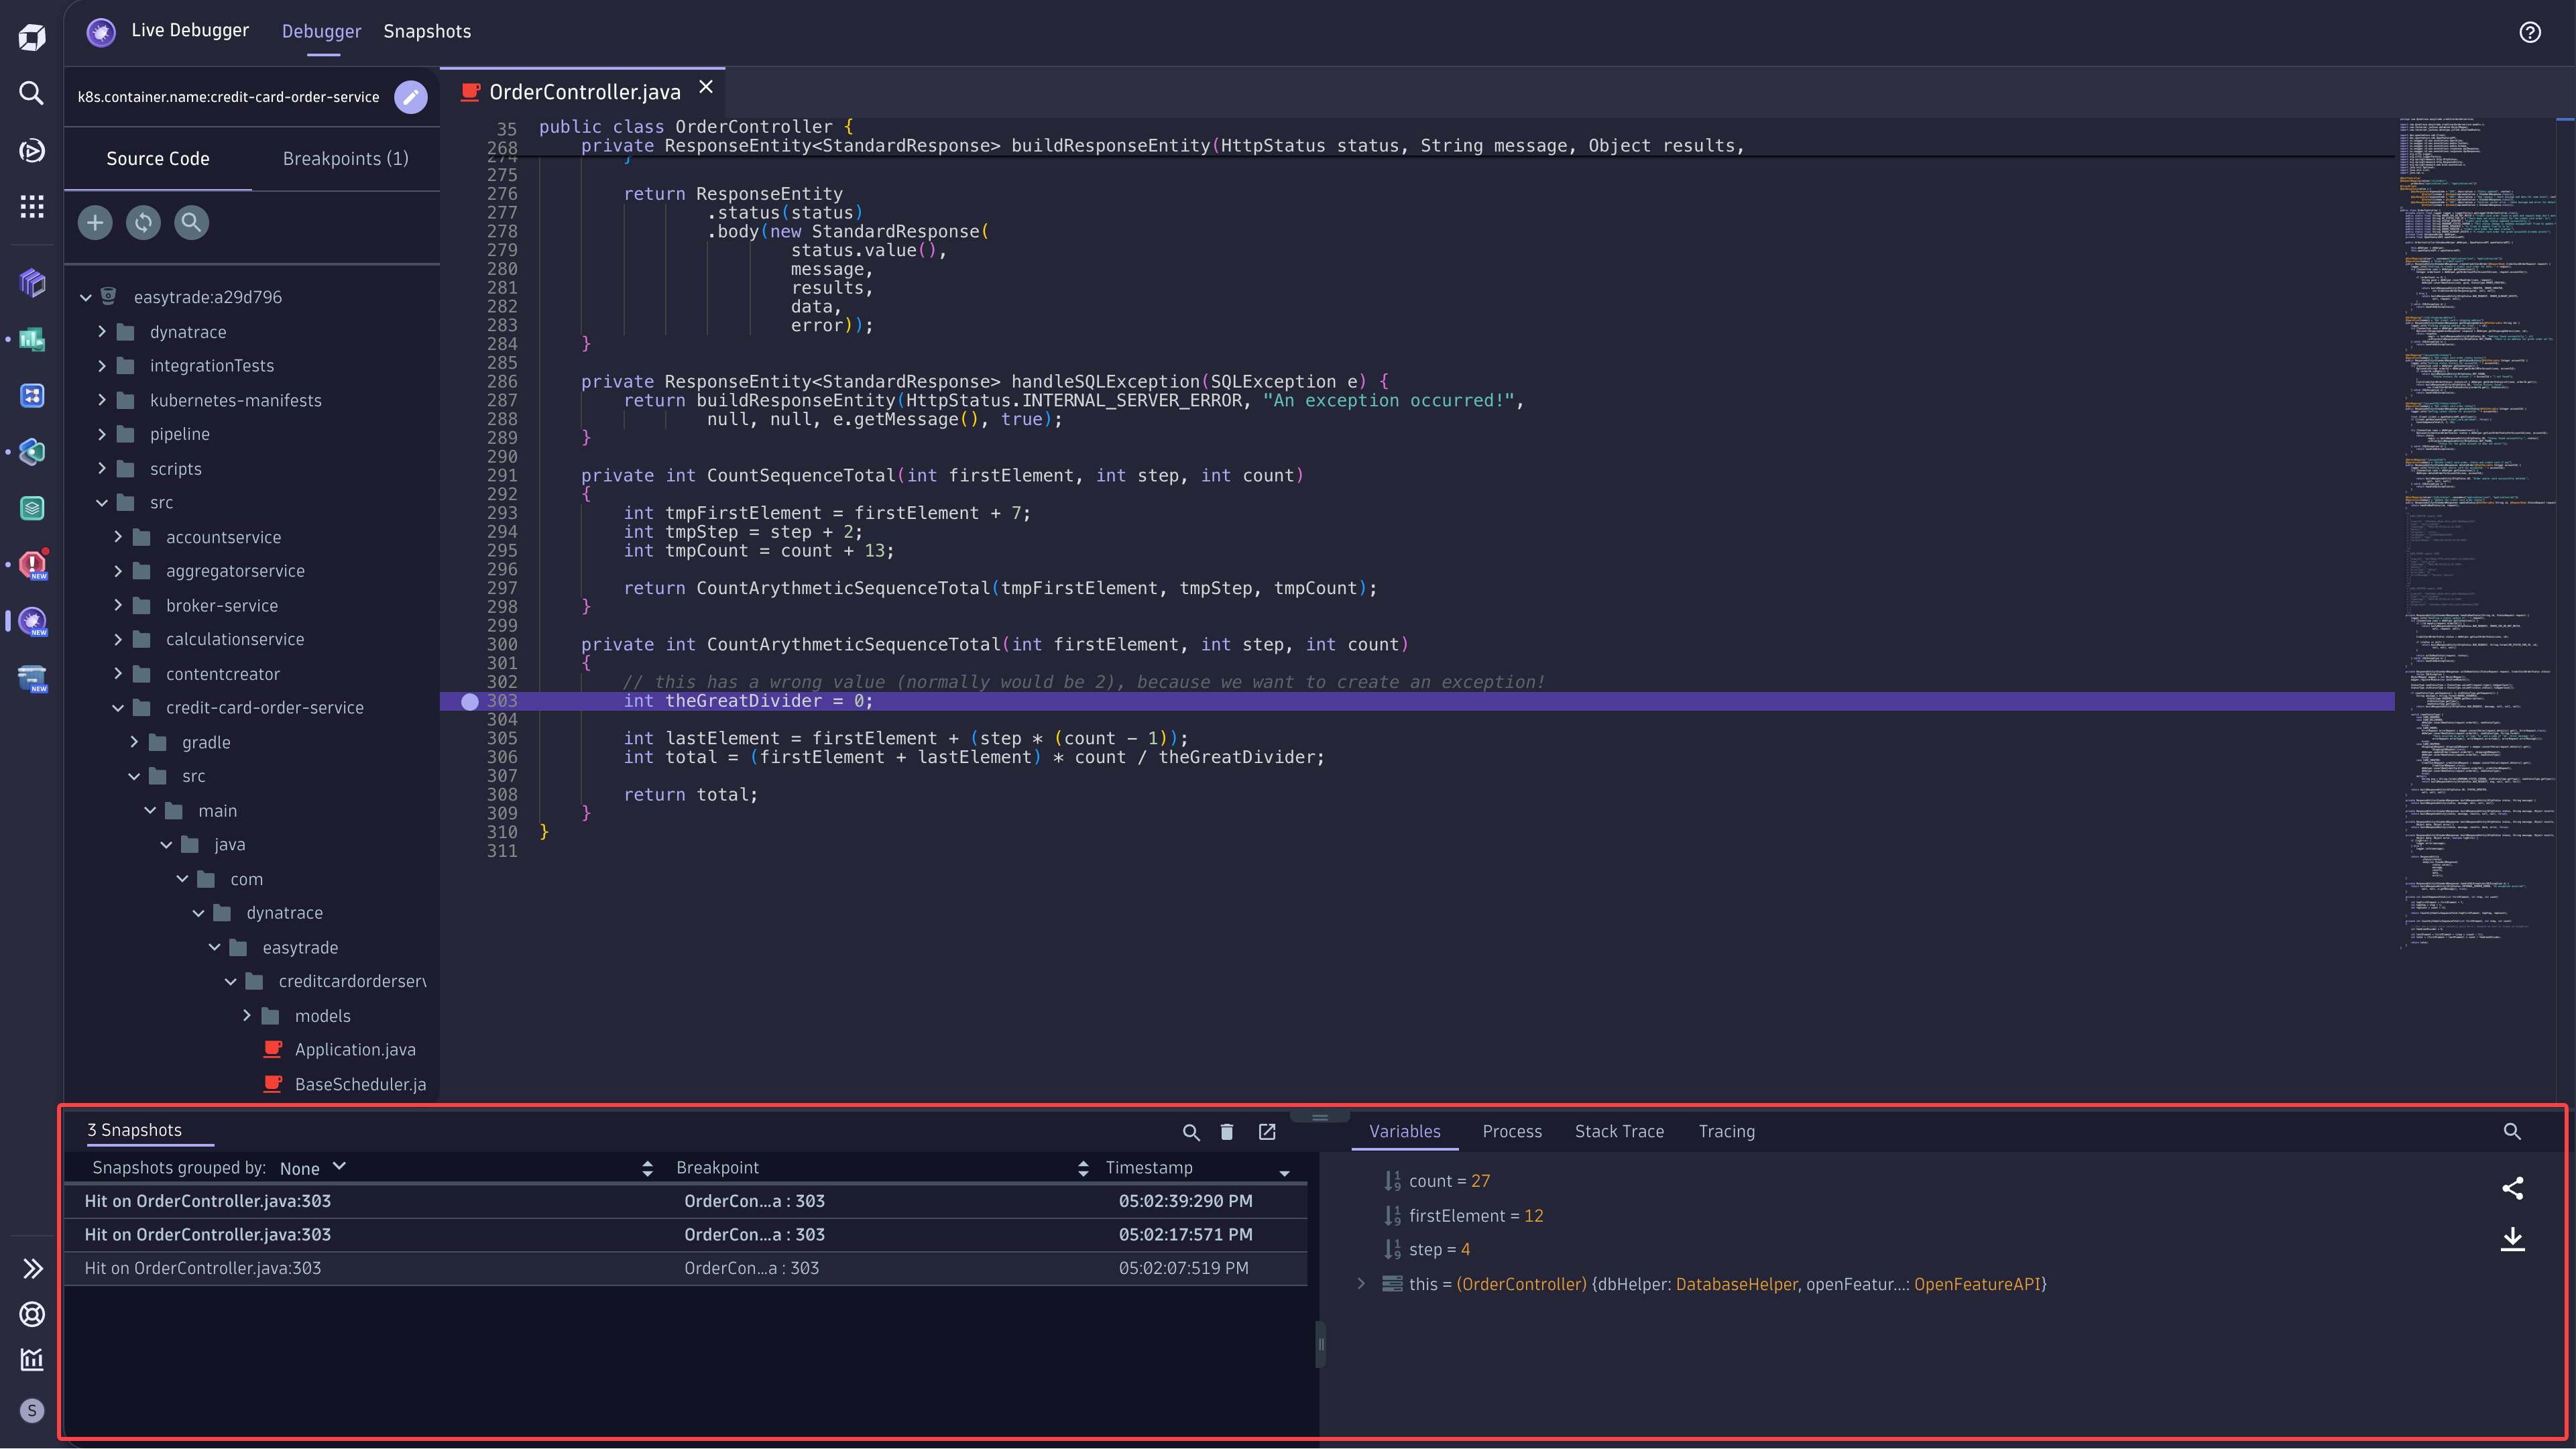
With Dynatrace Live Debugger, you can set a non-breaking breakpoint and instantly see if new code is following the intended new paths, if any new arguments are being considered, and if input and output arguments are aligned with expectations. This way, even if reality collides with your expectations, you have a trace ID, debug-level logs, and a real-time snapshot to guide you.
Test data collection
Accurate test data can mean life or death. After all, how useful can it be if you just make up test data in your integrated development environment (IDE) with no thought to what’s out there in the real world?
Even a naive data type such as a string can have endless variations in length, encoding, locale, character type, and more. Lists, arrays, and objects naturally cause more trouble. Worst of all, your functions might receive unexpected data types.
With Live Debugger, you can see the precise inputs your code calls in production so you can design your tests accordingly. You can verify any system settings that might impact your tests and see them in action.
Performance benchmarking
Performance benchmarking is one of the unresolved mysteries of software engineering. In many ways, it’s more of an art than a science.
Sometimes, you need heavyweight tools. Load generators simulate traffic. Distributed tracing shows transactions end-to-end. Memory and CPU profiling are there to help you find the “needle in the haystack.”
But, sometimes, you need to easily measure how long it takes to get from point A to point B. Maybe you want to focus on a specific service, endpoint, user, or use case. Maybe you want to monitor performance under different system loads. Or maybe you want to correlate an event with other events in your system.
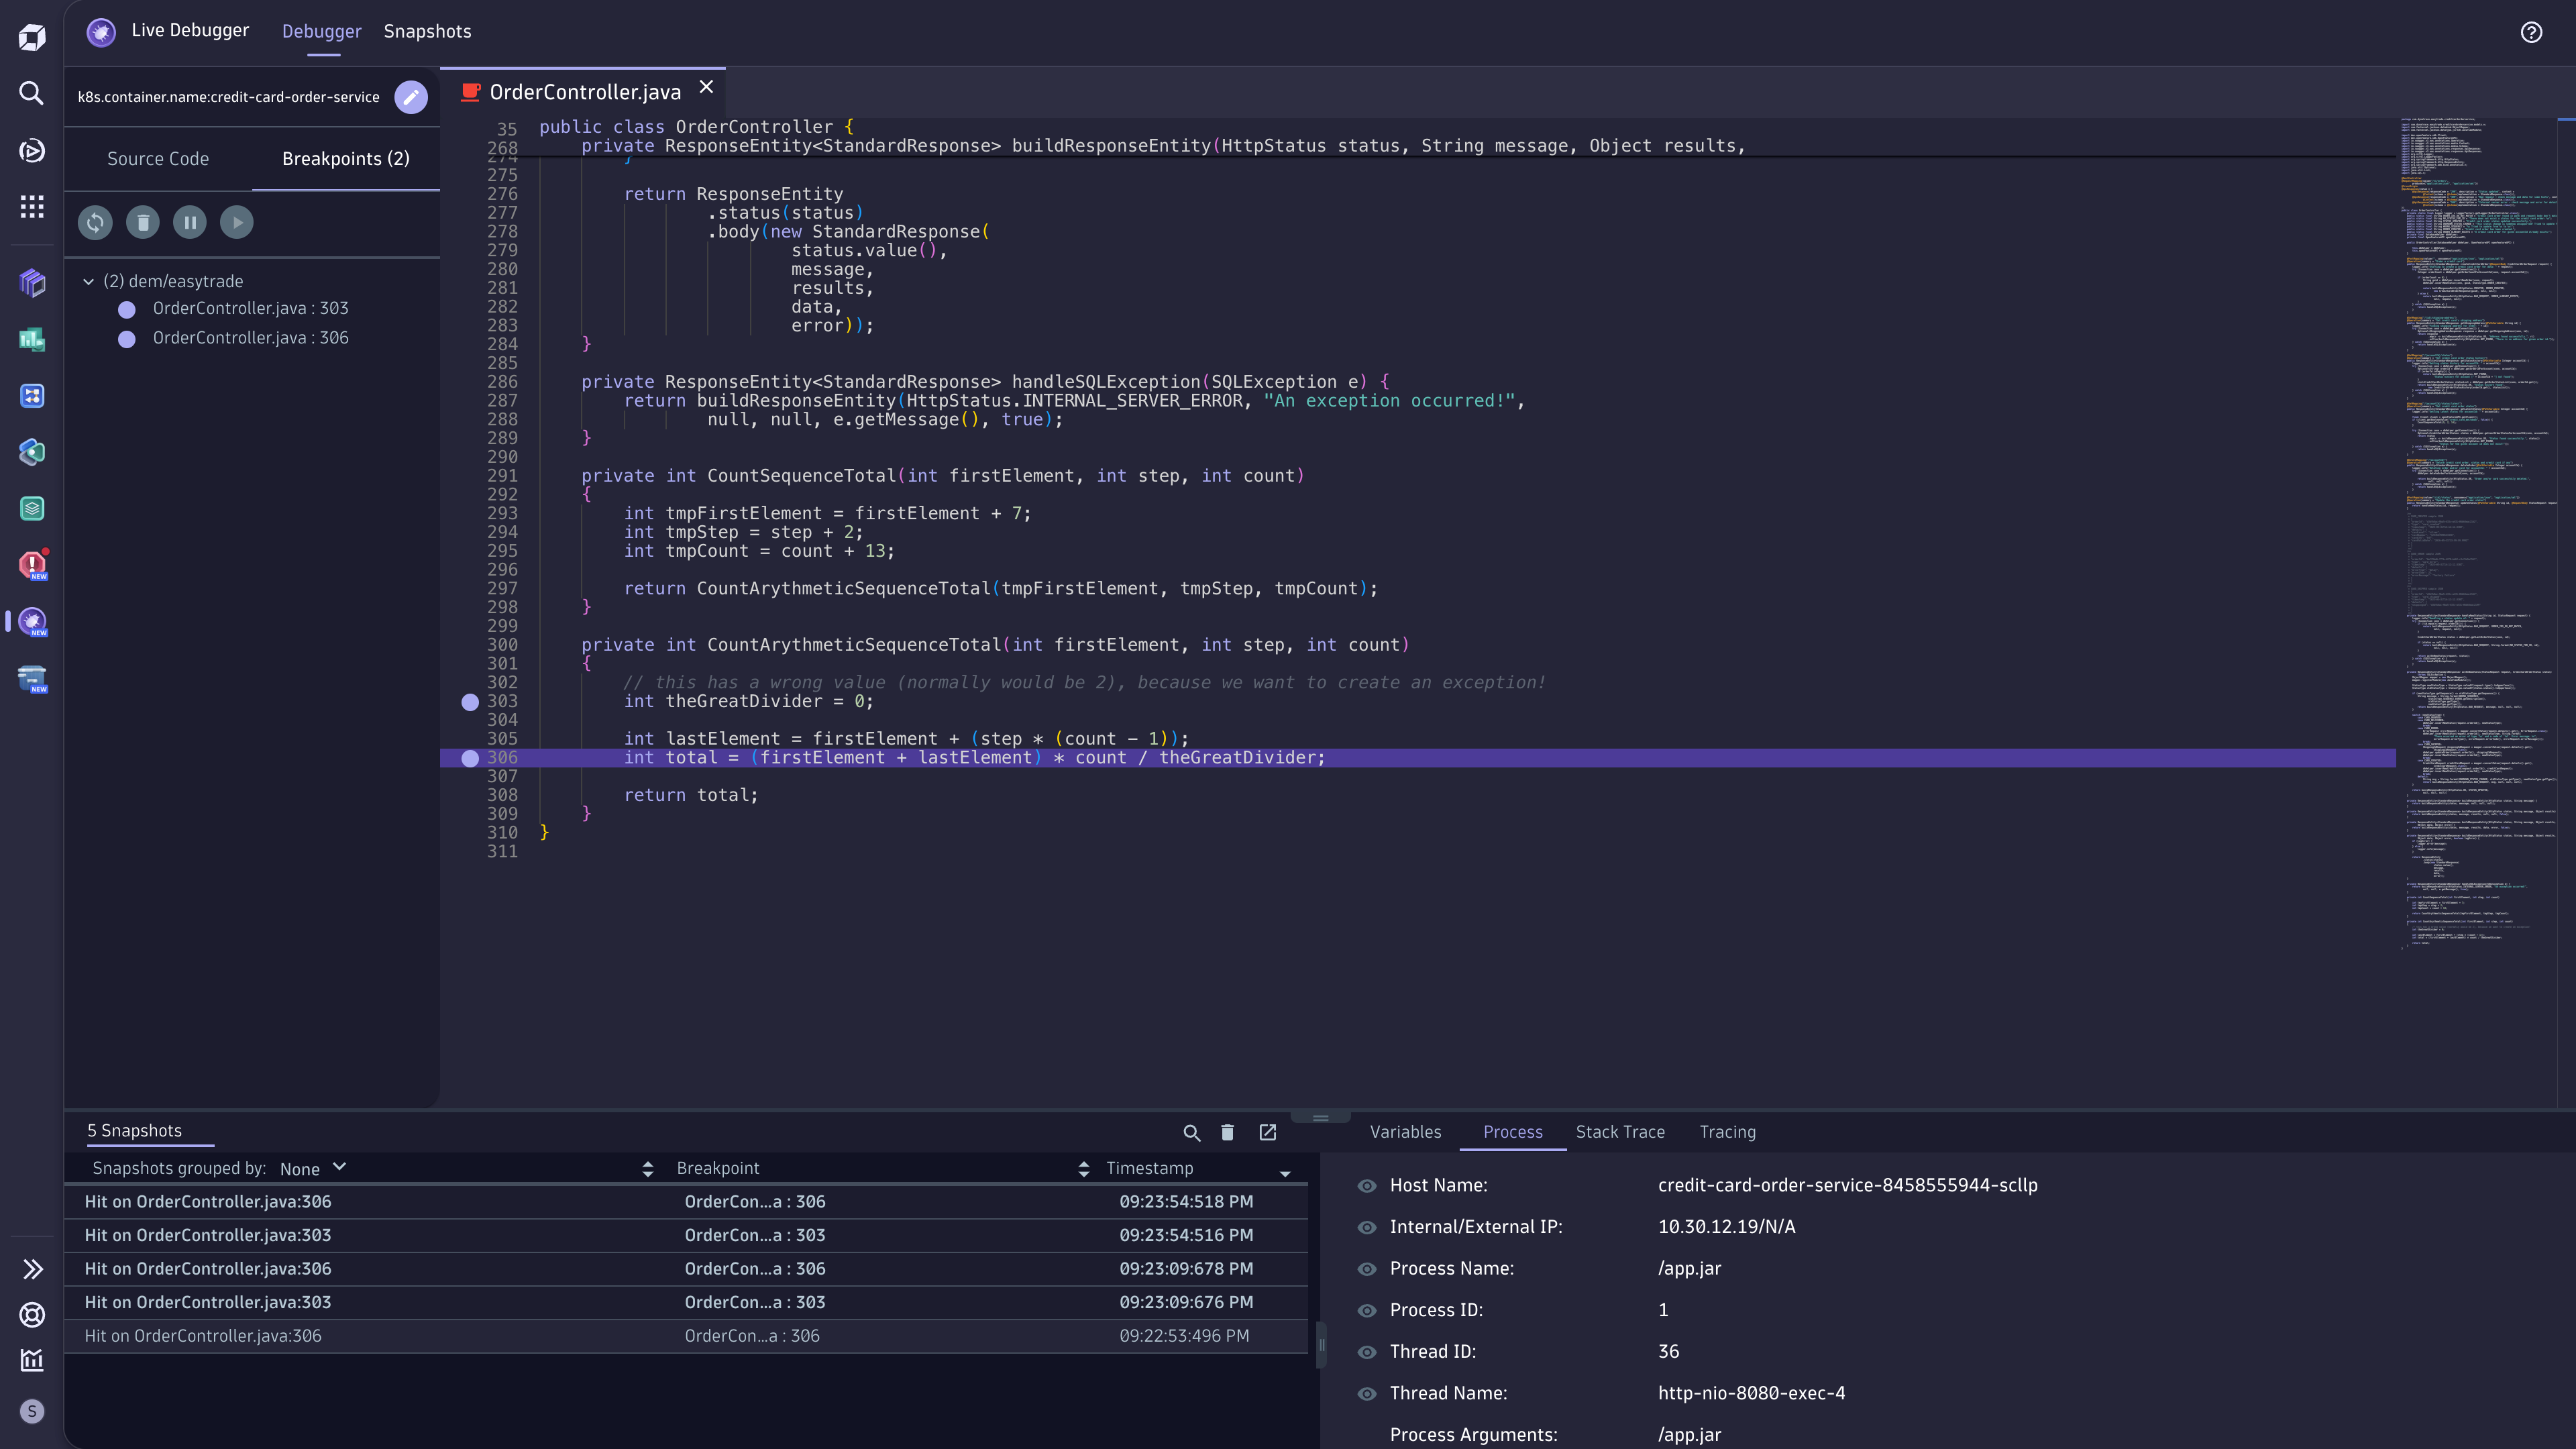
Either way, Live Debugger allows developers to place two breakpoints and measure the time between those two invocations. This allows dynamic techniques like binary search to pinpoint the exact line of problematic code, facilitating more precise performance benchmarking.
Dead code detection
Did you ever look at a function and wonder if it was ever even called? Have you ever wished to see a pesky little log line that could tell you for certain if a certain function was used? Well, wish no more!
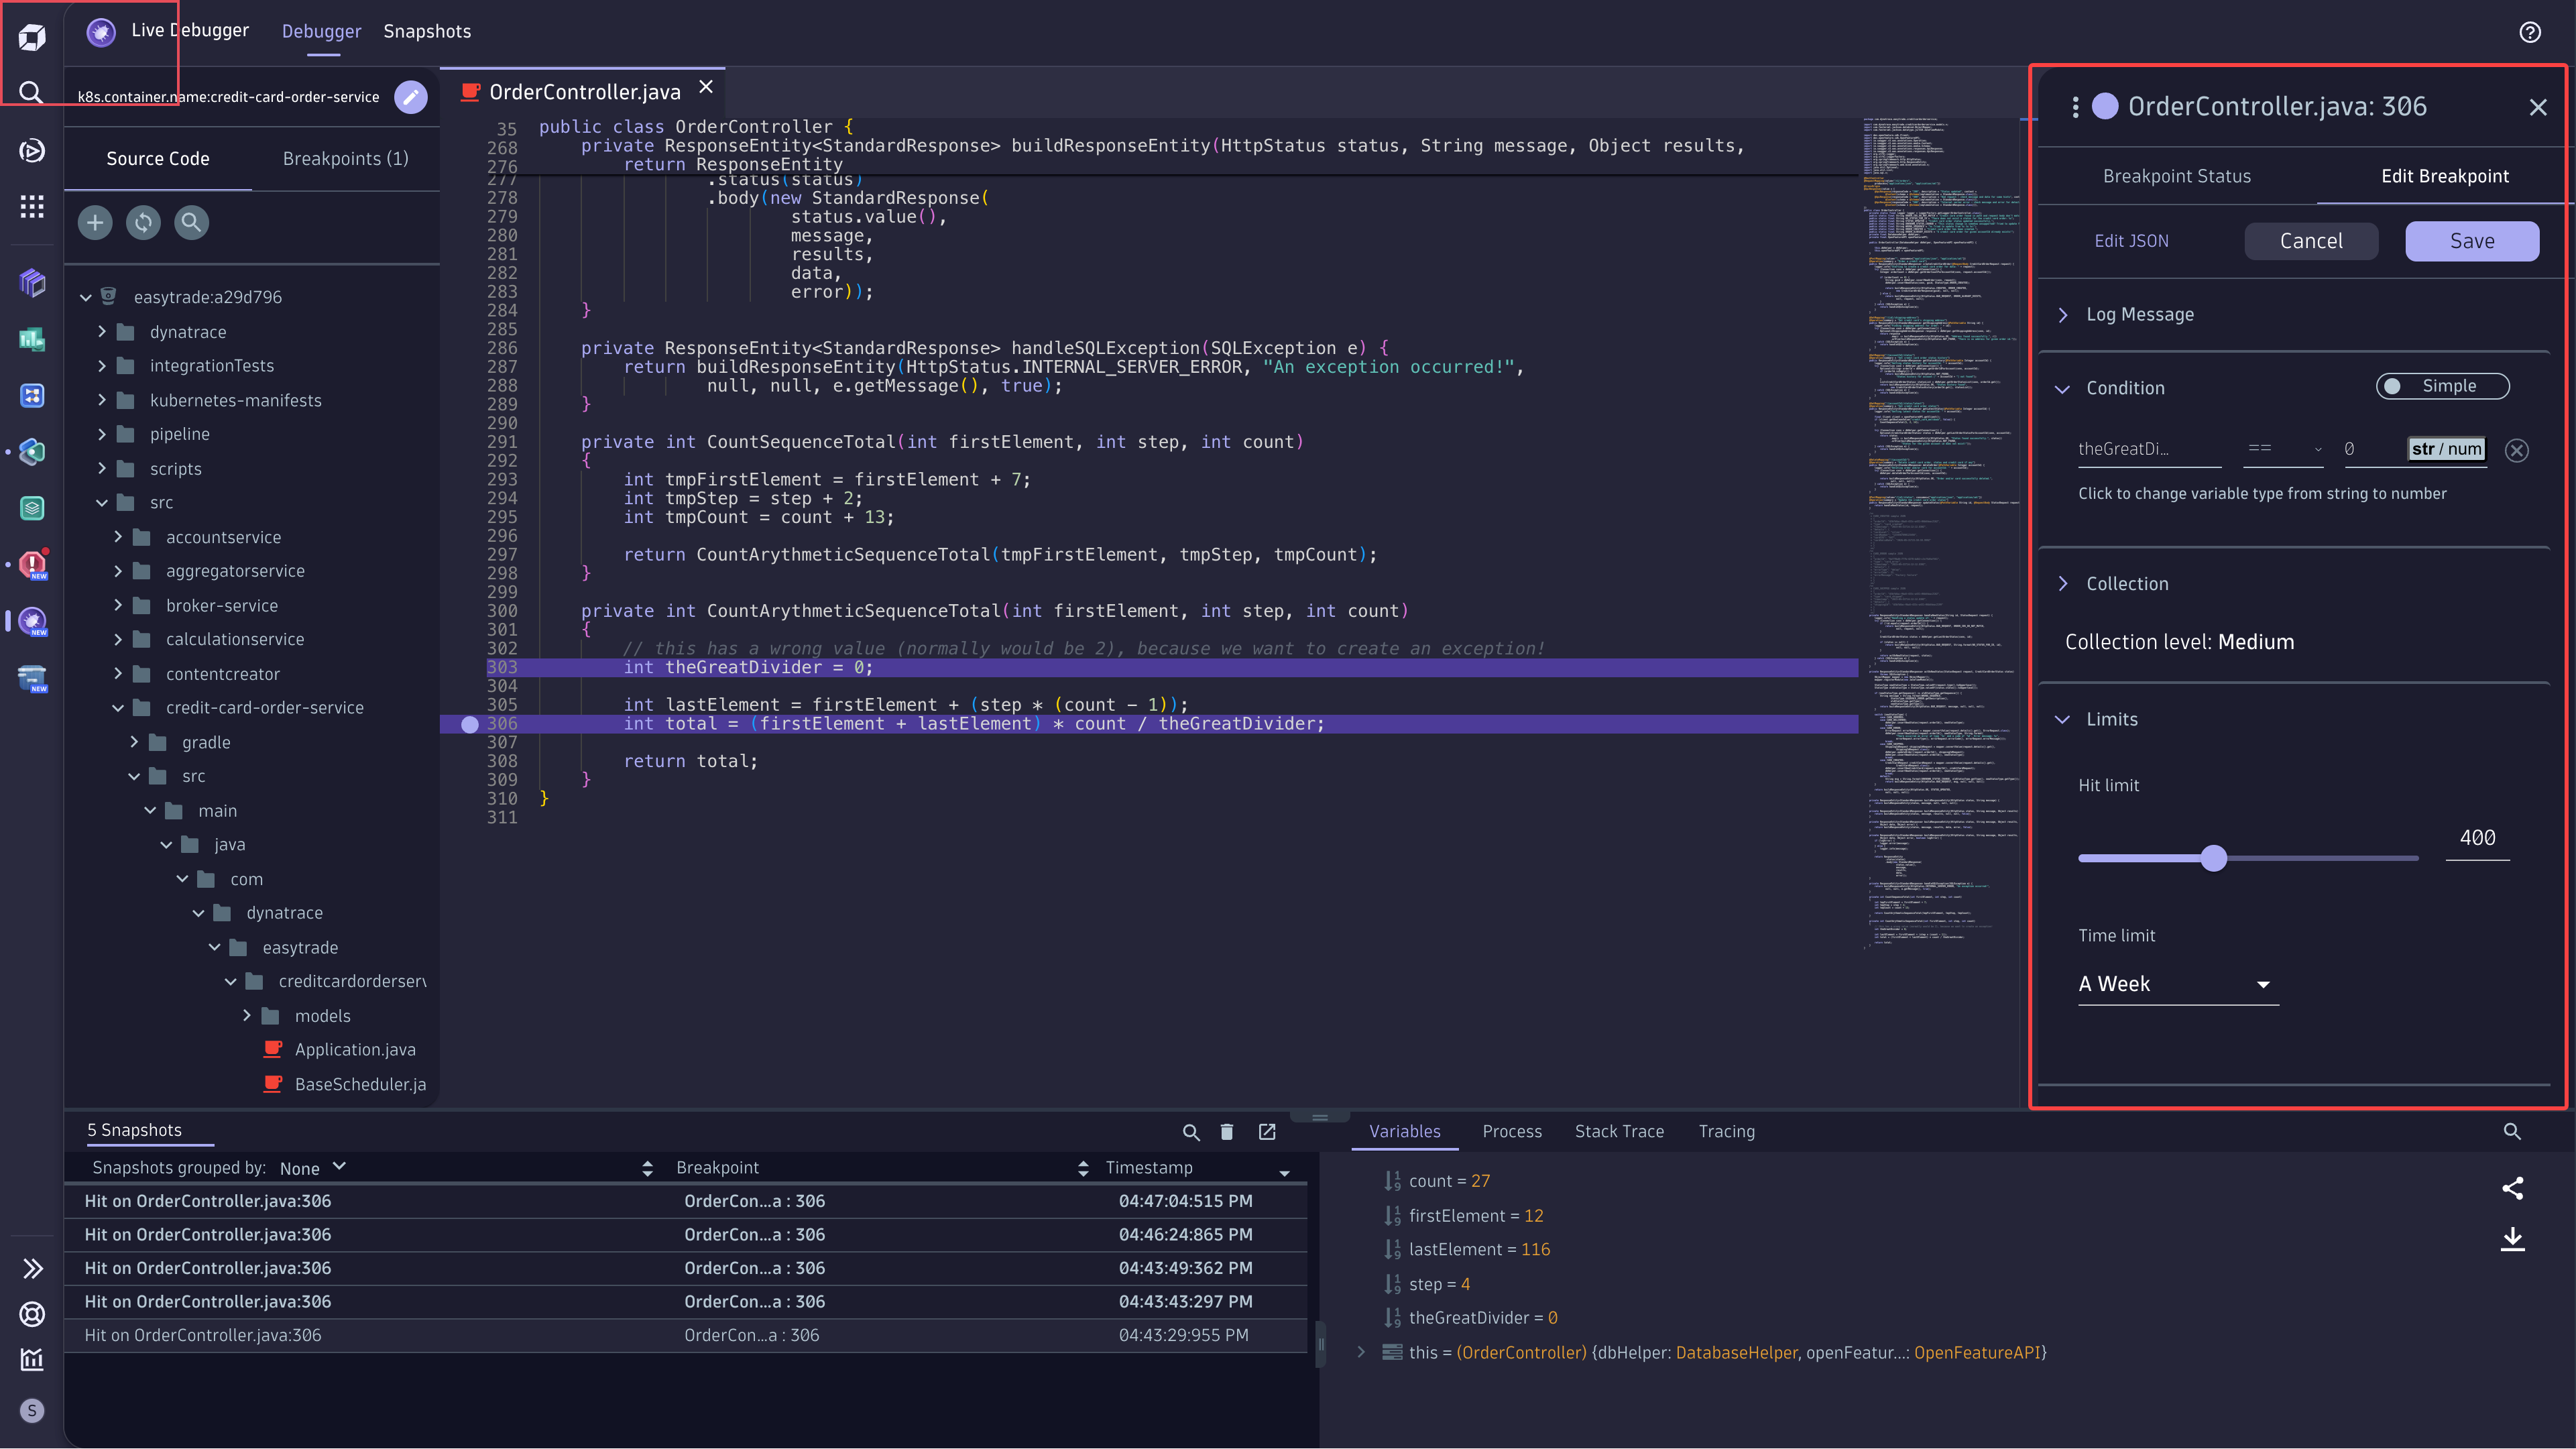
With one click, you can set a non-breaking breakpoint on a function, come back in a week, take a look, and see if and by whom the function was called.
You can even take it up a notch; set the breakpoint within a specific branch to test whether a condition is true or false. Set a conditional breakpoint to check if that argument is ever in use, gets a specific value, or goes beyond a certain range and size.
Learn the code
How often do you dive into a code you don’t understand? Maybe the code was written a month or a decade ago. It might have been written by your predecessor, a different team, or some new GenAI tool. Sometimes, you just have the pleasure of deciphering someone else’s “spaghetti” code.
Knowing where to start and how to follow code can be a considerable challenge, especially in modern, dynamic languages. Debugging step-by-step in your IDE often won’t get you far, especially when executing the code locally is not easy. Live Debugger allows you to follow code execution in real time, in real environments.
See which function calls which piece of code, what real values are processed, and how the code forms specific behaviors and outputs.
Troubleshooting and debugging
Not surprisingly, most of our customers use Live Debugger for a more obvious use case: troubleshooting and debugging their code.
Modern software practices are notorious for making code extremely hard to debug. The reasons for this are many.
- Cloud-native services are challenging to execute locally.
- Distributed services involve multiple processes and runtimes.
- Legacy servers pick up complexity and dependencies over time.
- Compliance and security prohibit ease of access in highly restricted environments.
However, even easier-to-debug services often come with impossible-to-reproduce troubleshooting issues, including:
- Behaviors involving the (distributed) application state.
- Bugs resulting from obscure and unexpected inputs.
- Flaws resulting from (mis)behaviors in open source and third-party dependencies.
- Defects occur only in certain stages or deployments.
Having Live Debugger is about having a production-grade tool to investigate your code. It’s a tool you can use in any environment or architecture, instantly showing you the innermost workings of your code wherever and whenever you need it.
Get started
Dynatrace Live Debugger and its Visual Studio Code and JetBrains plug-ins are now available for all Dynatrace SaaS customers with a Dynatrace Platform Subscription.
For more information, please see our recent Live Debugger announcement blog post and related press release.


Looking for answers?
Start a new discussion or ask for help in our Q&A forum.
Go to forum