Yesterday we completely refreshed and relaunched our website. I’m in Asia this week, so I woke up early to check everything was OK overnight.
This blog is a simple overview of what I looked at, step by step, as I drank my morning coffee. I’m not in the development team, I’m just one of the stakeholders who cares deeply about our website performance. In just 10 minutes I am reassured that everything looks good with our new website.
-
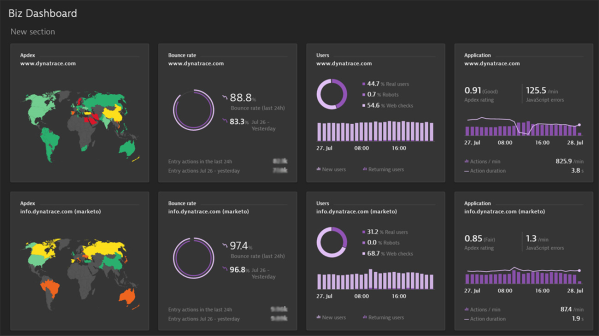
6:05am: Business dashboard overview for the past 24 hours.
Everything is looking good across our Dynatrace.com website as well as our Marketo instance.
- Digital experience across geographies (top left) are mostly green which is means users are satisfied.
- Bounce rate is higher than I’d like but we do have 54.6% of our traffic as web checks which pushes our bounce rate up considerably.
I do notice a response time spike which is the tab on the far right, but it seems to have corrected itself.
-
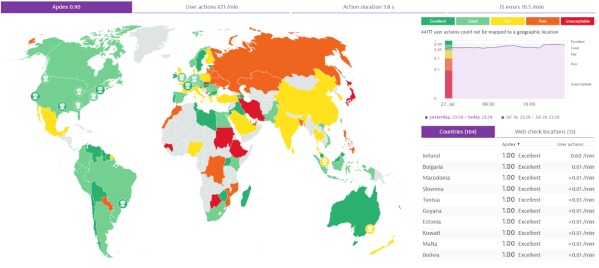
6:06am: Geographical digital experience looks good.
My favourite view is the geographical digital experience overview. Everything here is looking good. What’s most exciting is that China is showing a ‘fair’ user experience.
Note: It wouldn’t have been surprising if China was glowing red given we made such dramatic changes to our site. The technical regulations and complexities in that country make it hard to launch new applications that perform perfectly well straight off the bat.
A few things to dig into in Eastern Europe but average response time at 3.8 seconds means I can sip my coffee, relaxed in the knowledge we are looking good today.
-
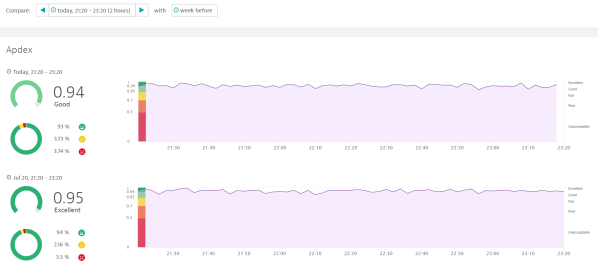
6:07am: Digital experience comparison of 24 hours prior to last week.
Thought I might check our digital experience of the past 24 hours against last week. It can be useful to look at it in a quick, historical context to see whether the new site is causing any new-found issues.
Our digital experience is nicely consistent. No issues here.
-
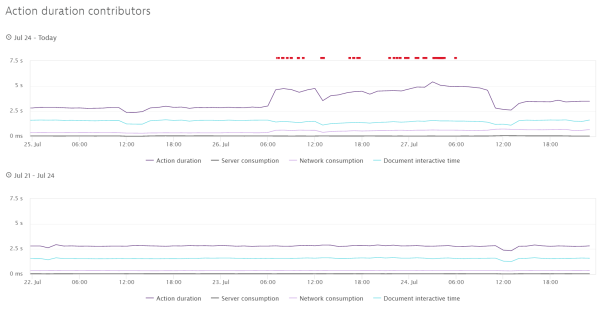
6:08am: Response time showed some minor degradation.
Coming back to the response time spike, a little digging shows that it was fairly minor degradation from 2.5 seconds out to 4 seconds. A quick 72-hour analysis and I can see the issue occurred just prior to switching the site live.
I notice that the system has already logged some alerts about this, but they’ve been closed now. Guessing either it resolved itself or maybe our team implemented some simple fixes.
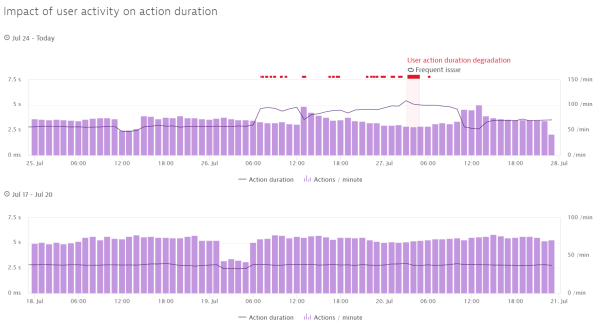
Just below this graph in our dashboard I can the issue is not related to the server and network. Must be a front end issue, which I’ll look at in a minute.
-
6:09am: Check the replay of the problem
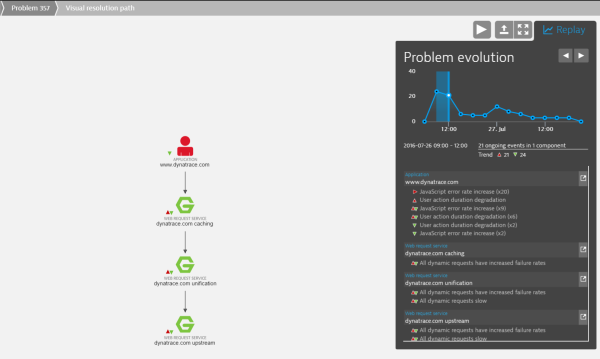
Given the system logged an error at the time, I can open the problem and replay it. (If only I could replay some things I’ve done or said in real life…)
Probably not unusual that we had some caching failure rates but I see we had some JavaScript issues. They are gone now, but I’m keen to dig a little further on them.
-
6:12am: Checking the JavaScript issues
With one click I’m now reviewing the JavaScript errors. Really I shouldn’t be, I’m not massively technical, and it’s not my job. But I want to know what happened and, frankly, the workflow and insights in our dashboard make it so simple to understand what’s transpired.
You can see below there was a 6-hour period where we suffered an increase in errors, which is right when we put the site live.
Footnote to this – An increase in errors is less than ideal, however it’s not uncommon when you’re under strict deadlines to get a site live. What’s important is that it was rectified extremely quickly which is a credit to the team deploying this site.

Back to the JavaScript issues – let’s see what they were:
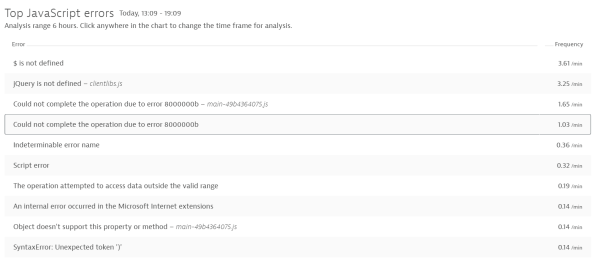
I then click into a specific error to see:
- What the actual problem is
- Which pages were impacted
- Which browsers were implicated
- And how big of an issue it is.
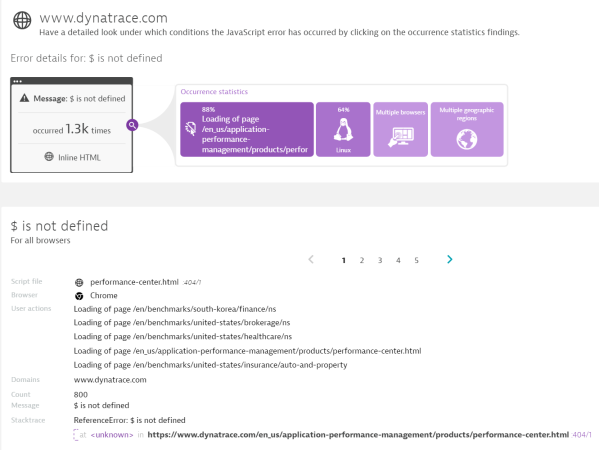
UPDATE: I emailed this blog posting to our web team and they provided the following description of the JavaScript issue and an explanation of how it was resolved:
The increase of JavaScript errors was due to switching the website from HTTP to HTTPS. The jQuery library was being loaded through HTTP so once we launched the new website using HTTPS all references to the jQuery function “$” started breaking. The web development team was quickly able to identify the JS error increase rate and dig deep into the issue with Dynatrace as shown on the screenshot below.
-
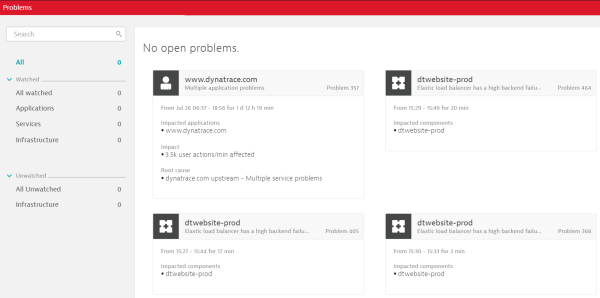
6:14am: Check if we have any open problems
Before heading off to our Perform Day event this morning I check to see if the team has resolved everything. No open problems, no worries.
-
6:15am: Get another coffee.
Time for another coffee and a great event. Well done team and thanks Dynatrace! Now I can get on with my day.


Looking for answers?
Start a new discussion or ask for help in our Q&A forum.
Go to forum