Measuring the reliability of a system can be complex and overwhelming. Indicators that provide insights into an environment’s health and performance vary from industry to industry, product to product, and application to application. Applying service-level objectives (SLOs) to track these indicators is a standard best practice within site reliability engineering. Still, an SLO's quality lies in the relevance of the underlying service-level indicators (SLI).
An at-a-glance view of your system’s health and performance
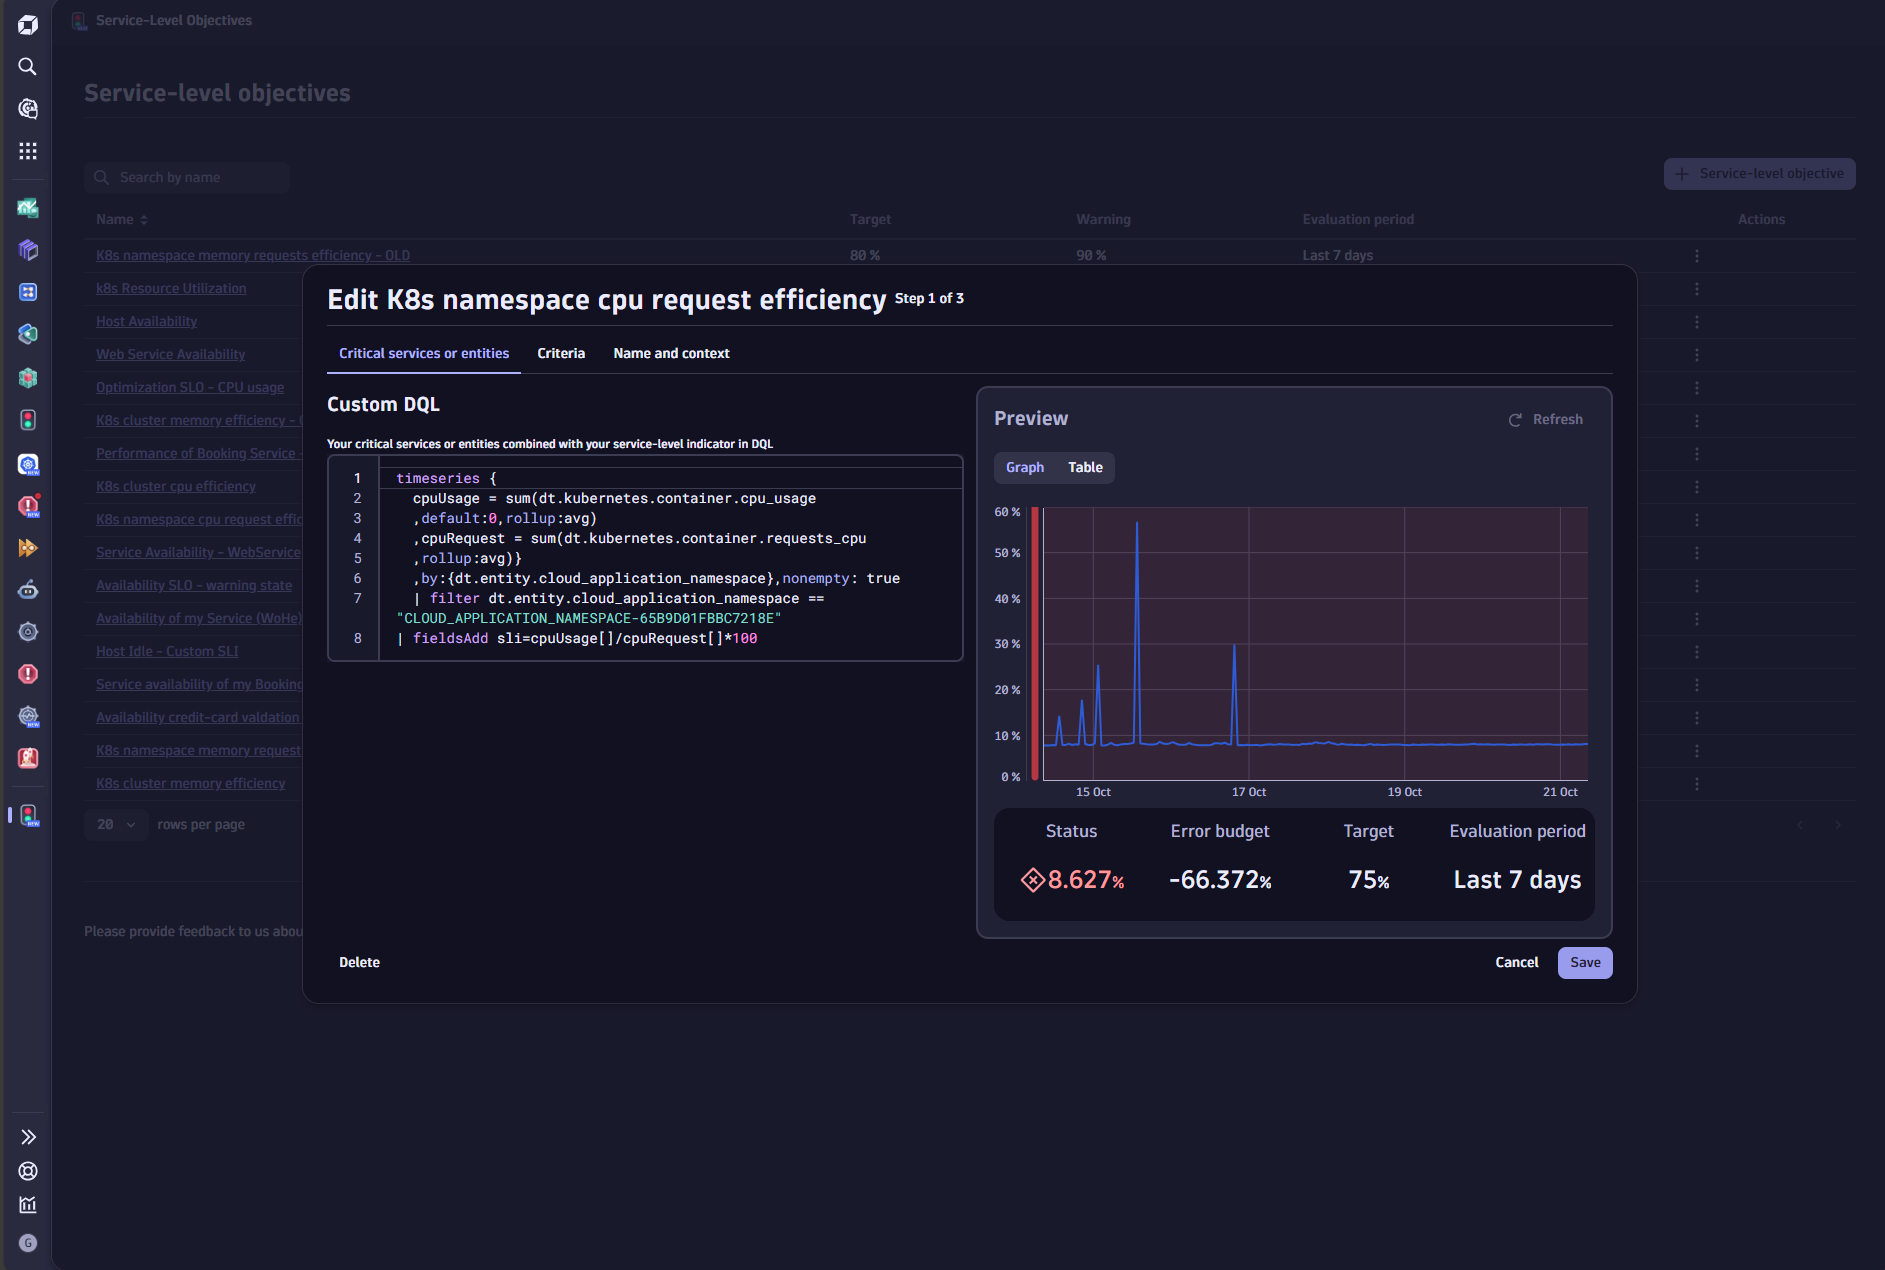
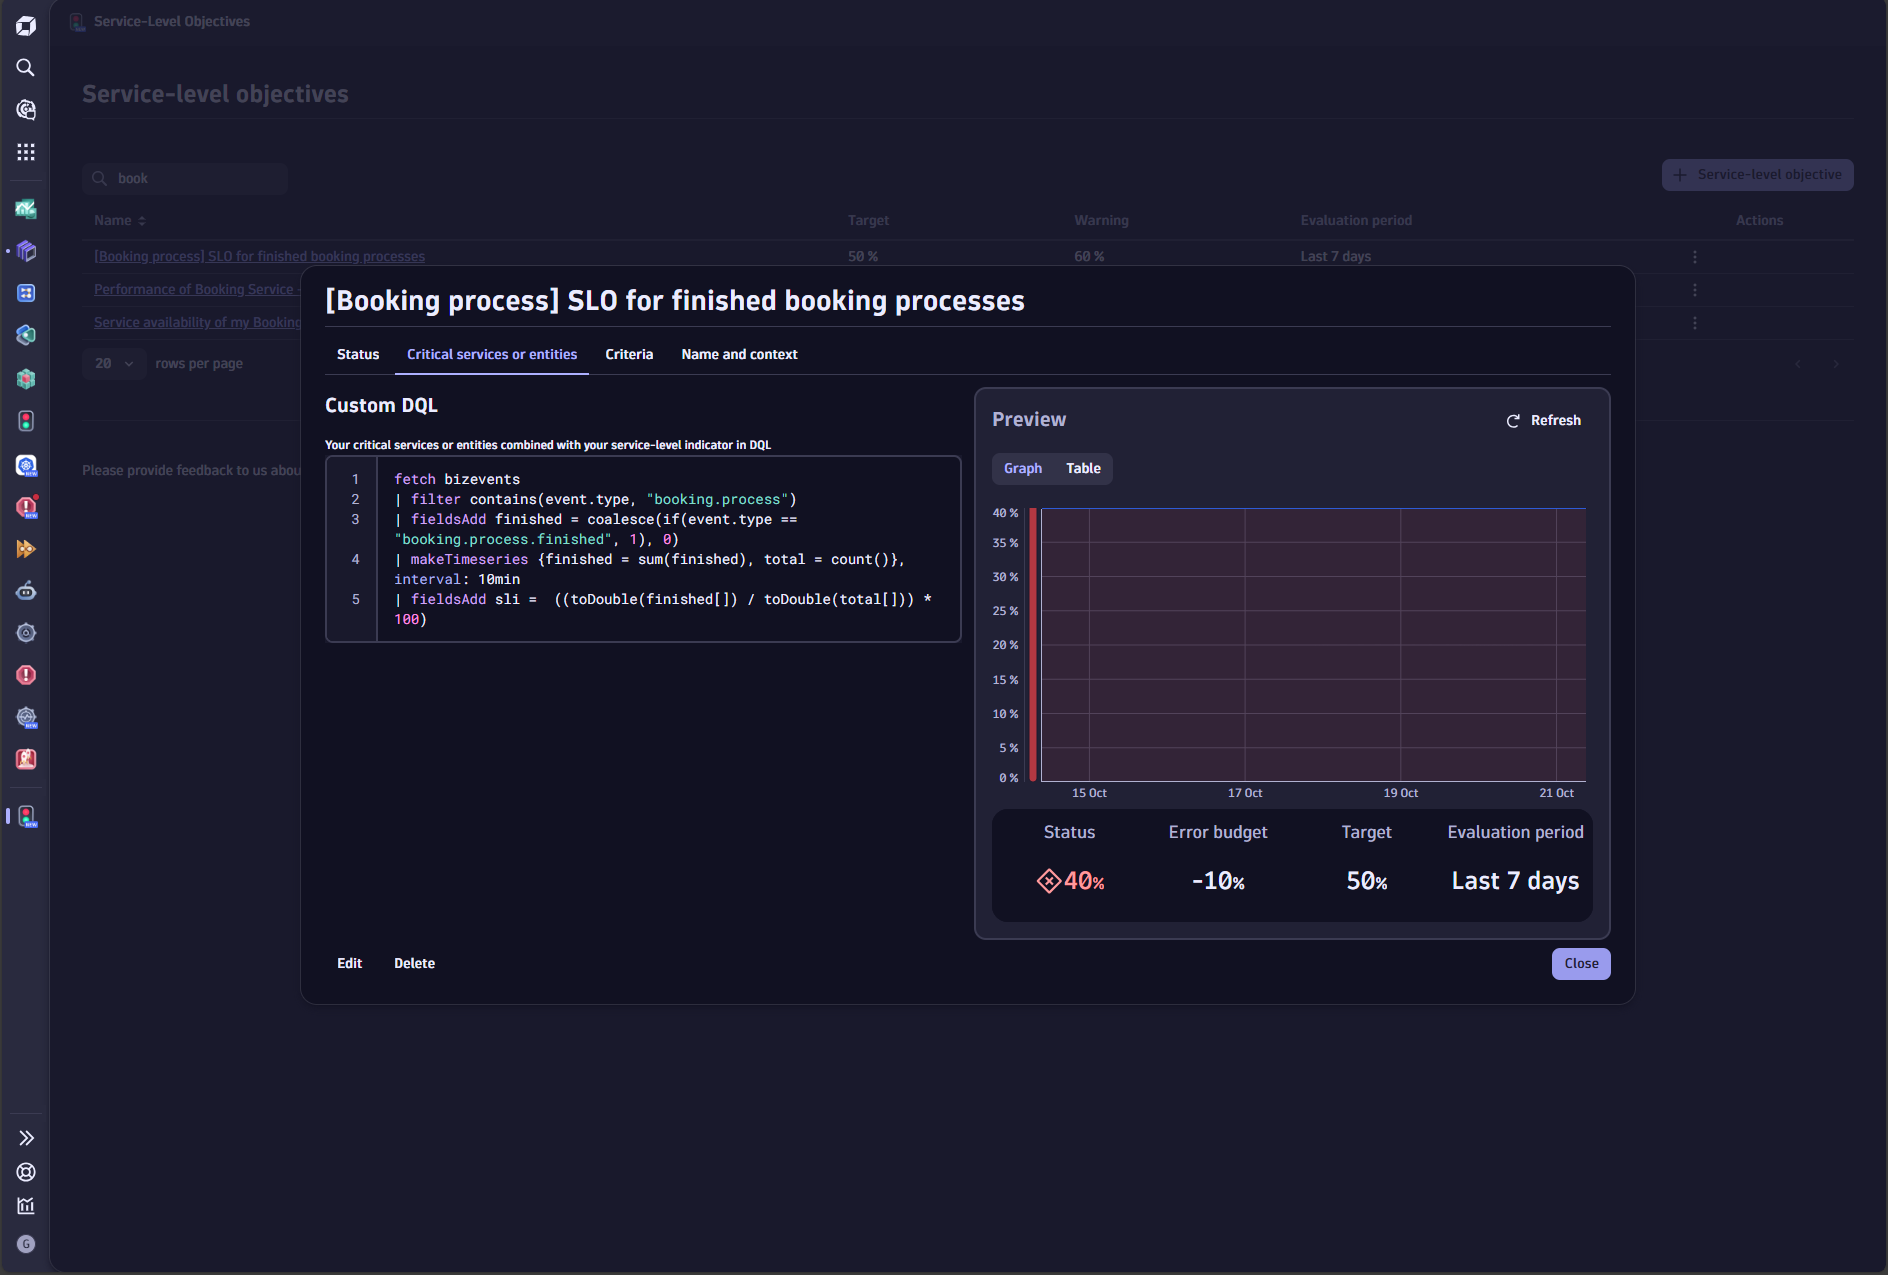
Dynatrace guides you in quickly getting the most valuable service level objectives (SLOs) set up in just a few clicks. To provide maximum freedom in selecting the service-level indicators that matter most to your business, Dynatrace combines SLOs with the power of Dynatrace Grail™ data lakehouse, the central data platform with heterogeneous and contextually linked data. Service-level objectives now utilize highly flexible Dynatrace Query Language (DQL) for all Grail data sources. This lets you build your SLOs around the indicators that matter to you and your customers—critical metrics related to availability, failure rates, request response times, or select logs and business events.
Heterogeneous services require heterogeneous indicators
Metrics, logs, and traces are the core ingredients for making your environment observable. Depending on the environment, the different information types provide indicators that reveal potential problems for your customers.
Having insights into the context and dependencies of such heterogeneous data is essential for seeing the forest, not just the trees. This is where Grail, the Dynatrace central data platform, excels. Grail provides access to contextually linked information with just a few query lines.
It doesn’t matter if you need typically used failure-rate or response-time metrics to ensure your system’s availability and performance or if you need to rely on abnormal log drops to gain insights into raising problems—SLOs leveraged with Grail provide all the information you need.

Are you defining SLOs based on the four golden signals of a critical service? No problem—out-of-the-box templates simplify the setup of time series data based on service requests, and templates can quickly be adapted for more fine-grain needs, for example, to consider only single endpoints.
Do you need to see if selected logs or loglines are missing over time? It’s easy—just use log data, extract the desired information, and create an SLO based on the log format.
Are you experiencing an increase or degradation in certain events that indicate a rising problem? It doesn’t matter if the events are ingested business-related events like deal closures or simple login numbers automatically captured by Dynatrace OneAgent®. Fetch your events, target critical components in your environment, and get notified proactively if your required objectives are at risk.
If you can query something using DQL, you can use it as an indicator for your SLO. The only prerequisite is that the result of the SLI needs to be a time series named sli. The make time series command handles how time series are created from other data types.

Grail, the Dynatrace central data platform, provides the needed information and adds context. With the recently released new SLO capability, you can use Grail and all its information to specify selected SLOs to ensure your critical components meet your expectations now and in the future.
Having service-level objectives for leading and lagging indicators provides a more holistic picture of the status of emerging issues. Setting the SLO on the data types that matter provides a more tailored view of the performance stats and helps limit the number of SLOs to critical items and the most impactful indicators.
SLOs on events, metrics, and logs: How to bring SLOs to the next level
Leveraging Grail, SLOs offer an immersive opportunity to focus your SLOs on user expectations, business goals, and core user journeys. When getting started, this can seem overwhelming, and it’s easy to get lost in the sea of opportunities.
With the latest release, Dynatrace introduces convenient ways to give you a head start with SLOs on all data types. If you have already worked with classic Dynatrace SLOs, most steps will be familiar and easy to follow.

The latest Dynatrace SLO implementation relies on the existing SLO creation wizard templates and provides guided workflows for setting up SLOs with the most commonly used SLIs: service availability, service performance, and CPU utilization.
In the coming weeks and months, we will add to the current collection of templates for synthetic monitoring, digital experience management measures, Kubernetes resource optimization, and infrastructure monitoring. However, all of these can be created today using DQL queries. Simply extract and manipulate your desired time series from Grail within a notebook and copy the query into the SLO definition to get your customized SLO.

Service-level objectives come with a dedicated management overview page, where existing SLOs can be reviewed and modified as needed.
The SLO wizard can be called directly from the management overview or the dashboard using a dedicated shortcut.


An added tagging option simplifies how you interact with your SLOs. Adding ownership information or relevant application boundaries as additional metadata to your SLOs makes it easier for all stakeholders to react or reach out to the appropriate teams in case performance degradations or dependencies are identified.
Dedicated management makes it easy to maintain and run your SLOs, while highly customizable dashboard tiles allow you to integrate SLOs with your health and performance overview stats.
SLOs provide immediate information about critical services’ long-term performance and experiences. Hence, having a dedicated dashboard tile visualizing the key parameters of each SLO simplifies the process of evaluating them.

Automate your SLOs
To manage and evaluate your SLOs at scale, Dynatrace allows you to create, manage, and evaluate your SLOs either via the Dynatrace web UI or API. To implement SLOs in your software delivery cycle and consistently add observability measures from the beginning, Dynatrace configuration as code (Monaco and Dynatrace Terraform) will soon support the new API.
The next step will be improved error-budget burn rate alerting, which Dynatrace Davis® AI root cause analysis can recognize, detecting potential threats to your SLOs before they affect your customers. Additionally, the Dynatrace Automation Engine will leverage SLO alerts to create event-triggered workflows to inform relevant stakeholders, provide reports, or automatically kick off remediation activities.
What’s next
Dynatrace SLOs leverage the power of Grail, providing dedicated SLO management, a user-friendly creation wizard with templates, improved dashboarding options, and an API to interact with the new generation of SLOs. While the SLO management web UI and API are already available, the dashboard tile will be released within the next weeks.
Subsequent improvements will include improved error-budget burn rate alerting and a notification option to proactively inform you when an SLO is at risk. Furthermore, SLOs will find their place within all areas in Dynatrace, making it even easier to create SLOs on demand. At the same time, dedicated configuration-as-code support in Monaco and Terraform will provide a scalable, automated solution.
Get started
Measure what matters most to your business and end-users. Set up your first SLOs and gain insights into relevant and important processes.
We’re eager to hear your experience, feedback, and ideas for improvement. A dedicated feedback channel is set up in the Dynatrace Community. We look forward to hearing from you. Feedback channel for the new service-level objectives app – Dynatrace Community
The new SLOs are available within all Dynatrace SaaS environments and ready for you to try out, beginning with Dynatrace SaaS version 1.303. The new dashboard tiles will be available with version 1.304.
Start setting up your SLOs on indicators that matter to you and your customers
We created a few examples on our Dynatrace Playground tenant so that you can experience the potential and flexibility of SLOs leveraging DQL. You’ll find SLO examples for different data types, such as metrics, events, or logs. You’ll also find examples for entity types like services, synthetic monitors, Kubernetes clusters, and namespaces, and you’ll learn how to use DQL to filter for a selected group of entities or remove specific time periods from SLO-status calculations. Additionally, we set up a sample dashboard that presents an overview of selected critical services and their combined health and performance status aggregated over time.


Looking for answers?
Start a new discussion or ask for help in our Q&A forum.
Go to forum