The Dynatrace Distributed Tracing app redefines how teams work with OpenTelemetry data. By combining OTel's comprehensive data collection with the Dynatrace platform, you gain unparalleled visibility into your application's behavior. The user-friendly interface simplifies the complexity of distributed traces, allowing you to pinpoint and resolve performance issues quickly. With out-of-the-box contextual analysis and the flexibility to dive deep into your data, Dynatrace empowers you to maximize the value of your OpenTelemetry implementation.
In this blog, we previously announced and went through a demo on how the new distributed tracing app provides effortless trace insights. Today, we’ll walk through a hands-on demo that showcases how the Distributed Tracing app transforms raw OpenTelemetry data into actionable insights.
Set up the Demo
To run this demo yourself, you’ll need the following:
- A Dynatrace tenant. If you don’t have one, you can use a trial account.
- A Dynatrace API token with the following permissions:
- Ingest OpenTelemetry traces (
openTelemetryTrace.ingest) - Ingest metrics (
metrics.ingest) - Ingest logs (
logs.ingest)
- Ingest OpenTelemetry traces (
To set up the token, see Dynatrace API – Tokens and authentication in Dynatrace documentation.
- A Kubernetes cluster (we recommend using this kind)
- Helm, to install the demo on your Kubernetes cluster.
Once your Kubernetes cluster is up and running, the first step is to create a secret containing the Dynatrace API token. This will be used by the OpenTelemetry collector to send data to your Dynatrace tenant. The secret can be created using the following command:
API_TOKEN="<your API token>"
DT_ENDPOINT=https://<your-tenant-id>.dynatrace.com/api/v2/otlp

kubectl create secret generic dynatrace --from-literal=API_TOKEN=${API_TOKEN} --from-literal=DT_ENDPOINT=${DT_ENDPOINT}
After successfully creating the secret, the OpenTelemetry demo application can be installed using Helm. First, download the helm values file from the Dynatrace snippets repo on GitHub.
This file configures the collector to send data to Dynatrace using the API token in the secret you created earlier. Then, use the following commands to install the Demo application on your cluster:
helm repo add open-telemetry https://open-telemetry.github.io/opentelemetry-helm-charts
helm install my-otel-demo open-telemetry/opentelemetry-demo --values otel-demo-helm-values.yaml
After invoking the helm install command, the application will eventually be up and running, and the OpenTelemetry collector will send data to your Dynatrace tenant.
Inspect traces using the Distributed Tracing app
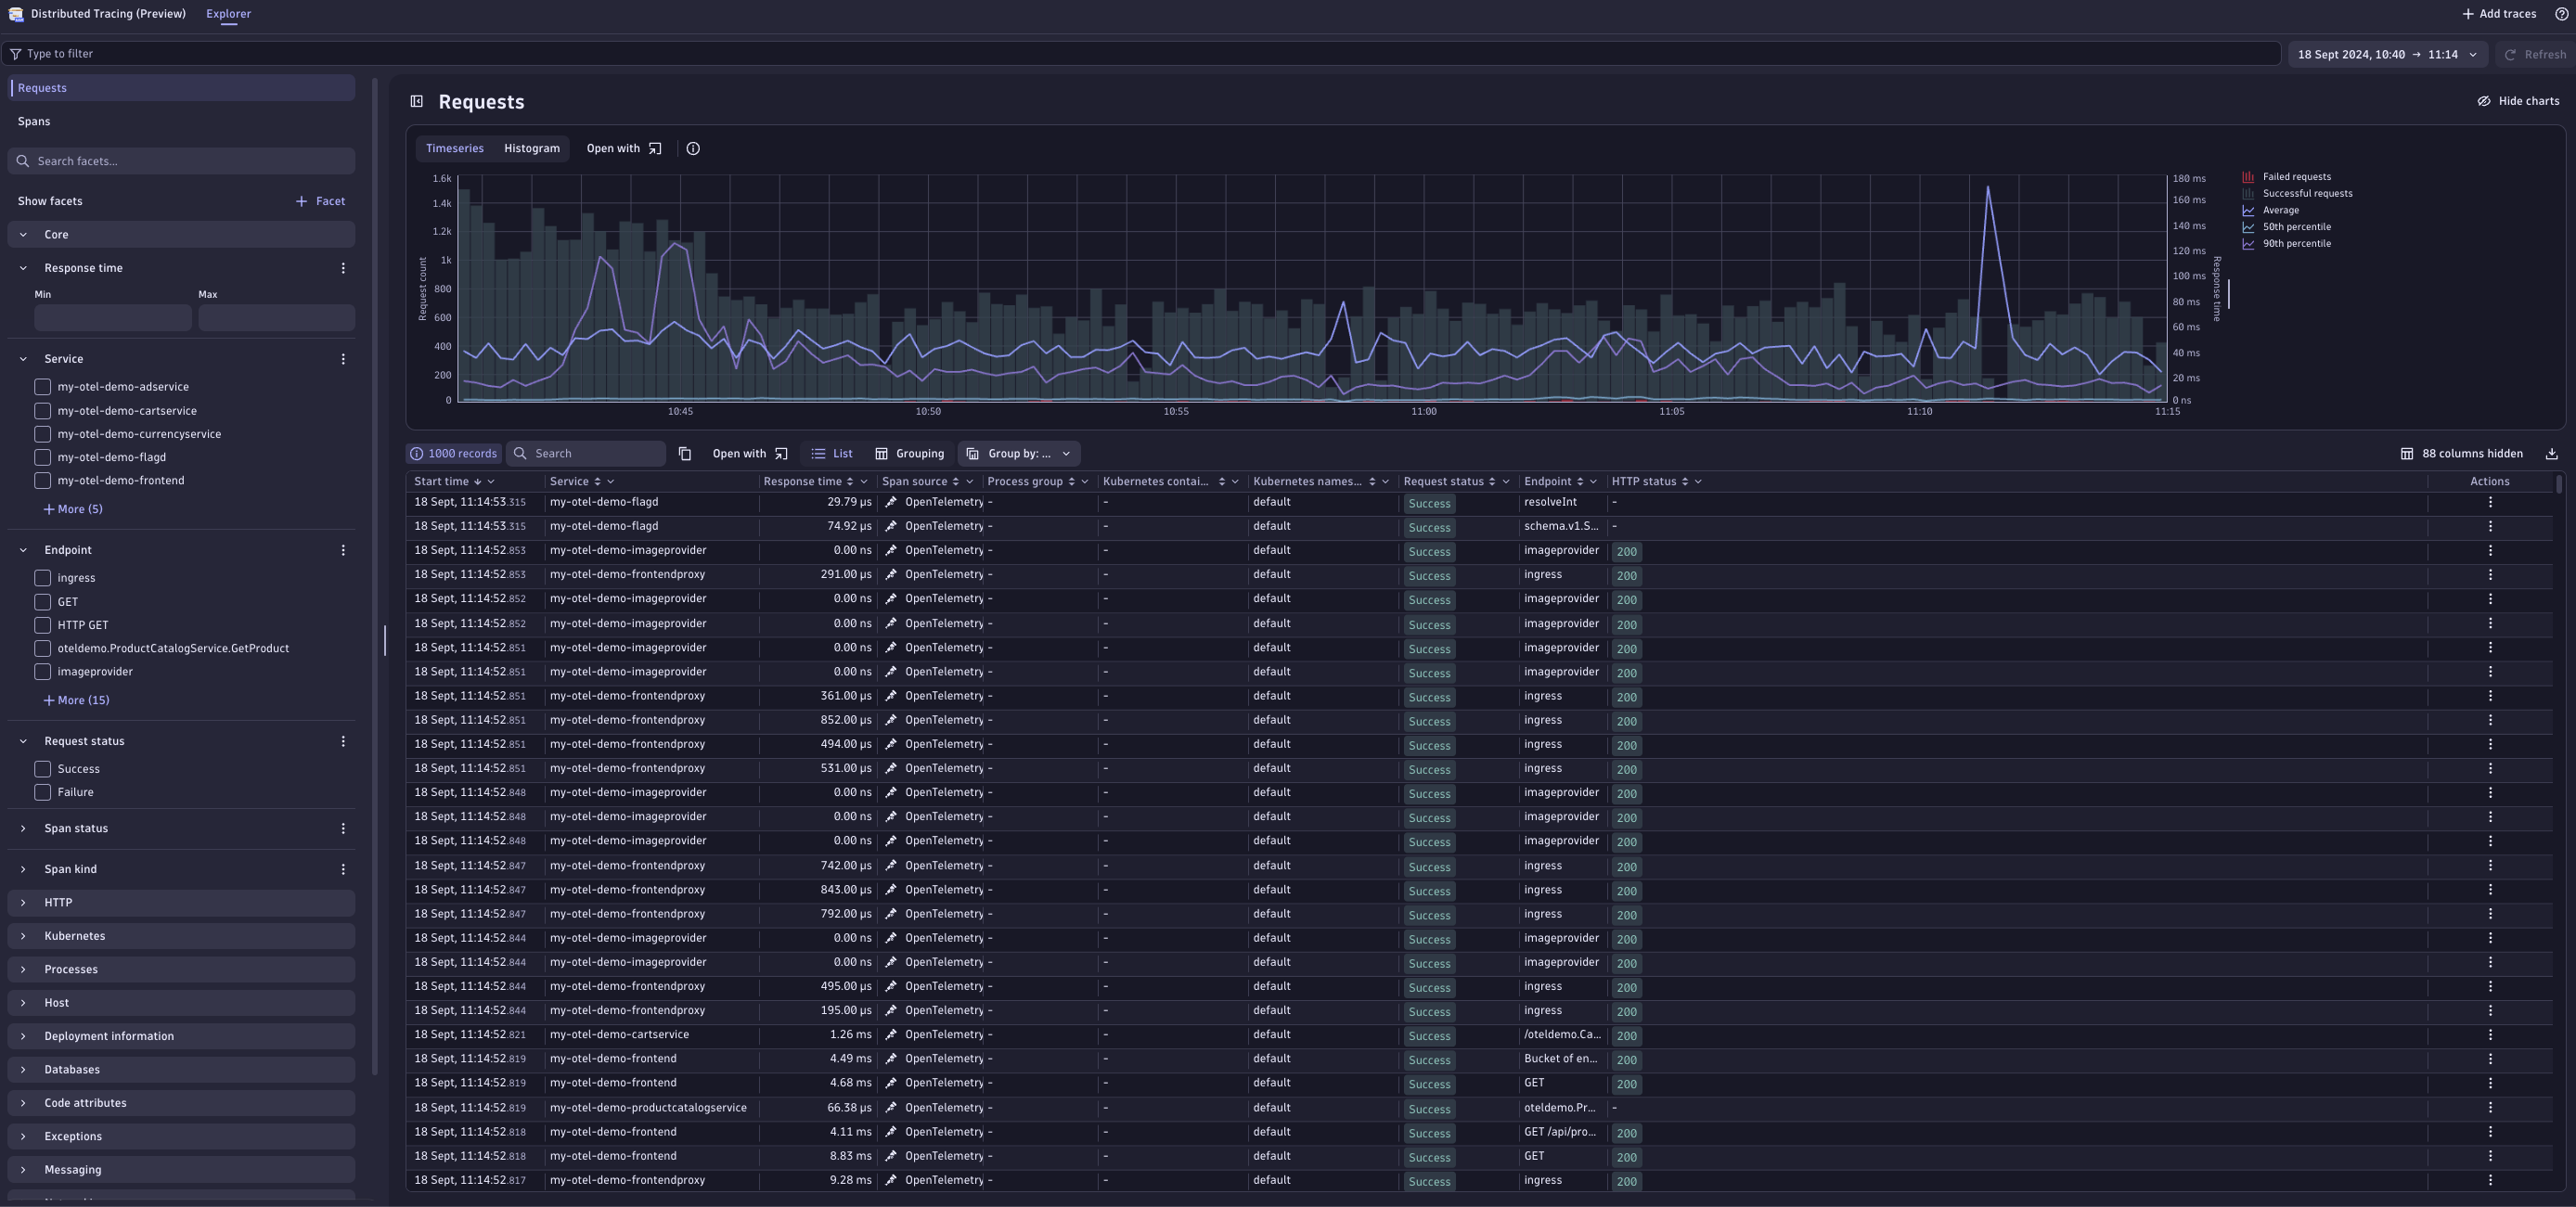
To gain insight into requests executed within the application, we can use the new Distributed Tracing app. This app provides an overview of all ingested traces within the application, including a list of the most recent traces and a time series chart representing metrics such as the response time percentiles and the number of successful and failed requests. The filtering fields on the left side make it easy to search for particular traces of interest, for example, if you want to inspect all the traces sent by a particular service.
Troubleshooting problems
Now let’s see how Distributed Tracing can help us spot problems and find their root cause. For this purpose, we’re going to make use of the built-in failure scenarios that are included in the OpenTelemetry demo. To enable a failure scenario, we need to update the my-otel-demo-flagd-config ConfigMap containing the feature flags of the application. The feature flags defined here contain a flag named productCatalogFailure, for which we will change the defaultVariant from off to on.
After a couple of minutes, the effects of this change will be noticeable due to an increase in failed spans within Distributed Tracing.
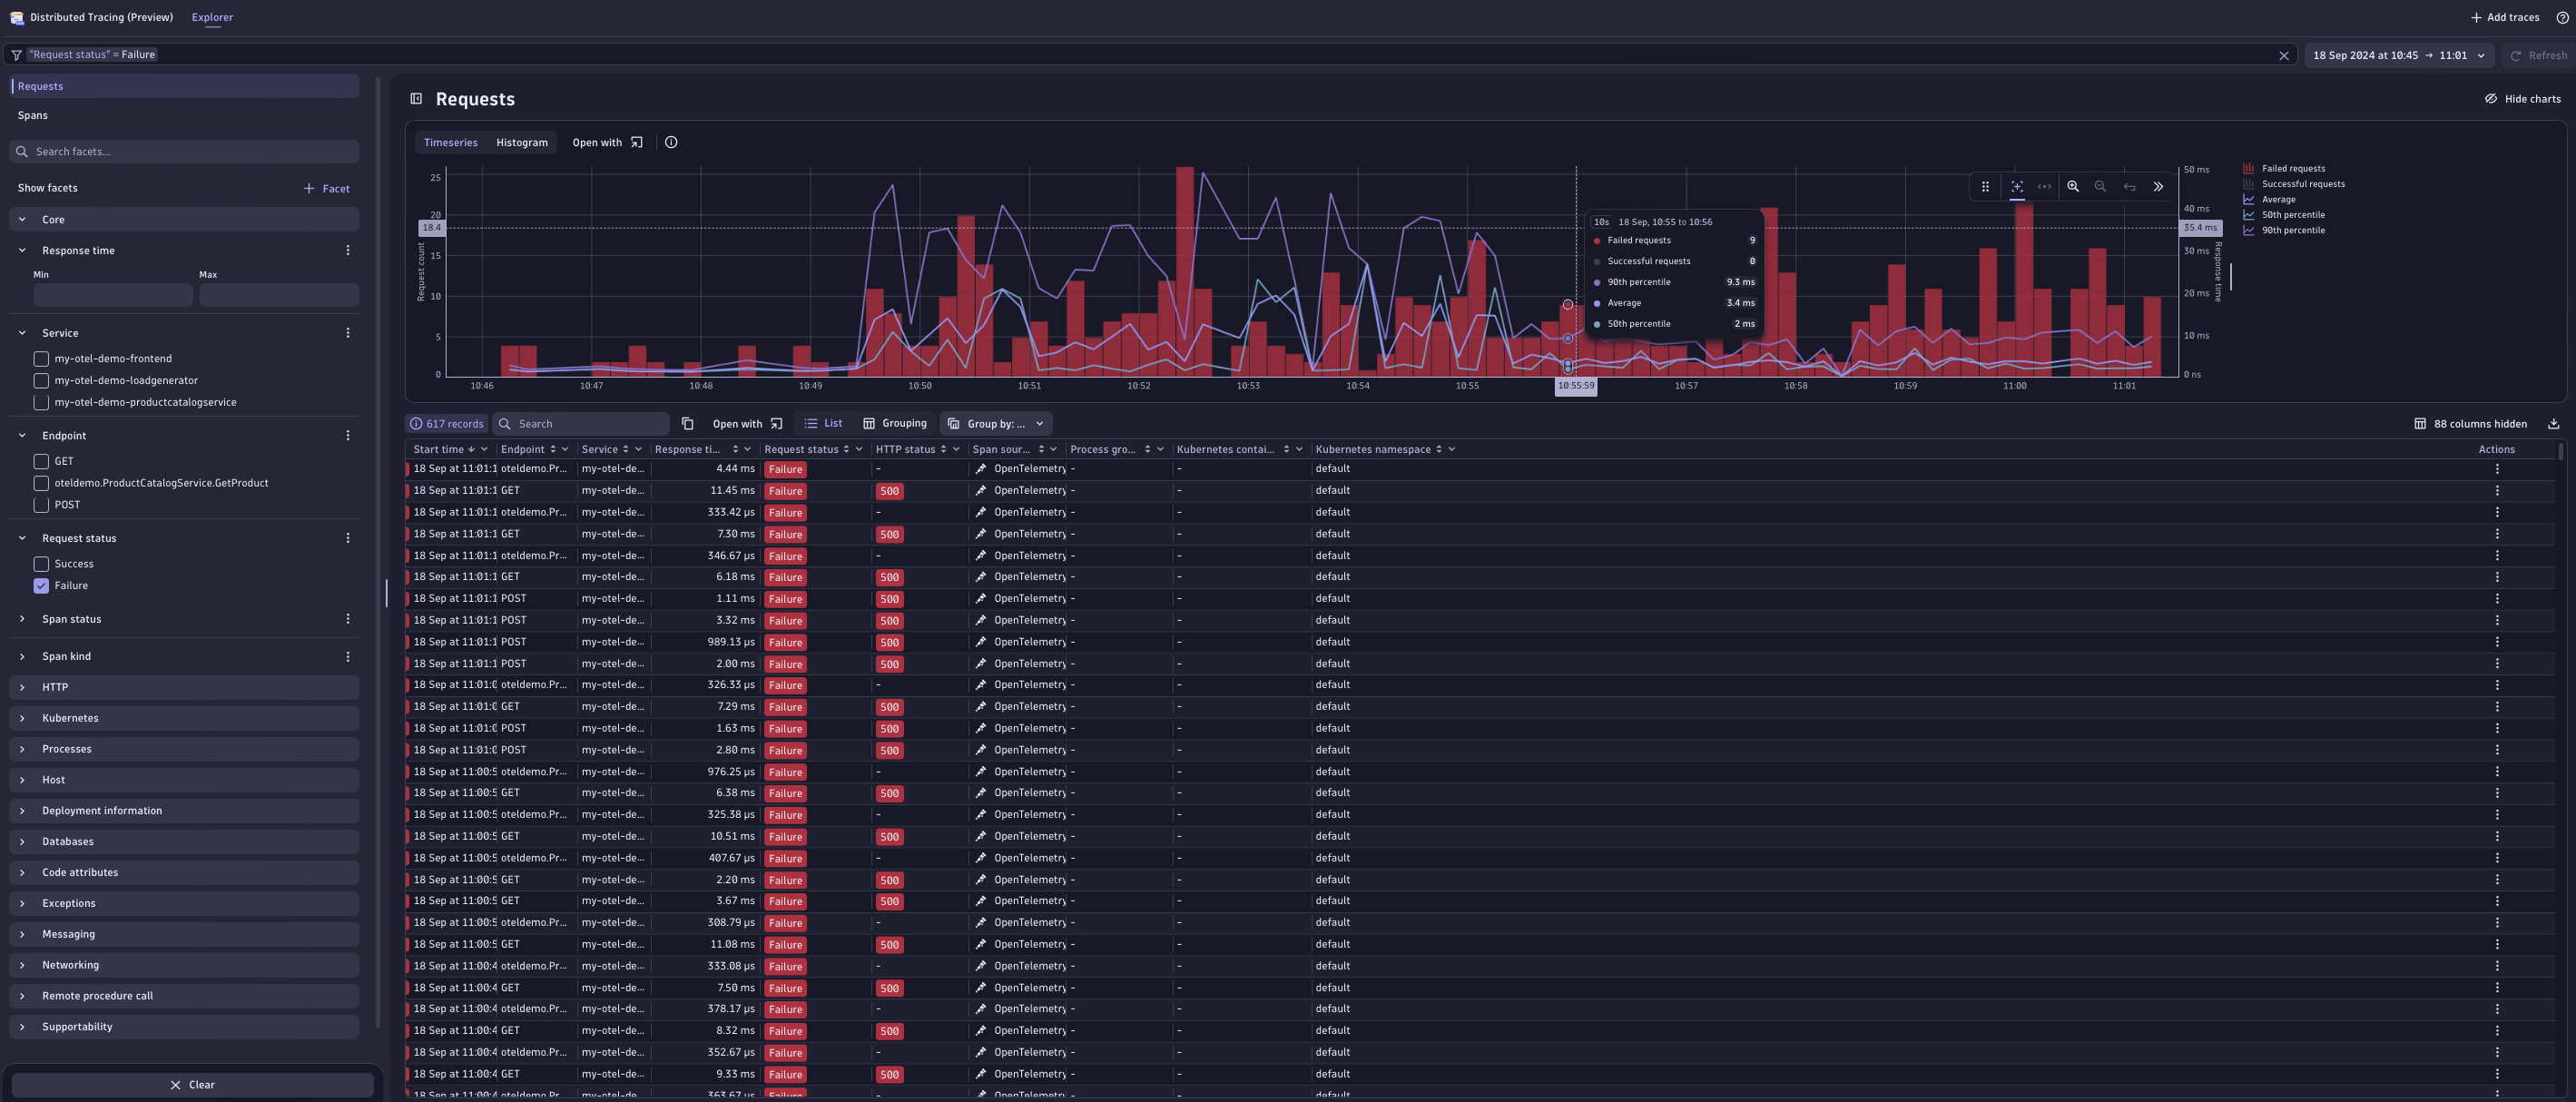
To investigate what’s happening here, we’ll open the details of one of the failed traces by selecting an entry in the span list. This leads to a detailed view of the complete trace, including all involved services in the executed request and the spans that are generated by these services.
Here we notice that the error seems to be caused by the product service, particularly instances of the GetProduct call. Select the failed span to access a detailed overview of the failed GetProduct request, including all attributes attached to the span, as well as a status description:

Here, we see that the status message indicates that the failures are related to the feature flag we changed earlier. However, not all of the GetProduct spans seem to be failing—only some.
Therefore, let’s investigate further by analyzing how certain attributes might impact the error rate. One interesting attribute to investigate is the product ID. In the example trace above, only some of the GetProduct requests failed.
To analyze whether there is a correlation between this attribute and the failure rate, we first select the attribute and add a filter to only show traces where this attribute is available:
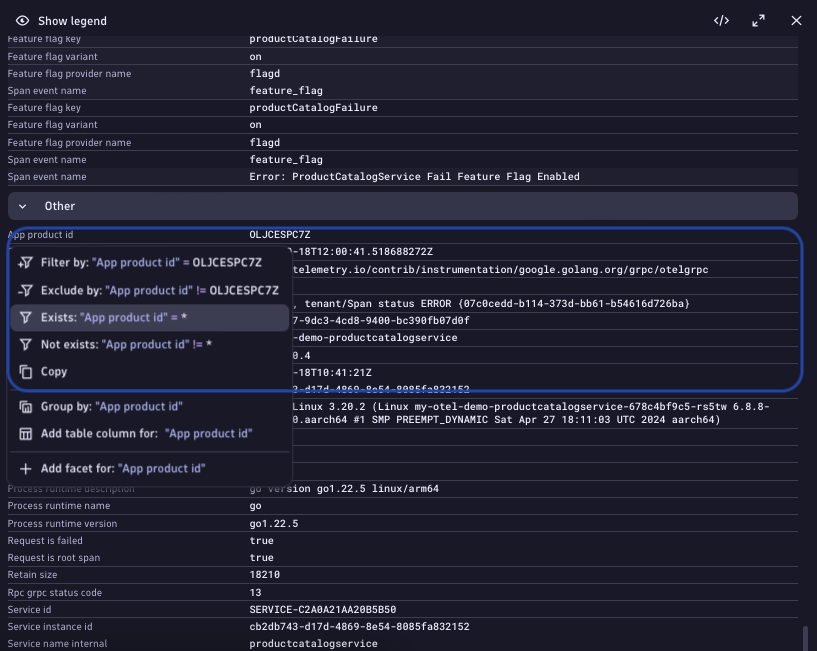
After applying this filter, the trace list above should only display the requests to the GetProduct endpoint of the productcatalogservice:

Next, we’ll add the product ID attribute to the columns of the trace list.
To do this, select the column settings at the top right of the table. Here, we’re presented with the option to add additional attributes to the column. Using the search field, let’s look for the product ID attribute and select it.
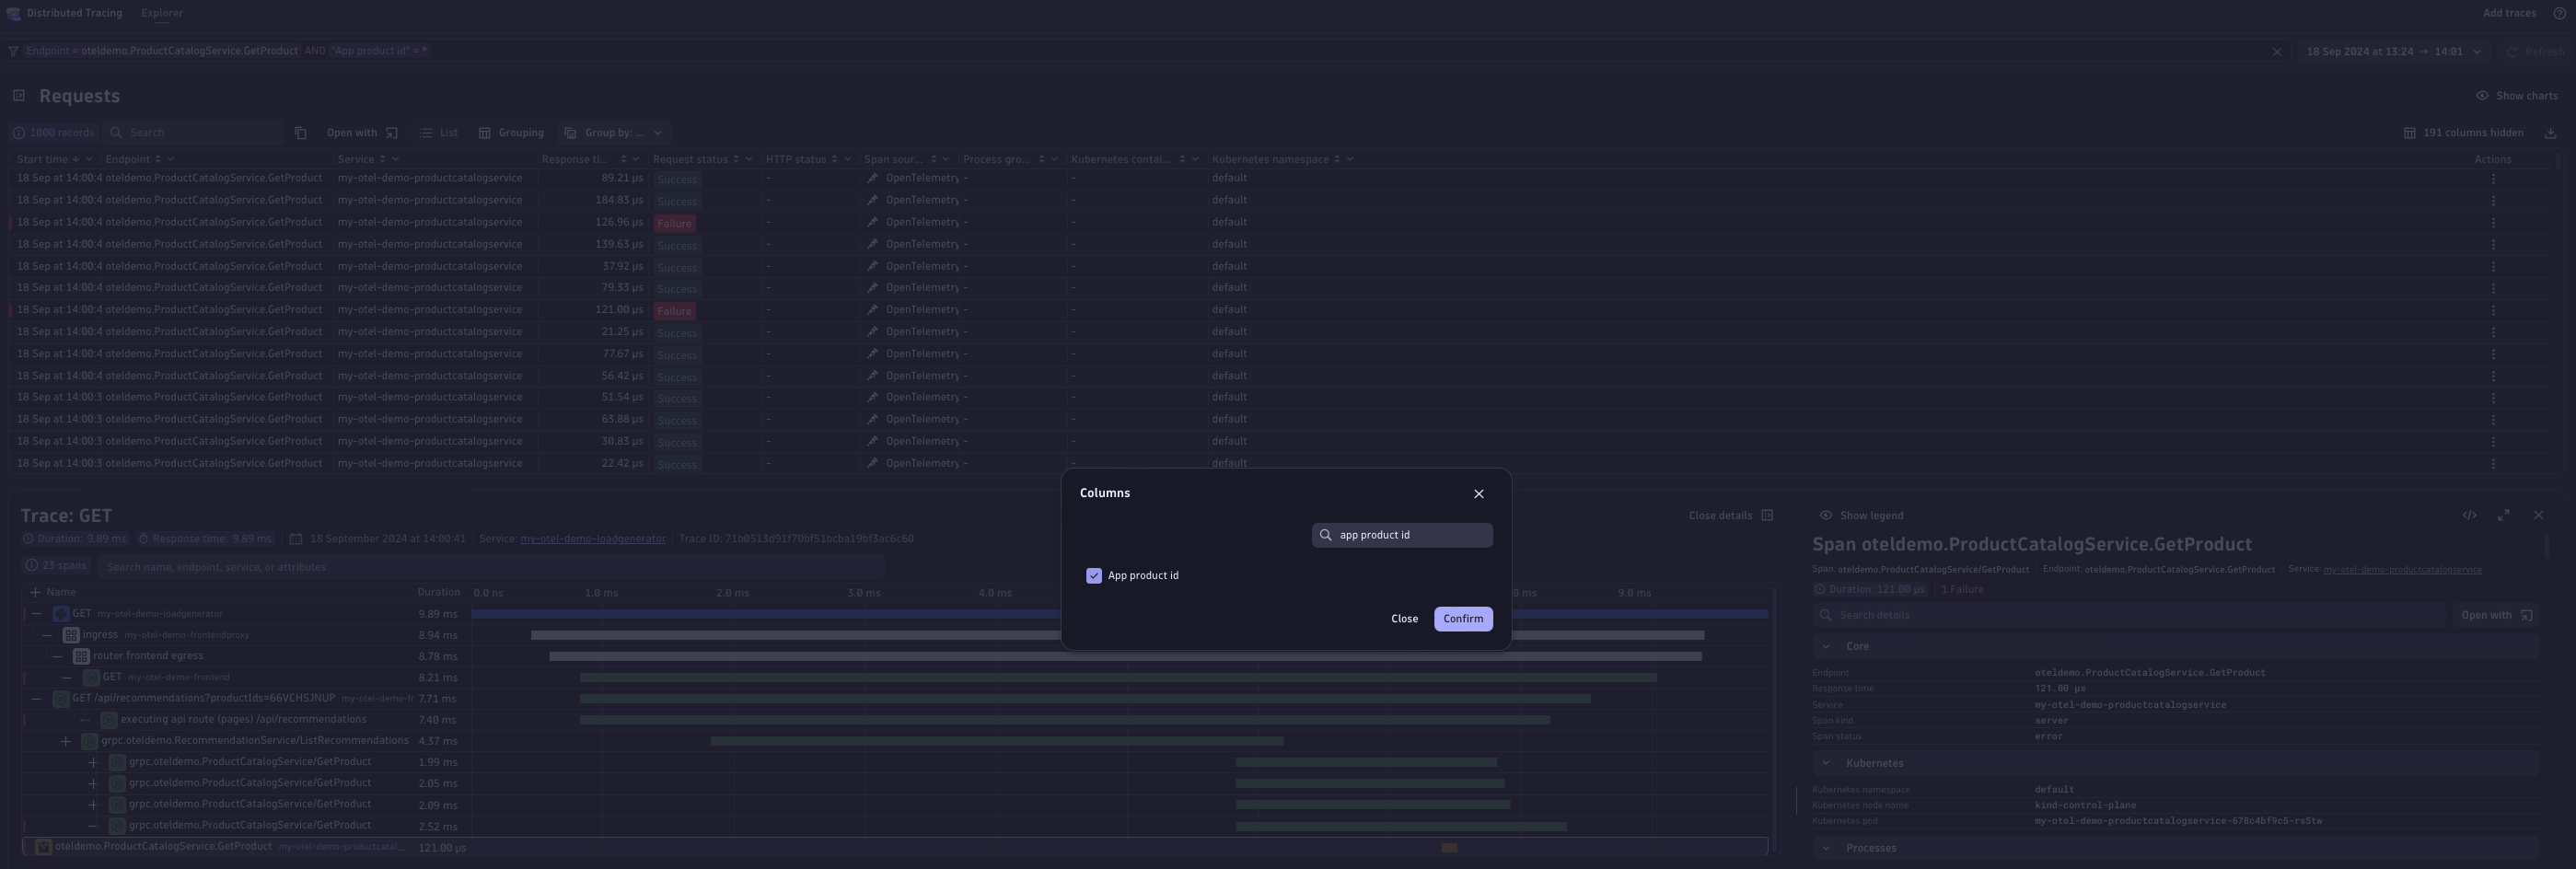
Once we’ve added the product ID attribute to the columns of the trace list, we can group the traces by that attribute. This shows us how many traces for a particular product ID were successful and how many failed.
To perform the grouping, select the header of the App product id column, and select Group By in the menu.

The result of this operation confirms our suspicion that there might be something wrong with a particular product, as all the errors seem to be caused by requests for a particular product ID:
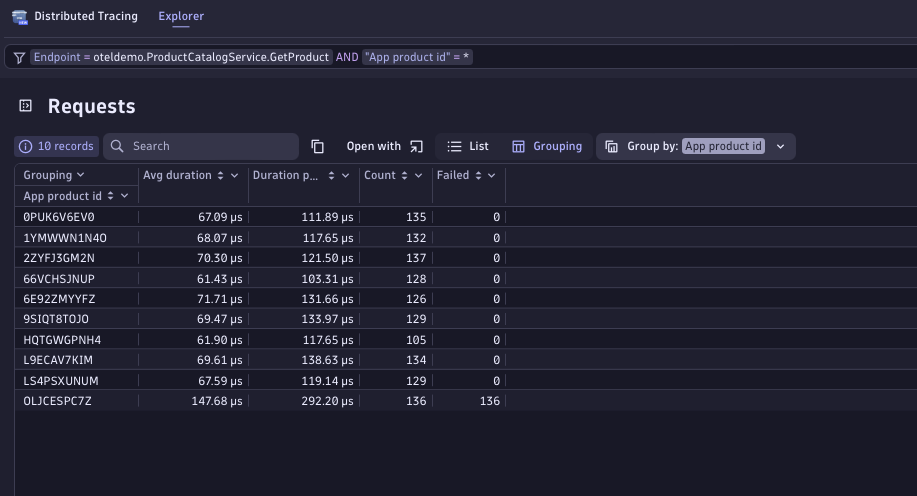 Of course, this example was somewhat easy to troubleshoot as we’re using a built-in failure scenario. This should, though, give you an impression of how Distributed Tracing enables you to investigate problems by first finding the failure point and then analyzing how certain attributes attached to spans might have an effect on the outcome of requests sent to a faulty service.
Conclusion
In this blog post, we explored how the Distributed Tracing app can be harnessed to visualize data ingested from the OpenTelemetry collector to get an overview of application health. This end-to-end tracing solution empowers you to swiftly and efficiently identify the root causes of issues. Enjoy unprecedented freedom in data exploration, ask questions, and receive tailored answers that precisely meet your needs.
This powerful synergy between OpenTelemetry and the Dynatrace platform creates a comprehensive ecosystem that enhances monitoring and troubleshooting capabilities for complex distributed systems, offering a robust solution for modern observability needs.
Get started
If you’re new to Dynatrace and want to try out the Distributed Tracing app, check out our free trial.
We’re rolling out this new functionality to all existing Dynatrace Platform Subscription (DPS) customers. As soon as the new Distributed Tracing Experience is available for your environment, you’ll see a teaser banner in your classic Distributed Traces app.
If you’re not yet a DPS customer, you can try out this functionality in the Dynatrace playground instead. You can even walk through the same example above.
If you’re interested in learning more about the Dynatrace OTel Collector and its use cases, see the documentation.
This is just the beginning. So, stay tuned for more enhancements and features.
Make your voice heard after you’ve tried out this new experience. Provide feedback for Distributed Tracing in the Distributed Tracing feedback channel (Dynatrace Community)


Looking for answers?
Start a new discussion or ask for help in our Q&A forum.
Go to forum