Dynamic business conditions demand in-the-moment business insights. Discover how Dynatrace delivers real-time business observability for data-driven business decisions.
Business events are a special class of events, new to Business Analytics; together with Grail, our data lakehouse, they provide the precision and advanced analytics capabilities required by your most important business use cases. Business events deliver real-time business data from anywhere and empower business and IT teams to analyze, discover, and automate to improve business outcomes.
Let’s look at the unique enabling characteristics of business events through two use case examples, then see how easy it’s to get started.
What are business events?
Business events are prioritized over metric events and observability data to deliver lossless precision. It’s an important distinction; many business use cases won’t tolerate sampling or other resource-conservation approaches common to operational monitoring. Inventory counts, revenue reports, and service activation flows are just a few examples that demand precision.
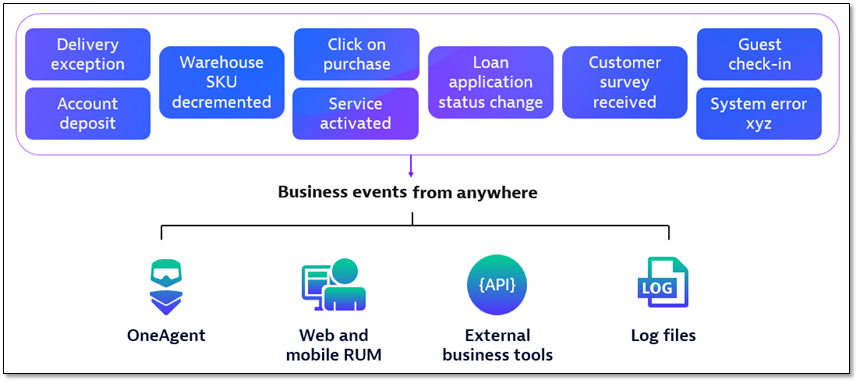
Business events capture business data from anywhere; they can come from OneAgent, from real-user monitoring (RUM) sessions, from log files, or from external tools and data sources. Dynatrace automatically enriches business events with topology metadata before storing them in Grail. From there, you use the Dynatrace platform to analyze, discover, and automate—without worrying about where the data is or where it comes from.
This diagram shows a few examples of business events. Note that most of these have a clear business—and not IT—focus, but that’s an arbitrary distinction; business events can include any data important to your use case.

Analytics without boundaries
There are other characteristics important for business use cases, delivered through Grail and Dynatrace Query Language (DQL). These include the following highlights:
- Long-term cost-effective storage to support seasonal trending and forecasting
- Unaggregated granularity to support “needle in a haystack” queries
- Instant indexless storage to support unanticipated retrospective questions
- Smartscape context to support drill-down analytics and promote collaboration
Let’s take a closer look at two use cases that are uniquely enabled by business events and Grail.
Use case 1: real-time business intelligence
Business intelligence tools have earned a reputation for being inflexible, lacking the context and real-time insights needed to understand and improve business processes and customer experience. They are generally backward-looking, relying on data stored in accounting and other business systems for a historical perspective. How can business teams gain the same real-time observability and analytics that IT teams enjoy?
Business events are the answer; with real-time precision and easy access to in-flight business data, Dynatrace Business Analytics offers a compelling and agile complement to business intelligence tools. Consider the following business revenue use case:
A retail chain wants to boost the average checkout transaction value by encouraging customers to add additional items to their purchase. To track this goal, regional sales managers need real-time visibility into the number of items per transaction and the transaction value, segmented by store. But the company’s point-of-sale system limits daily reports to sales volume, with additional detail available only in monthly reports.
With a few simple configuration steps (outlined below), OneAgent begins capturing key sales data as business events, sending them to Grail in real time. Immediately, the sales managers can track transaction data for each store, focusing on the stores with the lowest items to transaction ratio.
| Store number | Transactions per day | Items per transaction | Average sale value |
| 1234 | 1105 | 3.1 | 30.65 |
| 1206 | 1812 | 2.4 | 25.05 |
| 1516 | 899 | 3.0 | 31.19 |
| 1401 | 1283 | 3.3 | 35.04 |
Once they’ve identified which stores are at risk, the managers want additional granularity to analyze a store’s performance by duty manager and sales associate.
| Store number | Duty manager | Sales associate | Items per transaction | Average sale value |
| 1206 | 1234 | 1514 | 2.1 | 23.38 |
| 1206 | 1234 | 1493 | 1.9 | 24.05 |
| 1206 | 1919 | 1514 | 2.8 | 31.31 |
| 1206 | 1919 | 1892 | 2.7 | 28.04 |
These questions—and others like them—can easily be answered retrospectively through ad hoc queries, with no need for additional configuration.
Use case 2: from digital experience to customer experience
Your digital teams focus on conversion funnels, creating web experiences that encourage them to become customers. We categorize these user journeys as digital experience, and our customers enjoy best-in-class digital experience monitoring.
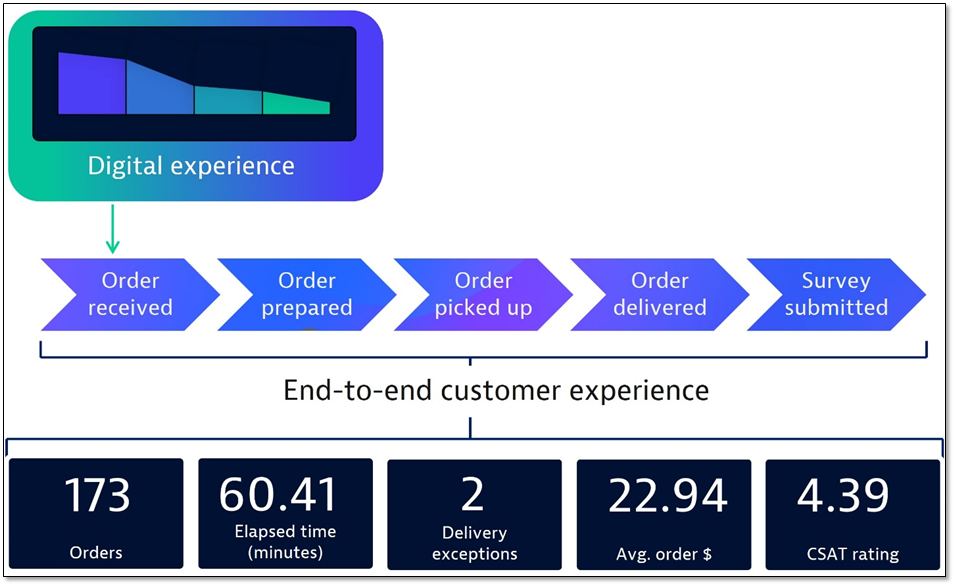
But the conversion—from visitor to customer—is just the start of the end-to-end customer experience. What happens after the conversion? You can deliver a perfect digital experience and still disappoint your customer. Whether you’re providing gated access to a video, activating a service, or delivering food to your customer’s doorstep, there are critical business processes that must work together to fulfill the expectations you’ve set.
A pizza chain wants to improve customer satisfaction by tracking delivery times from each shop. They already monitor digital experience using RUM for web and mobile users, but lose visibility into the order fulfillment process once the order is received. Using the order ID as the unique identifier, they can easily connect each conversion to the process milestones that follow, including the handoff to the delivery agent; dashboards summarize each shop’s performance. They also decide to add a follow-up survey after each delivery; since the survey responses are also tagged with the order ID, they can learn how delivery delays impact survey results through ad hoc queries.

| Order ID | Purchase amount | Elapsed time | Survey response |
| 94123 | 19.50 | 49.4 | 2 |
| 94001 | 41.95 | 81.0 | 2 |
| 94032 | 59.10 | 71.8 | 3 |
| 93995 | 38.38 | 68.2 | 3 |
Deliveries with survey responses ≤ 3.0
Get started with OneAgent for business events
OneAgent is a great starting point for using business events. Deep payload inspection extracts up to 64KB of business data from in-flight application requests and responses, and configuration is simple and doesn’t require code changes.
The Business Analytics documentation covers configuration steps in detail; here we’ll provide an overview.
Configuration overview
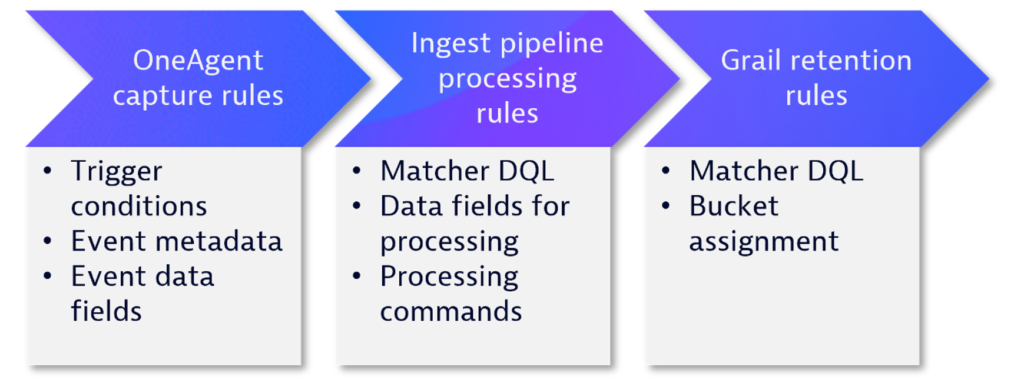
Dynatrace business events loosely follow a subset of the Cloud Events specification for describing event data; if you’re familiar with the specification, you’ll recognize the similarity as you configure your business events. For OneAgent, there are just a few mandatory fields to complete your capture rule and start using business events. Refining the rule with specific data fields and transforming the data via processing rules will add to the value you get from the business data you’re capturing.

Configuration example
Consider the pizza shop example above, with this snippet from the JSON file. We want OneAgent to capture the data as a business event for reporting and analysis.

Step 1: Create a capture rule with trigger conditions, event metadata, and data fields.
- The trigger defines the condition that, when met, will cause OneAgent to capture the business event. We’ll use the request path that
containsthe value/easypizza/purchase. - The event metadata fields (provider, type, and category) add context, and can be a fixed value or extracted directly from the event itself. We’ll use
easypizza.comas the event source, andcom.easypizza.purchaseas the event type. The event category field is optional. - Event data fields are used to extract attribute/value pairs from the event. We’ll capture
orderId,quantity, andunitPrice.
Step 2: Add processing rules with matcher DQL, data fields, and processor definition.
Note that there is no total amount field in the sample JSON – just a unit price and quantity. We can use a processing rule to add this new field.
- The matcher uses DQL to filter event data for processing. We’ll use
matchesValue(action, “purchase”) - The data fields will be used in the processor definition; we’ll need
unitPriceandquantityto derivetotalAmount. - Processing commands define how to transform the matching data; we’ll use
FIELDS_ADD(totalAmount: quantity*unitPrice)
The processing rule will add the totalAmount field to the business event stored in Grail.
Step 3: Define the retention period with matcher DQL and bucket assignment.
Business events are assigned to buckets that have pre-defined retention periods.
- The matcher uses DQL to filter business events for bucket assignment. We’ll use
matchesValue(event.provider, "www.easypizza.com"). All business events from this event provider will be assigned to the selected bucket. - Choose from three bucket options: 35 days, 1 year, or 3 years.
Automatic enrichment
Dynatrace automatically enriches business events with important topology and application information. For OneAgent, these include host, process group, and trace, and provide the context necessary to analyze anomalies and foster collaboration. Intermittent order update failures? Drill down to see the health of the host or process group or open the distributed trace to discover bottlenecks or downstream failures.
What’s next?
Business events and Grail are game changers for our customers, and now is a great time to start thinking about your business use cases. For additional technical insights and to see business events in action, I recommend you watch this Performance Clinic.


Looking for answers?
Start a new discussion or ask for help in our Q&A forum.
Go to forum