Developing, deploying, and monitoring the release of native mobile apps is not an easy process. It involves multiple stakeholders and teams as well as various mobile frameworks and publishing controls. To effectively and efficiently get mobile apps out the door, monitor their performance, and manage subsequent releases, mobile DevOps practitioners can play an integral role.
Mobile DevOps practitioners provide streamlined collaboration between product managers, developers, and operations staff to ensure a continuous workflow throughout the release process. They need to understand the source and impact of complex problems that affect mobile apps and identify how to resolve them quickly. DevOps tasks become significantly more manageable with an all-in-one platform that offers automated instrumentation and AI capabilities out of the box. This type of platform can automatically monitor and baseline mobile applications while looking for performance bottlenecks, errors, and exceptions, providing immense value to mobile DevOps practitioners.
This is the third and final segment of the mobile application monitoring blog series covering the variety of benefits Dynatrace offers for mobile app developers, owners, and DevOps practitioners. In the we cover mobile app instrumentation for mobile developers with Dynatrace. Subsequently, in the second blog post we review how mobile app owners can assess the overall performance and success of a mobile app by looking at business metrics derived from user session telemetry data.
Now, you can learn how Dynatrace advances mobile DevOps in this video:

Mobile DevOps crash and error analysis
The types of information that mobile DevOps practitioners need is very detailed. To get started, we’ll take a linear flow to identify what this information is and how it can be used, specifically in the Dynatrace platform.
Crash analysis
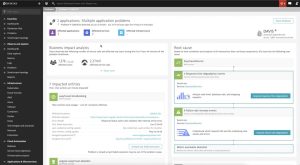
Imagine a scenario where there is an error and the mobile application crashes whenever the user attempts to carry out a particular function. Dynatrace automatically detects those types of problems and generates a problem card, as shown in the following screenshot. Mobile DevOps practitioners can find these cards on the Dynatrace platform under Problems on the left navigation. These automatically generated problem cards enable mobile DevOps teams to pinpoint issues, immediately and without effort, so they can concentrate on resolving them.
Identifying root cause
Below is an example of a complex problem that is impacting the back end as well as the mobile native application. Dynatrace indicates the extent to which end users are affected, the nature or type of problem, and the root cause that triggered it.
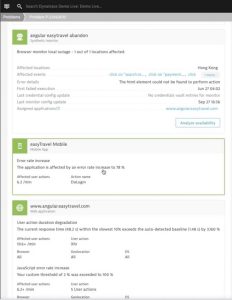
In the following example, the error rate has increased to 78%. Not only did Dynatrace Davis AI detect this automatically, but it also reveals that the problem is related to a much larger issue. Dynatrace discovered the issue automatically and immediately determined the root cause, which in this case, was a failed HTML element in the EasyTravel web service.
Error rate analysis
Mobile DevOps practitioners need to have deeper insights into how and to what extent these problems impact their mobile applications. Developers can find these pertinent details by clicking on the problem card. Here, the mobile DevOps practitioner can analyze the error rate and see more details. In this case, request errors are the root cause of the problem, shown with detailed insights into the context, including the timeframe of when the problem occurred in the following example.
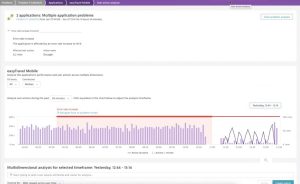
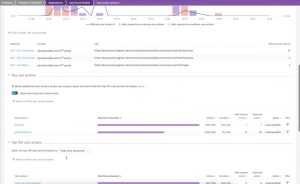
Dynatrace maintains that context throughout the analysis and shows the different requests that are likely triggering these errors and crashes. It also shows which user actions were being impacted as follows.
Dynatrace enables mobile DevOps practitioners to analyze those crashes, which is a critical part of the DevOps process. With Dynatrace, practitioners are able to filter based on versions where the crashes are most prevalent and explore further details by clicking on a particular crash group.
This breakdown reveals a lot more detail. For instance, in the following screenshot, you can see that most of the crashes are coming from an Android 6.0.1 operating system. Filters offer other drilldowns such as device, connection type, location of users, and more. This enables you to select and prioritize which type of crash you want to tackle.<
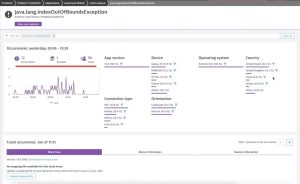
With all this intelligence in a single view, mobile DevOps practitioners can visualize the entire stack trace, including device information down to CPU details, and even the session information.
Individual user and behavioral analysis
While capturing the breadth of information through the full stack, Dynatrace shows mobile DevOps practitioners complex data in a simplified format based on the user sessions to indicate what the experience was like for the user. The example in the following screenshots illustrates that the interaction with the application was a frustrating one. Along with the variables, such as device type and orientation, where the users are coming from, and which path they took during their user journey during that session, mobile DevOps users can identify the exact user action(s) that caused the user’s sub-par experience.
Dynatrace also captured other actions that the system automatically triggered as the application started, including the calls-to-action the user tapped through and where the crash occurred. Mobile DevOps practitioners have access to the entire context of what the user was doing leading up to the crash as well as the subsequent details.
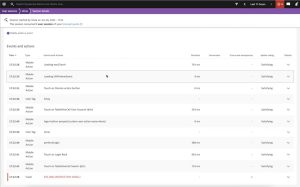
Dynatrace takes this data up another notch by providing a video replay of that session via a capability called Session Replay, which practitioners can turn on optionally per application. When enabled, it allows the practitioner to see exactly what the user saw during the session, including navigation, orientation changes, and all interactions with the interface, such as typing in information or opening files. Dynatrace securely captures session video, and the practitioners’ organization has full control over what gets stored and displayed to practitioners. Session Replay is GDPR compliant and captures no PII data.
Deeper mobile DevOps insights into connected services using trace information
As mobile DevOps practitioners know, a mobile native application exists in a much larger context. There is a slew of services underneath the mobile native application. Dynatrace connects the dots so you can link the user session and capture what their actions on the application were. Practitioners can now trace this context back through the corresponding service flow to understand the back-end components involved in responding to these requests.
The following screenshot shows inbound traffic coming from the mobile native application as it hits the EasyTravelWebserver service. The traffic then splits off into two further services (EasyTravelService and CustomerFrontendREST), both of which then split off into other services and so on, all the way back to a request being sent to the database.
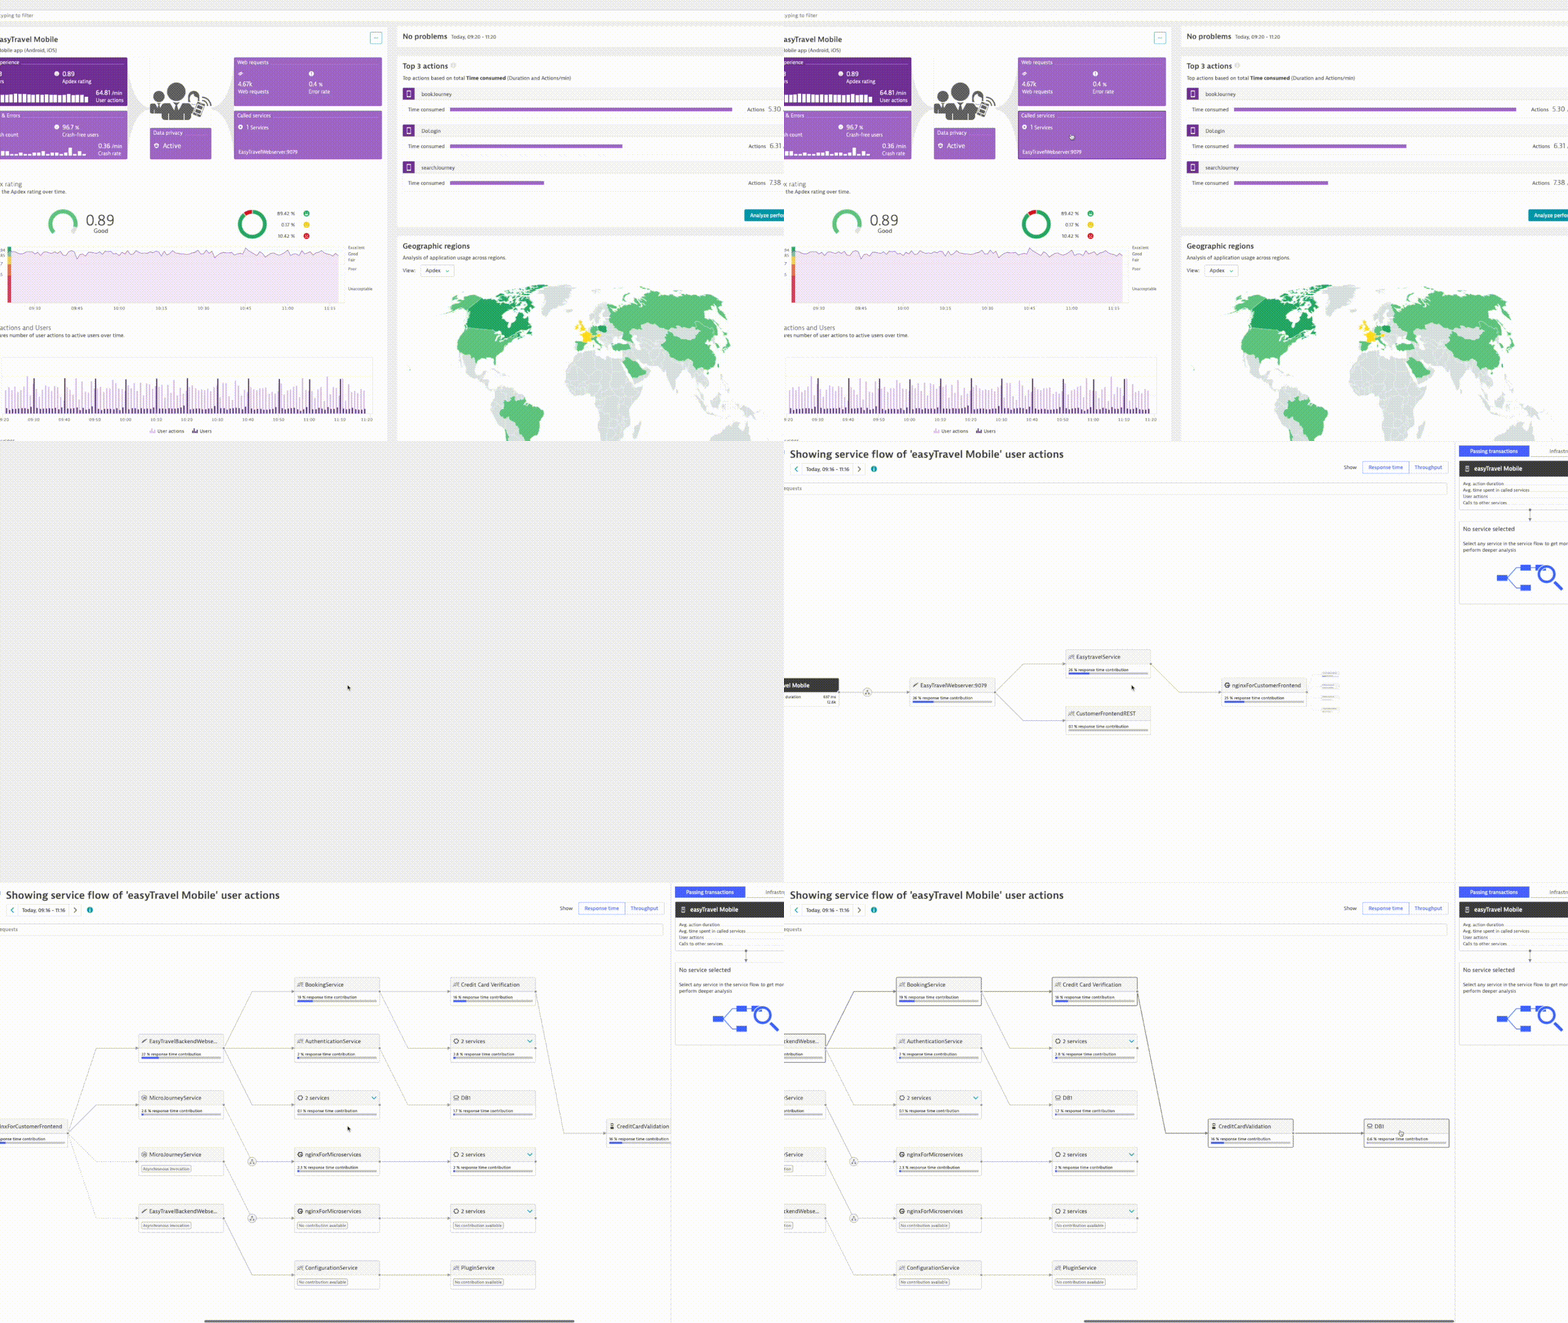
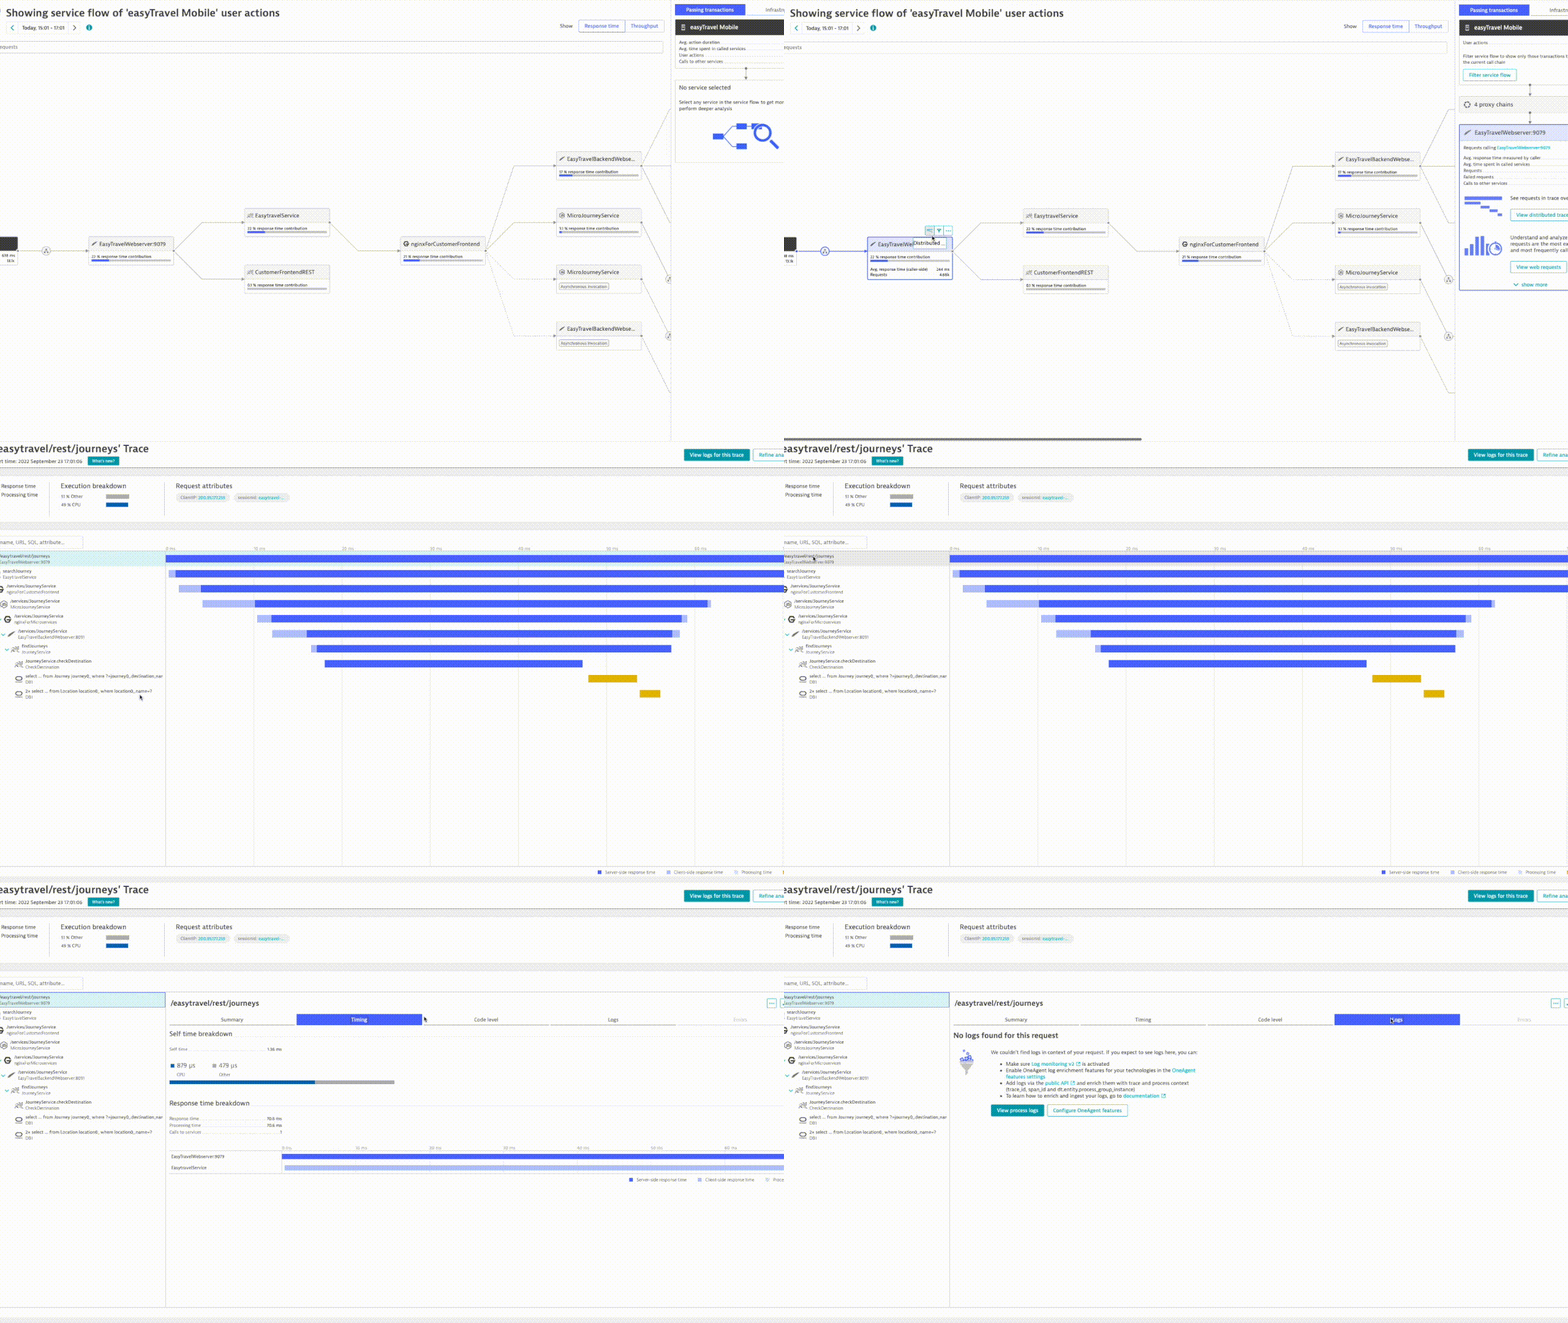
If necessary, the request could even be tracked back to a mainframe to examine specific trace information, which allows practitioners to understand how these requests are being executed. A mobile DevOps practitioner can click a particular event to see its complete distributed trace or PurePath. The PurePath is a collection of spans and traces from all originating sources. In this example, all the back-end services originate from a Dynatrace agent or an OpenTelemetry request. You can click into the detailed view to see a summary of that request obtained from its native mobile device. This detail includes timings, code level view, and logs. If there are associated errors, you can see them indicated together with where they originated and details about that specific exception.
If your role as a mobile DevOps practitioner is to drive mobile native excellence in your organization, Dynatrace provides an all-in-one solution for you. Everything from being able to understand the crashes that occur in the device, to errors and exceptions that occur within back-end requests that are supporting those native applications is at your fingertips.
To experience the Dynatrace difference, start your free trial today. And don’t forget to watch the video overview of this content and read part one and part two of the mobile application monitoring series.



Looking for answers?
Start a new discussion or ask for help in our Q&A forum.
Go to forum