As part of our partnership with Microsoft, Dynatrace is excited to announce our new Prometheus Extension for Apache Cassandra. This extension provides fully app-centric Cassandra performance monitoring for Azure Managed Instance for Apache Cassandra.
Apache Cassandra is an open source, distributed, NoSQL database. Because of its scalability and distributed architecture, thousands of companies trust it to run their cloud and hybrid-based workloads at high availability without compromising performance.
Cassandra is also essential to Dynatrace because it is integral to our monitoring solution. This makes Dynatrace a natural Microsoft launch partner for Azure’s Managed Instance for Apache Cassandra Service. As a part of this partnership, we are proud to announce the release of Dynatrace’s Cassandra Prometheus Extension.
Azure Managed Instance for Apache Cassandra vs Azure Cosmos DB Cassandra API
Microsoft Azure offers multiple ways to manage Apache Cassandra databases.
Azure Managed Instance for Apache Cassandra provides the ability to provision managed Apache Cassandra clusters on Azure. You can also quickly scale out the capacity of your existing on-premises or cloud self-hosted Apache Cassandra clusters. It also removes the need for developers and database administrators to manage infrastructure or update database versions.
Azure Cosmos DB Cassandra API is a compatibility layer over Microsoft’s globally distributed cloud-native database service, Azure Cosmos DB. This enables Apache Cassandra drivers and applications to use Azure Cosmos DB as a cloud-native, fully managed NoSQL database service.
These two Azure services in combination enable Apache Cassandra customers to adopt a solution that simplifies hybrid cloud complexity.
Seeing the value
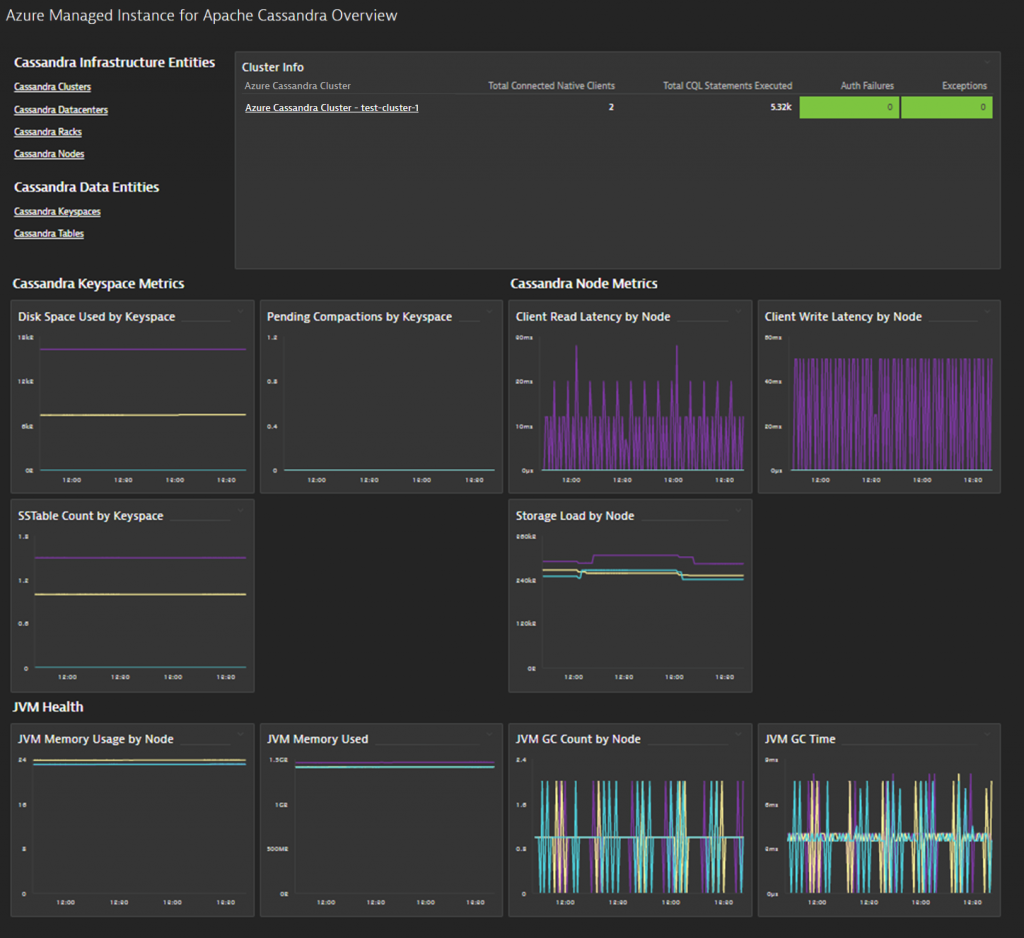
Once you deploy the Dynatrace extension, Dynatrace ingests your Cassandra metrics and analyzes them in context with the entire stack. Then the extension adds a preconfigured dashboard, topology entities and relationships, and entity screens to your environment. You can use the dashboard “Azure Managed Instance for Apache Cassandra Overview” as a launch point for your Cassandra monitoring.

From the main dashboard, you get a quick snapshot of your clusters and how they’re performing. 
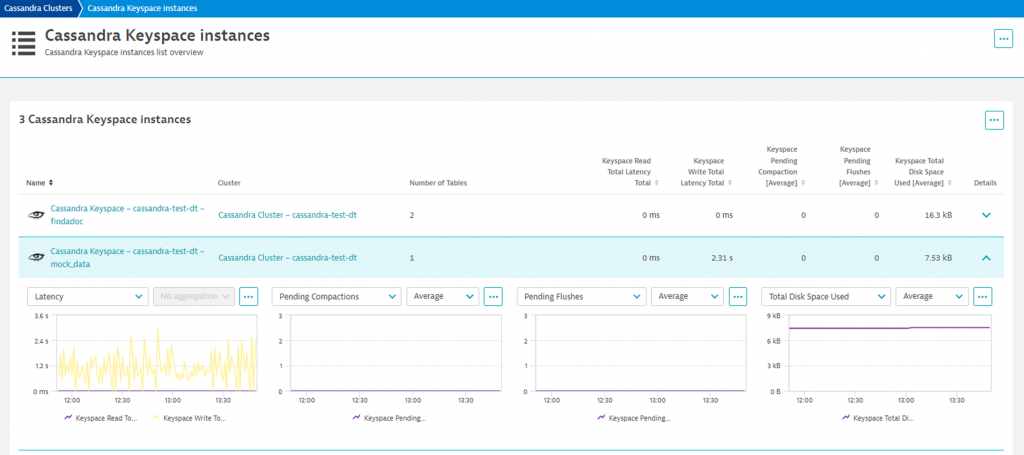
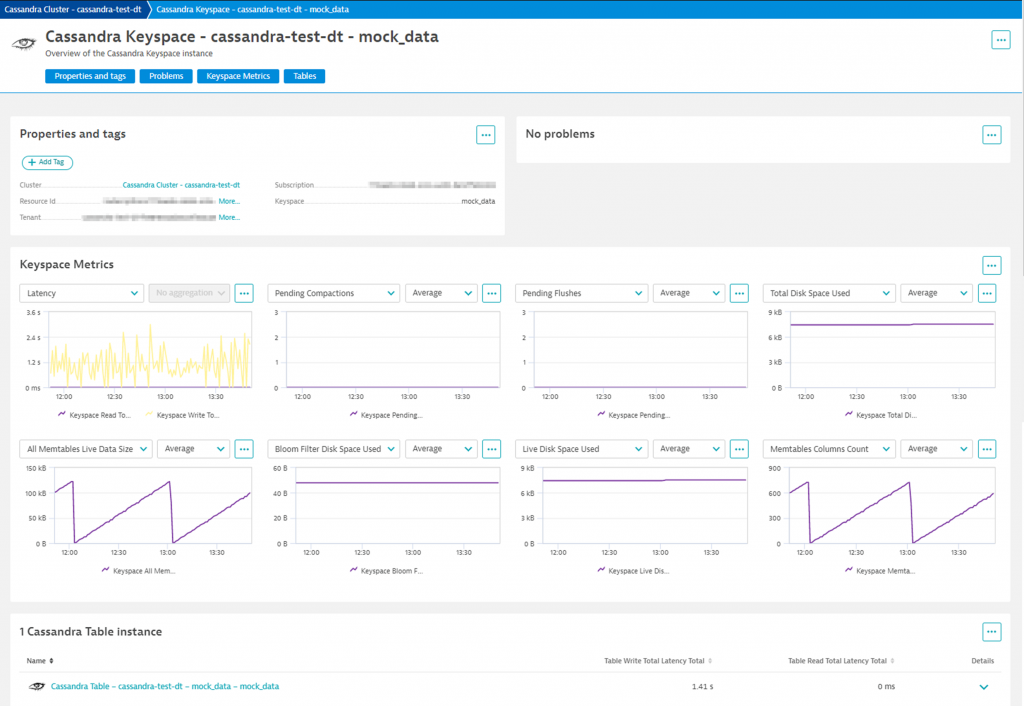
From there, you can dive deeper into infrastructure metrics (cluster, datacenter, racks, and nodes) and data metrics (keyspaces and tables).

In addition to the built-in views, Dynatrace provides data analysis that enhances your ability to query and chart metrics. For example, the Dynatrace Data Explorer enables you to do the following:
- Analyze multidimensional metrics, whether built into Dynatrace or ingested from other sources like Azure Monitor.
- Choose from any of nine visualizations: graph, stacked column, stacked area, pie, single value, table, top list, heatmap, or honeycomb.
- Add your visualization to your dashboards for easy access and sharing.
- Provide a foundation for calculating metrics in dashboard charts.
With the Dynatrace Data Explorer, you can easily analyze metrics, such as client read/write latency by Cassandra nodes and disk space usage by keyspaces. You can also analyze table metrics, such as cache hits and misses.
Precise AI-powered answers for Azure Managed Instance for Apache Cassandra
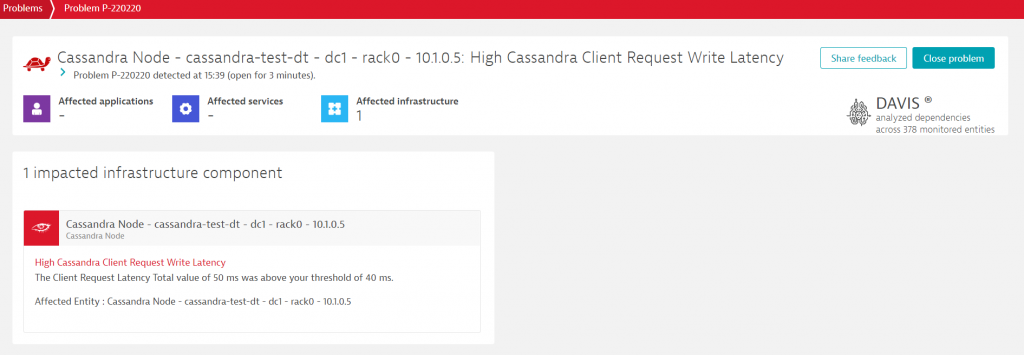
Analyzing data for fast troubleshooting can be very complex due to the large amounts of data and variety of data sources. Rather than processing simple time-series data, Dynatrace Davis®, our AI causation engine, maps data to a unified entity model using metrics, traces, logs, and real user data. Davis gives your operations team specific answers about the root cause of problems so you can prioritize and resolve issues.
Below is an example of a Dynatrace problem card, which shows how a spike in Cassandra write latency impacts your application.

Start monitoring Azure Managed Instance for Apache Cassandra
Use Dynatrace to monitor all of your Azure Managed Cassandra instances. Then you can easily visualize performance issues and determine the root cause of problems.
To get started, sign up for a free 15-day trial.


Looking for answers?
Start a new discussion or ask for help in our Q&A forum.
Go to forum