With Dynatrace, you can transform numerical log attributes into metrics for AI-powered problem detection and root cause analysis. This enables DevOps teams to minimize alert noise, reduce MTTR from an incident or service degradation, and minimize manual work.
Over the last year, Dynatrace extended its AI-powered log monitoring capabilities by providing support for all log data sources. We added monitoring and analytics for log streams from Kubernetes and multicloud platforms like AWS, GCP, and Azure, as well as the most widely used open-source log data frameworks. Now, Dynatrace has the ability to turn numerical values from logs into metrics, which unlocks AI-powered answers, context, and automation for your apps and infrastructure, at scale.
Key information about your system and applications comes from logs
Sometimes, you need information about your system or application that is only available in log data—for example, when logging relevant data points from your application during the development stage for debugging. Once set up in development, you can use the same log data points to understand the execution of your application in production.
This also applies to logging use cases for certain technologies. Let’s take the example of AWS Lambda, a prominent example of FaaS (Function-as-a-Service) where developers build, compute, and execute applications as functions without having to maintain their own infrastructure. After a function is executed, Lambda logs both the actual duration of the function and the billed duration of the function.
Example
Duration: 163.41 ms Billed Duration: 200 msThe parameter Billed Duration is only available in logs, so it makes sense to extract it from your logs so that you can keep an eye on your cloud costs.
Whatever your use case, when log data reflects changes in your infrastructure or business metrics, you need to extract the metrics and monitor them.
Manual tracking of metrics from logs is too complex at scale
Questions that need answers when you see a significant change in log-based metrics:
- Where is the problem?
- What entities does the problem affect?
- What can I do about the problem?
Answering all these questions in a single metric is tricky, but it’s nearly impossible to do at scale when the number of monitored entities explodes.
Even if you’ve identified other relevant metrics, manually monitoring changes to those metrics to detect anomalies requires lots of time and repetitive work in setting up static thresholds for alerting.
After investing valuable hours into manual alerting setup, the real work begins. When an alert is triggered—hopefully not a false-positive alert—you must act and find answers to questions, such as:
- What is the deviation from the alert threshold?
- What caused the anomaly?
- What entities does the anomaly impact?
- How can I mitigate the negative effects of the anomaly?
Such manual workflow is painful and doesn’t lend itself to competitive modern enterprises.
This is where the Dynatrace Software Intelligence platform comes in.
Hand the work over to Davis® AI
Dynatrace Log Monitoring enables you to monitor specific log attribute occurrences as metrics. Now, you can take the numerical value of a log attribute, for example, session duration time, and easily turn it into a metric.
Instead of manually looking for meaning in logs and reacting to discovered insights, you can hand the job over to the Dynatrace Davis® AI causation engine. Davis automatically detects performance anomalies in your applications, services, and infrastructure, as problems. The power of Davis doesn’t end there however as problem detection is coupled with analysis into the impact and root cause of each detected problem, which can suggest options for mitigation.
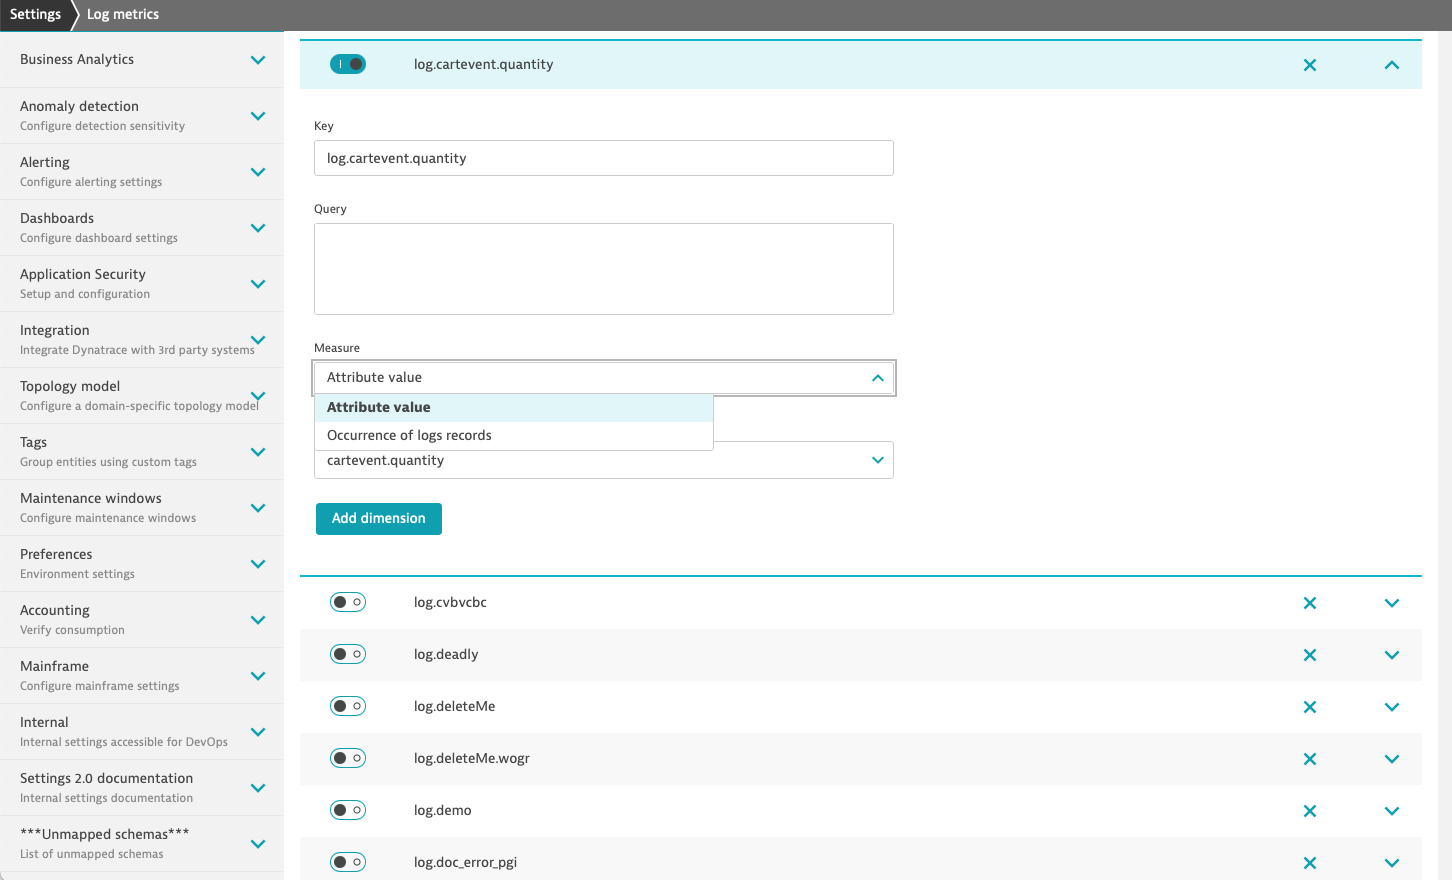
After getting your logs into the Dynatrace platform via our log ingestion API, you only need to complete two steps: define a custom log attribute and create a custom metric based on that attribute.
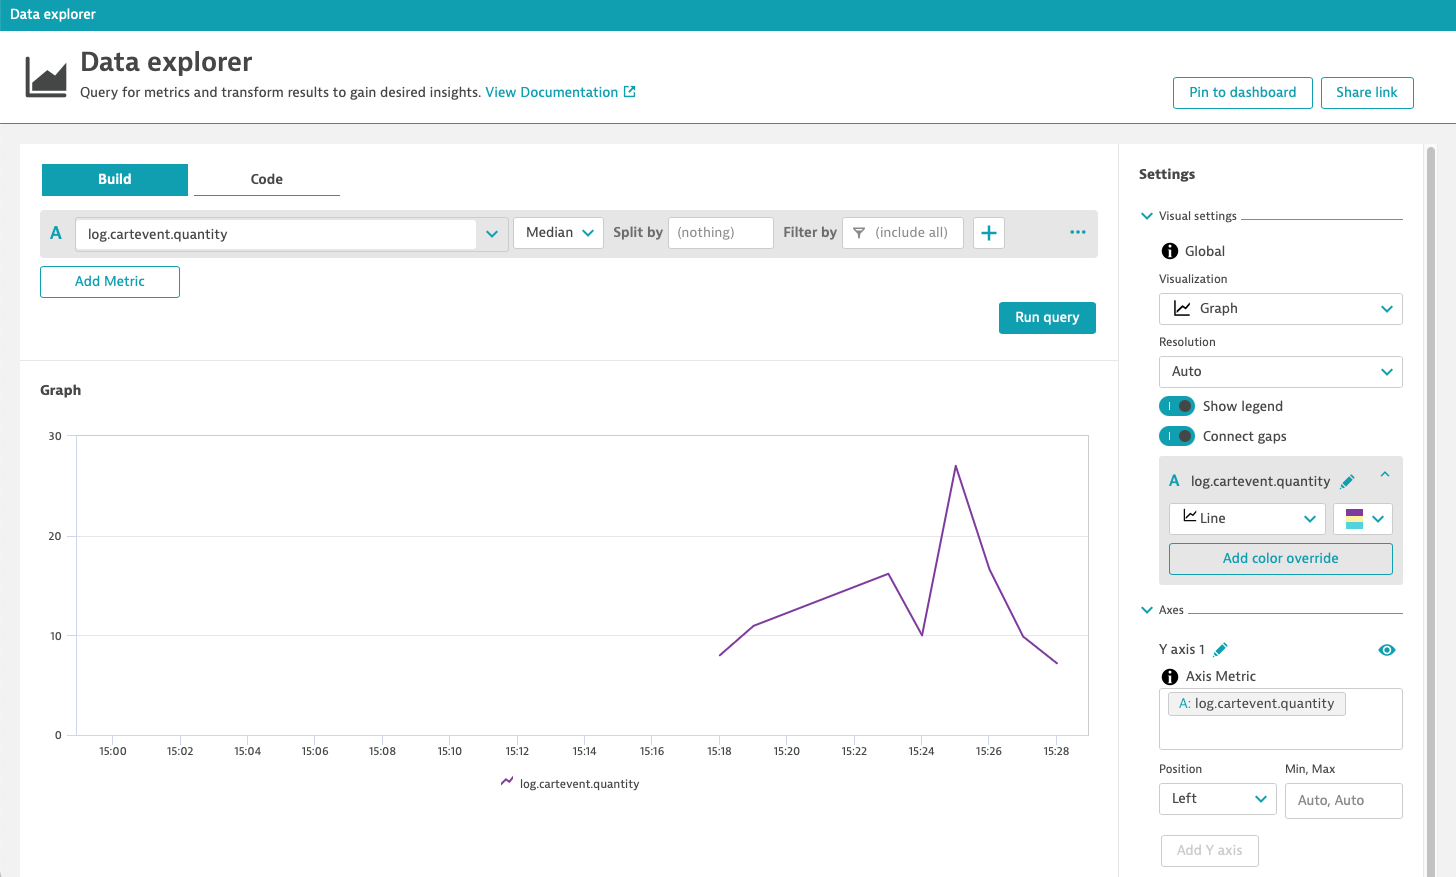
This approach drastically minimizes alert noise for DevOps teams and reduces MTTR from an incident or service degradation. In the end, this approach helps you avoid frustrated users and lost revenue.
Automated thresholds help you scale
Auto-baselining means no more manual adjustments. When you create metrics based on logs, Dynatrace platform automation kicks in. Automated multidimensional baselining learns the typical reference values of application and service response times, error rates, and traffic. All deviations are analyzed in the context of your environment topology.
Dynatrace metrics break down silos
Next, you can break down walls between data silos by analyzing log-based metrics in the context of your environment. Because Dynatrace automatically detects metrics from all monitored infrastructure and applications used in your system and allows you to add custom metrics for business context, there’s no limit to how you can combine data from across the platform into meaningful metrics.
Now you can see if a metric fluctuation correlates with infrastructure or app performance metrics, real-user behavior like rage-clicks, and business metrics, such as a declining number of conversions.
Get started today
Sign up today for a free trial or sign in if you’re already using Dynatrace. You can also check out the Log Monitoring Classic documentation for creating metrics from logs based on attribute values and ingesting logs via API.
New to Dynatrace?
If so, start your free trial today!



Looking for answers?
Start a new discussion or ask for help in our Q&A forum.
Go to forum