Customer satisfaction should always be a top priority for owners of web applications. One important aspect of customer satisfaction is a fast and highly responsive user interface. As cloud applications have become the norm, the databases that power these applications are now typically run as managed services by cloud providers. Optimizing cloud services can prove quite challenging because logs, metrics, and traces are not always put together in context, and you don’t have access to the underlying hosts. When you use Dynatrace Log Monitoring, it’s enough to forward your logs and have Dynatrace take care of the rest.
Optimize database performance
The fundamental characteristic of a database is that it’s constantly busy with user requests —not only are stored datasets changing, the queries used in web applications are also changing. Small changes in a database can have an enormous impact on overall application performance. One simple but effective way of checking high-performance databases is by analyzing the slow query log. This specific log file keeps a record of all queries that have exceeded a certain (manually) defined time threshold.
This is straightforward for on-premises environments, but when databases are run as a managed service in the cloud, access to the underlying host is normally not possible, so Dynatrace OneAgent can’t be installed. Even so, logs are normally available in cloud consoles, though effective analysis can’t be performed using logs alone.
One place to rule them all
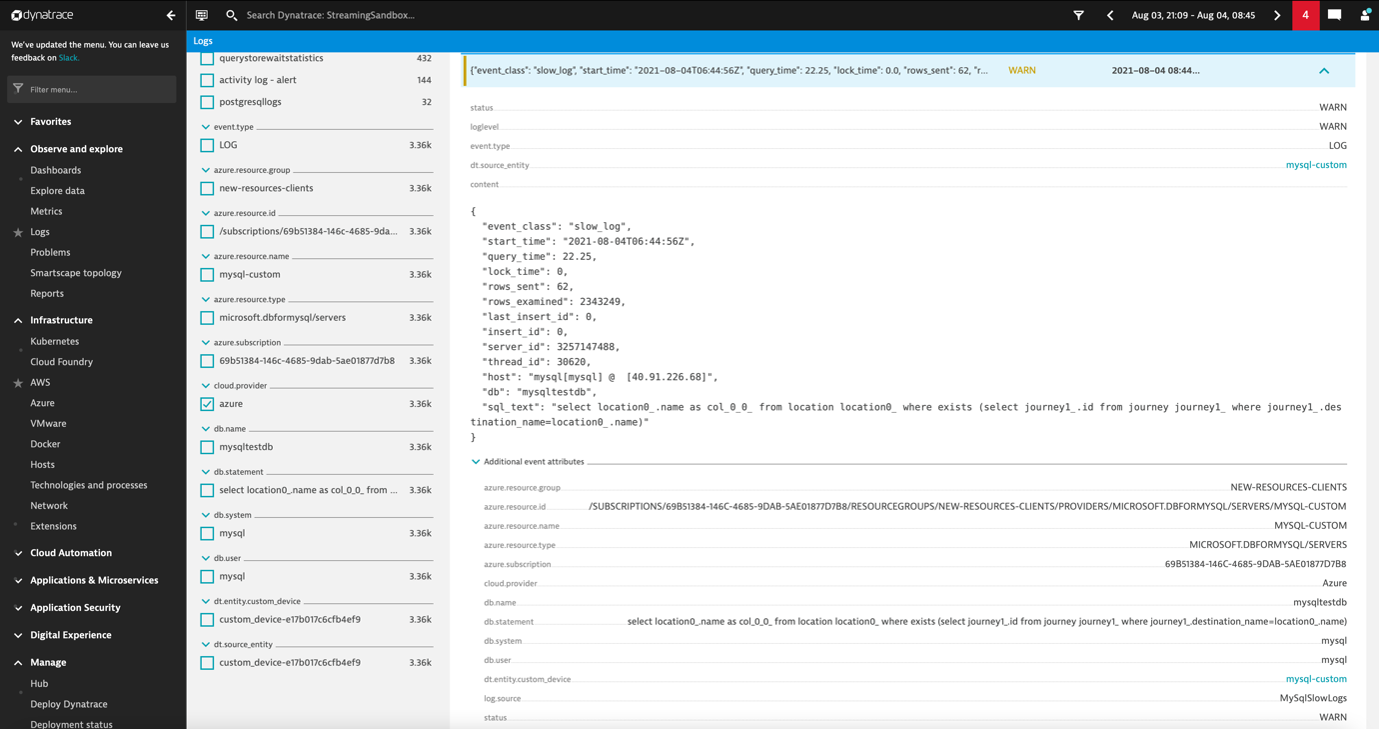
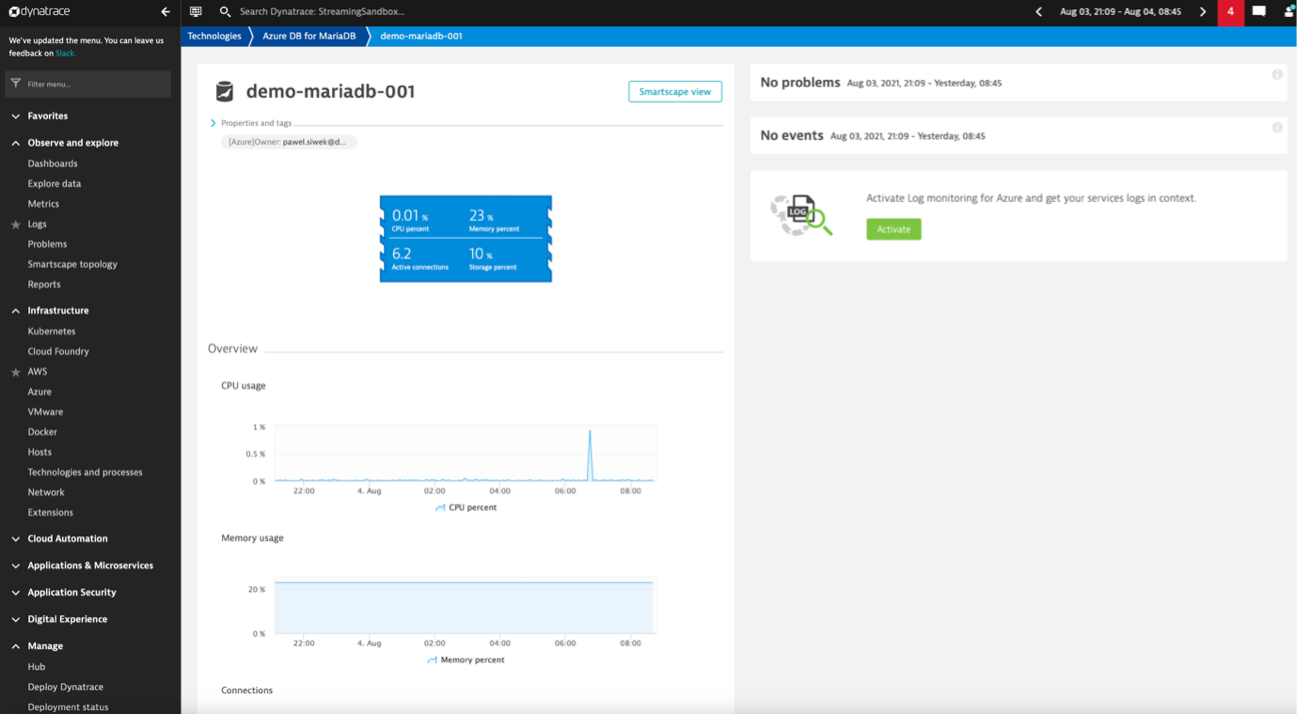
Ideally, all the data needed for a specific analysis is available in a single place: all relevant logs are already set in context with related telemetry. Having all this data extracted and readily available saves time and brings meaning to unstructured information. This is done by Dynatrace automatically after you forward your Azure services logs.
Enable agentless log ingestion
Enabling agentless log ingestion requires you to create additional resources in your Azure account. You only need to run the script that we’ve prepared. Everything is open-sourced on GitHub so it’s transparent and safe for you to use.
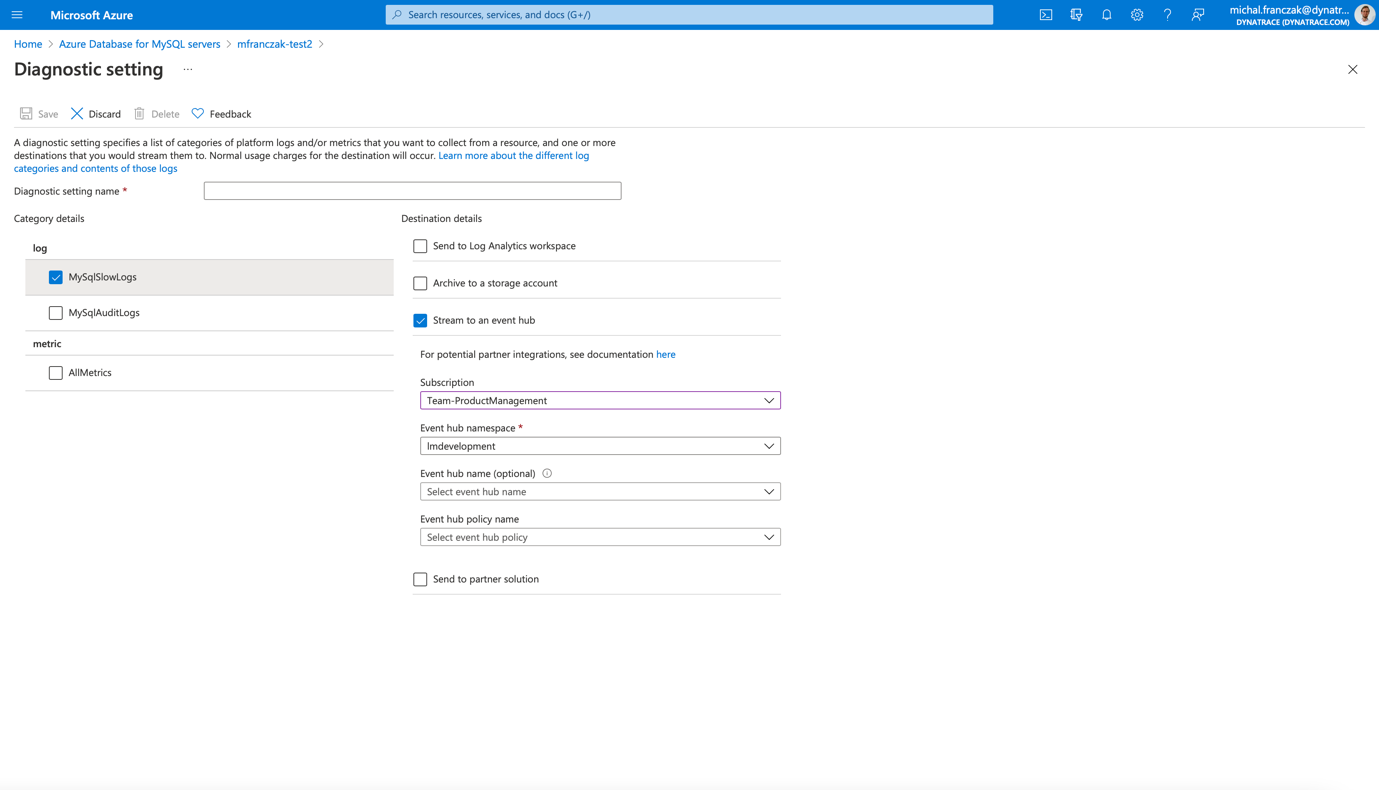
After the forwarding components are deployed, you can decide which logs to forward. In the case of the Azure Database for MySQL, you can configure slow query logging (to adjust the threshold), and in the Diagnostics settings of your database instance, you can add a setting to stream MySqlSlowLogs to an event hub. This is a great way to manage costs and get access to valuable data in Dynatrace.
Use custom metrics based on logs for constant optimization
To demonstrate the value of custom metrics in Dynatrace based on logs, let’s assume that your web application is becoming slower over time. This performance degradation is picked up by Dynatrace Davis AI, and root cause analysis is performed automatically, identifying some queries on a managed cloud service database that are slower than expected.
The slow query log is necessary for the analysis described below.
In the Dynatrace log viewer, you can filter for the slow query log entries of your database using facets and the timeframe during which the problem occurred. The problematic queries can be identified instantly and remediation actions can quickly be performed.
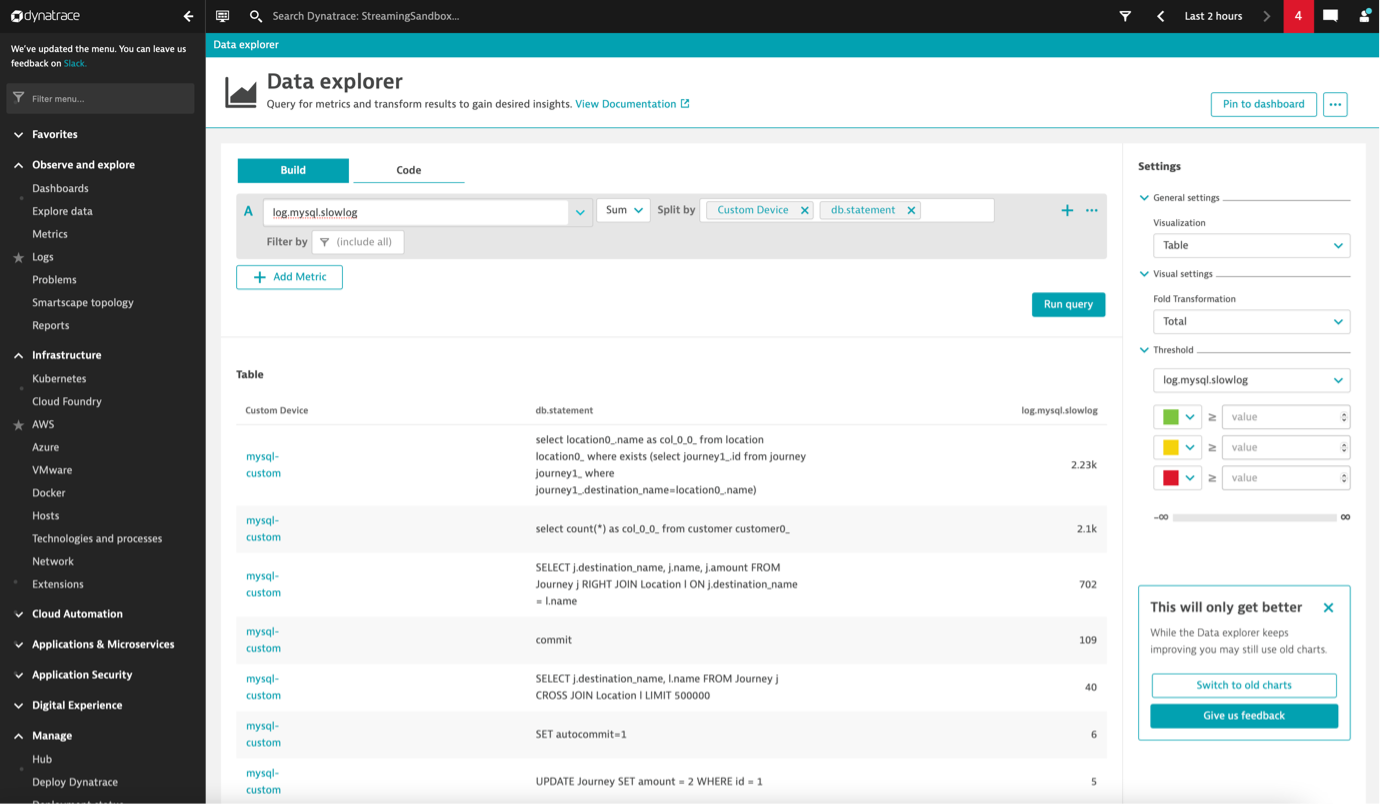
Furthermore, you can create a metric that aggregates details about your slow queries to understand which queries need to be optimized.
Log monitoring beyond cloud platform databases
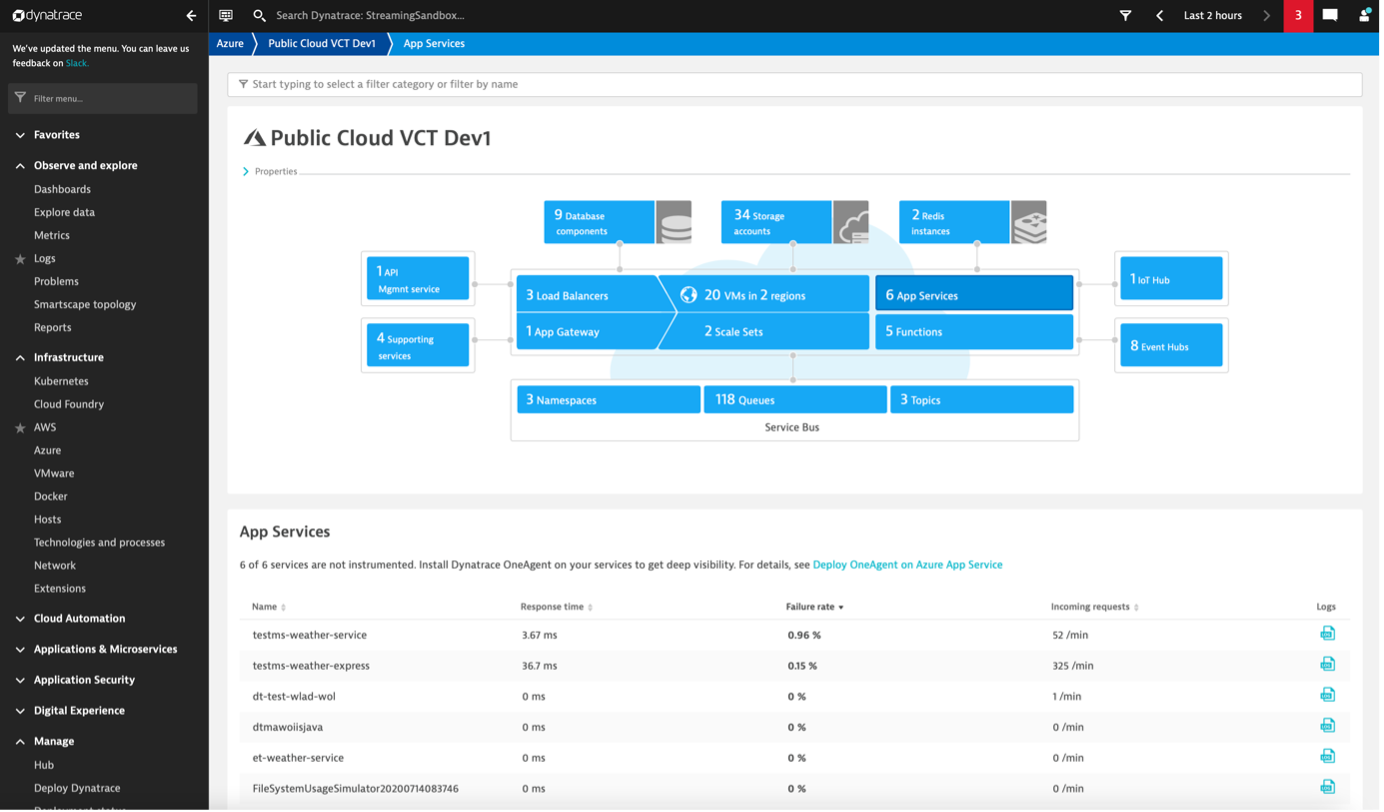
Dynatrace Log Monitoring for Azure offers more than just database logs. You can forward resource-specific logs and audit logs via the EventHub for most Azure platform services. Logs are then linked to the entities you monitor with Dynatrace for easier troubleshooting. For example, when you see a high Failure rate for your App Service, you can go directly to the log viewer by selecting the Logs icon. The log viewer automatically presets filters for your resource so that you can easily analyze the problem.
How to get started with Log Monitoring for Azure
All current Dynatrace SaaS customers can start using Log Monitoring by opting in. For details, see Log viewer documentation. Before migrating to the new Log Monitoring, we recommend that you familiarize yourself with the migration process.
To enable Log Monitoring for Dynatrace Managed, please contact Dynatrace ONE (by selecting the chat button in the Dynatrace menu bar) or your Dynatrace Customer Success Manager. The new Log Monitoring will be available for all Dynatrace Managed customers soon.
For new Dynatrace customers, Log Monitoring is available by default.
Check out our documentation on enabling Log Monitoring for Azure.
There’s even more to come!
In upcoming blog posts, we’ll announce and discuss:
- Simplified cloud services log integration.
- Custom log attributes, metrics from numerical attribute values, and log data parsing.
- Autodiscovery of log streams in Kubernetes environments (enriched with Kubernetes metadata) with additional support for Docker, CRI-O, and containerd runtimes.
- Davis events from logs—linking events across the existing topology along the cause and event chain.
Log Monitoring Classic
Log Monitoring Classic is available for SaaS and managed deployments. For the latest Dynatrace log monitoring offering on SaaS, upgrade to Log Management and Analytics.




Looking for answers?
Start a new discussion or ask for help in our Q&A forum.
Go to forum