There’s no lack of metrics, logs, traces, or events when monitoring your Kubernetes (K8s) workloads. But there is a lack of time for DevOps, SRE, and developers to analyze all this data to identify whether there’s a user impacting problem and if so – what the root cause is to fix it fast.
At Dynatrace we’re lucky to have Dynatrace monitor our workloads running on K8s. One of those workloads is Keptn, a CNCF project Dynatrace is contributing to, that we use internally for different SLO-driven automation use cases.
Dynatrace Davis, our deterministic AI, recently notified our teams about a problem in one of our Keptn instances we just recently spun up to demo our automated performance analysis capabilities orchestrated by Keptn. I was pulled into that troubleshooting call and started taking notes and screenshots so I can share how easy it is to troubleshoot the Kubernetes workload with our engineers and you – our readers – on this blog post.
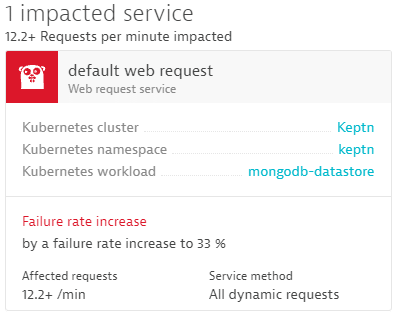
It started with the Problem card Davis opened because of a 33% increase in failure rate in the workload called mongodb-datastore.

This mongodb-datastore provides several internal API endpoints to fetch/update data in the actual MongoDB instance. What’s great for our engineers who are responsible to operate Keptn is that alerting happens automatically, without relying on us to define custom thresholds. This is all thanks to Dynatrace’s automatic adaptive baselining.
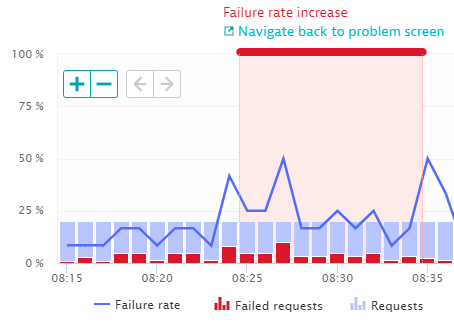
How the baselining identified the problem can be easily seen with a single click from the problem to the service response time overview as shown next:

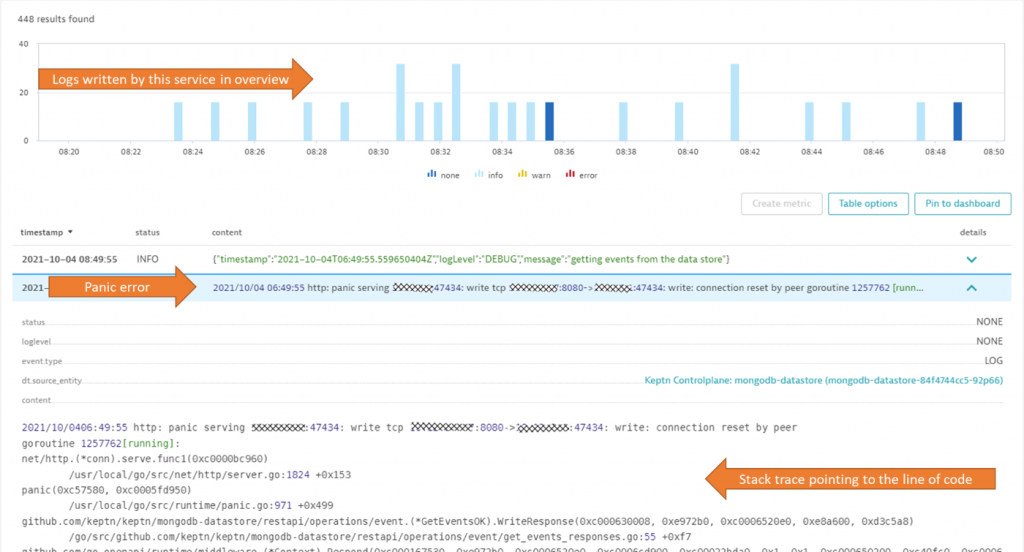
What’s even better than Davis detecting the increase in failure rate is that Davis automatically points to the root cause, which Dynatrace picked up from automatically captured container logs. A single click brought us to the Log screen – automatically filtered to the logs captured in that mongodb-datastore during that timeframe:

If you take a closer look at the screenshot above it’s easy to spot the root cause; it was an unhandled error condition in the code that was waiting and processing feedback from the MongoDB instance. The problem was also reported back to the Keptn team via GitHub issue mongodb-datastore: Panics, meaning the team could not only detect the issue fast but also had everything they needed to react fast and immediately fix the problem.
Dynatrace has even more details for the development teams
Just from spending two minutes looking at the data Davis put in front of us, we knew the Impact and Root Cause of the high error rate (including the line of code). I went ahead and took additional screenshots that I sent over to the engineers on top of the direct links to the Dynatrace screens so that they can do their own analysis. Screenshots are however always great as I think they are interesting for the engineers and make my life in writing those blogs easier 😊
One of those screenshots is from one of the PurePaths (=Distributed Traces) that captured the problem. Not only do we have the detailed log, but we also know the API endpoint was the HTTP GET /event.

There’s so much more Dynatrace provides than what’s shown here, but I wanted to keep this blog short and sweet and focus on that one story.
If you’re interested in learning more, I recommend you check out these articles:
- Why DevOps love Dynatrace CodeLab Tutorials by Sergio Hinojosa
- Engineering Blogs from Thomas Schütz on Infrastructure and App deployment automation and Redesigning Microservice deployment strategies
As always – these blog posts wouldn’t be possible if my colleagues wouldn’t share those stories. Thanks a lot Sergio Hinojosa and Maria Rolbiecka for your hard work on keeping this Keptn instance up and running! And a big Thank You to Florian Bacher and Bernd Warmuth from the Keptn development team who went ahead and fixed that issue within a day – now that’s a fast turnaround 😊


Looking for answers?
Start a new discussion or ask for help in our Q&A forum.
Go to forum