Dynatrace now provides two new extensions to assist teams that face the challenges associated with operating self-managed OpenShift Container Platform installations. The OpenShift Control Plane extension offers a concise overview of OCP control plane component states and includes essential alerting for all components. The etcd for OpenShift extension comprises an out-of-the-box dashboard that gives you all the insights needed to check the health status and performance of etcd.
Friends don’t let friends go down the DIY rabbit hole
Many companies are adopting Kubernetes as their main application runtime for the many benefits it provides, including automated scaling, self-remediation, rolling updates, and much more. A key problem is that the teams operating the platform have a hard time setting up and operating clusters at scale in a production-safe fashion. While many large-scale environments use OpenShift Container Platform (OCP) as their Kubernetes distribution of choice, teams typically still lack intelligent observability and centralized alerting despite the monitoring system included with the platform. This results in performance issues or even downtime that could easily be prevented.
For self-managed OCP operators, it’s particularly important to understand the health and performance of the platform’s control plane. Issues with the control plane could leave the platform in an unpredictable and uncontrollable state. Worse, it could lead to long downtimes of all applications running on those clusters, potentially resulting in financial losses for the company.
To avoid such situations, operations teams often stitch together multiple tools to set up a DIY (Do-It-Yourself) monitoring solution. Very often, this requires countless hours of work and comes with a frequently underestimated set of ongoing maintenance responsibilities. Teams walking down this exhausting path typically realize too late that, in the end, they’re still missing urgently needed context and integrated authorization systems. Furthermore, without automation and AI, they find themselves drowning in endless maintenance of their DIY solution while still missing correlations between anomalies in related parts of the system.
Our new extensions save you from the exhausting do-it-yourself approach
Famous for providing out-of-the-box solutions, automation, and smart context across the entire application infrastructure with our unique Davis AI, Dynatrace now delivers two new extensions to assist teams that face the challenges associated with operating self-managed OCP installations.
Control plane
Technically speaking, the OCP control plane comprises several components that work together to manage the entire cluster. It’s therefore of utmost importance that every component do its job flawlessly. The following components make up the OCP control plane:
- API server: Tracks the state of all other components and takes care of communication within and outside the cluster.
- Controller Manager: Runs controllers such as the node controller responsible for handling node availability.
- Scheduler: Places unscheduled workloads on suitable worker nodes.
- etcd: Persists all the states and configuration of the entire Kubernetes platform.
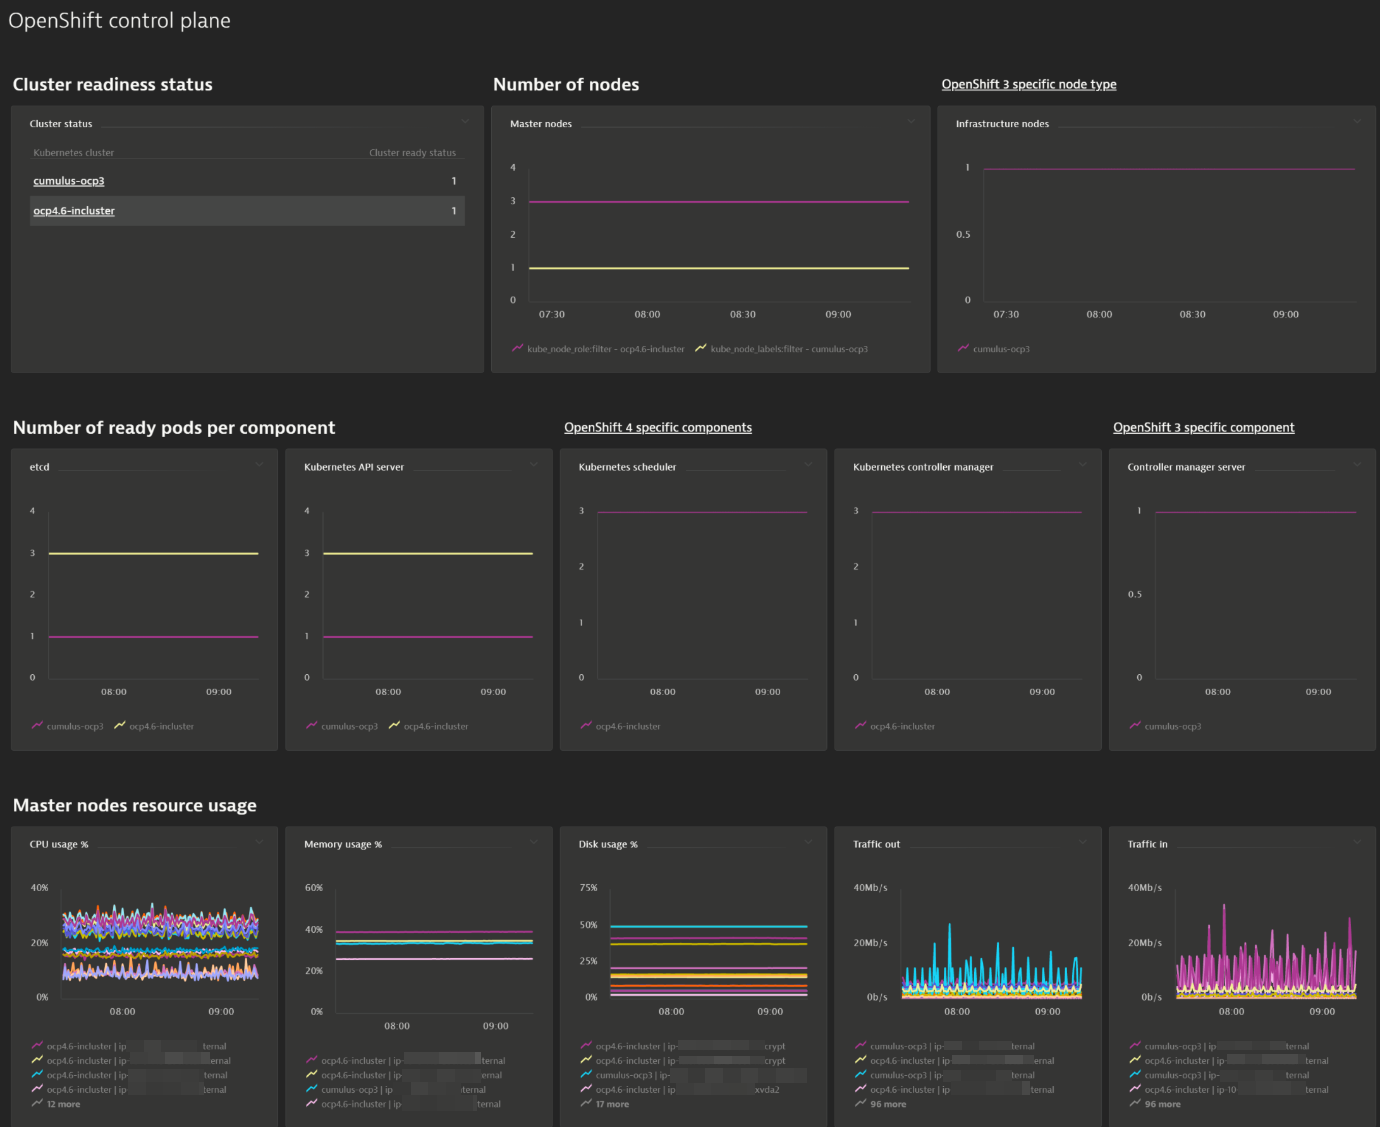
The newly released Dynatrace OpenShift Control Plane extension offers a concise overview of OCP control plane component states and includes essential alerting for all components.
The included dashboard is split into three main areas, displayed as rows. The first row shows cluster readiness as well as the number of master, worker, and infrastructure nodes. The second row charts the number of ready instances of each control plane component, while the resource utilization of the master nodes is displayed in the last row.

You don’t have all day to eyeball multiple dashboards. That’s why we’ve also included preconfigured alerts that draw your attention to the dashboard only when necessary. The list of alerts includes, but is not limited to, alerts on the state of readiness of the cluster and individual control plane components. Of course, you can also create your own custom alerts based on any metric displayed on a dashboard.
etcd
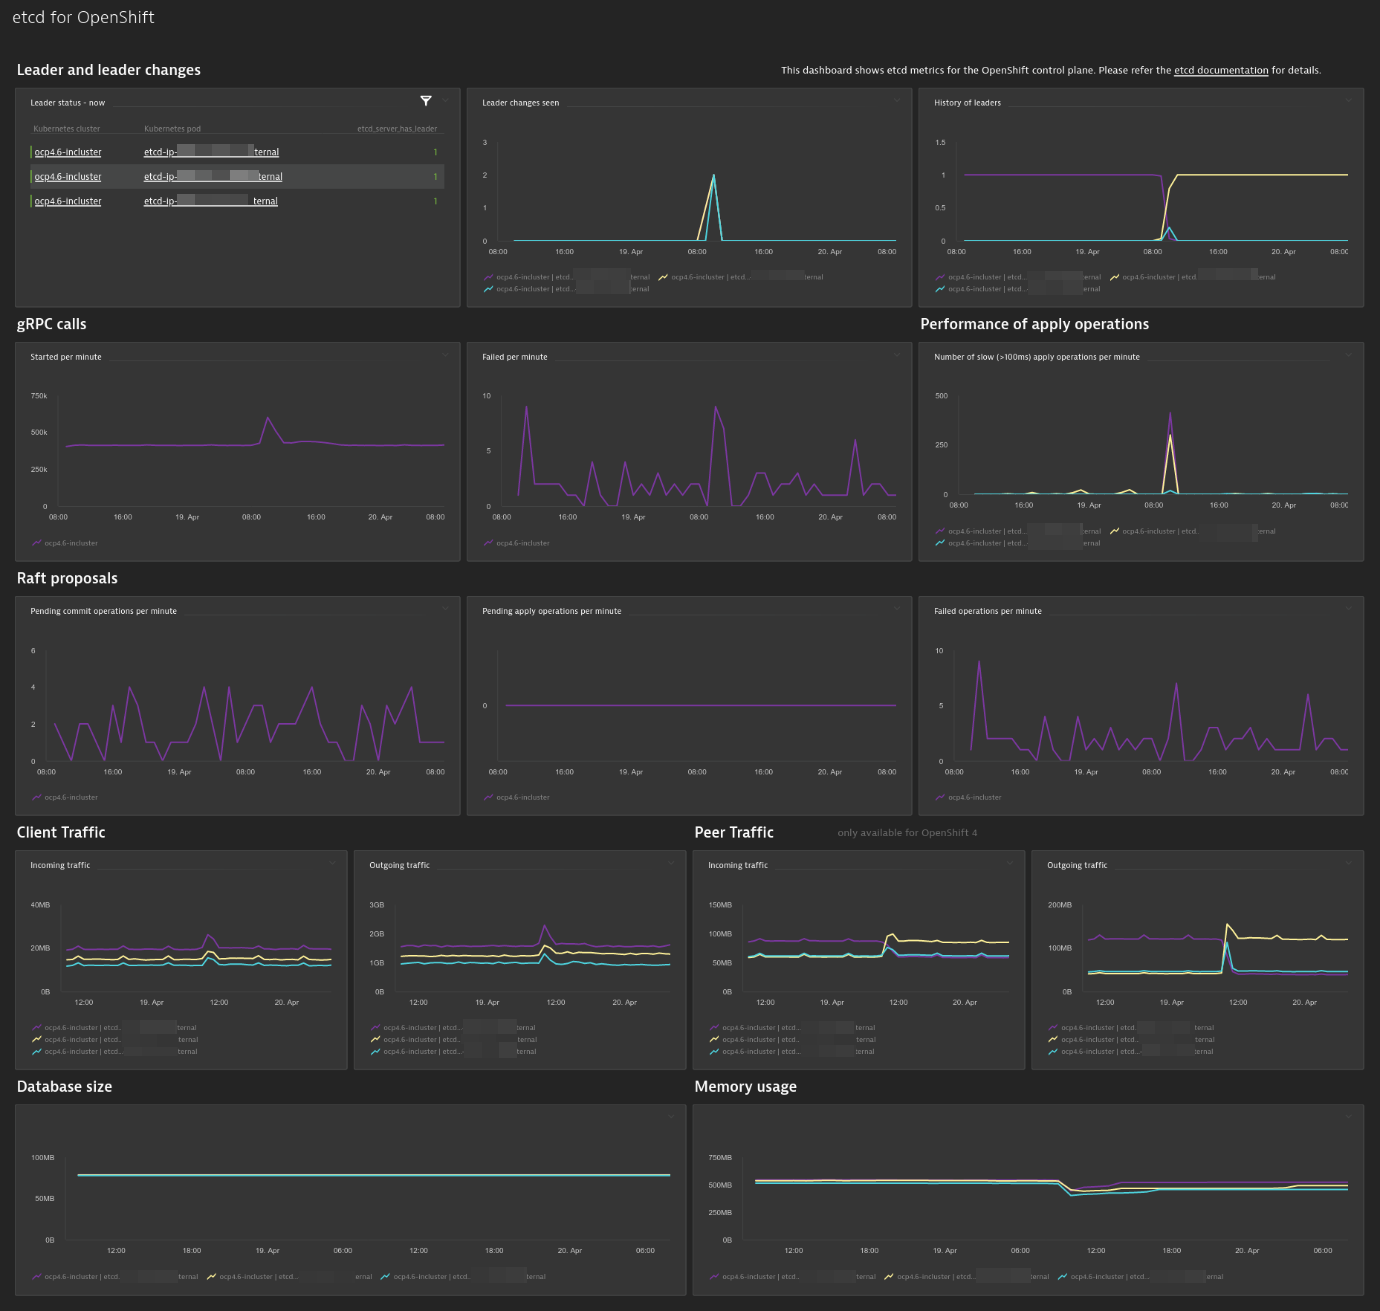
As etcd persists the entire state of the OpenShift platform and thus represents the brain of the control plane, operators usually pay special attention to this critical component. That’s why we’ve released an additional extension that provides you with detailed insights into this component. The Dynatrace etcd for OpenShift extension comprises an out-of-the-box dashboard that gives you all the insights you need to check the health status and performance of etcd. Among other things, the dashboard allows you to verify a stable leader, check the current RPC rate, and investigate the current state of Raft proposals.

Of course this extension also comes with preconfigured alerts. For example, for an etcd cluster to work properly, there needs to be one leader that takes care of keeping the cluster in sync. So we’ve included an alert that’s triggered whenever any member of the cluster is missing its leader.
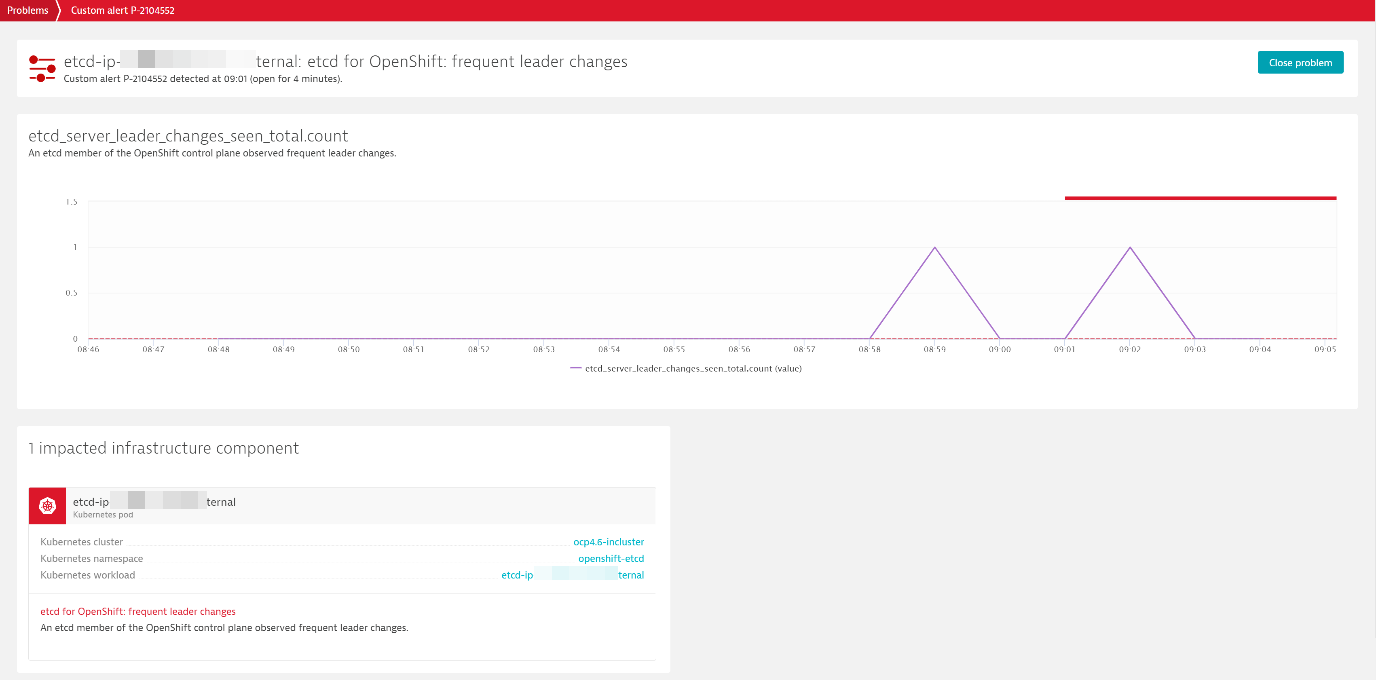
It’s also good to know that etcd changes the leader only when issues arise; frequent leader changes are an early warning of possible upcoming threats. To enable you to investigate such situations so you can prevent a potential outage, the etcd for OpenShift extension notifies you about frequent leader changes, as shown in the example below.

Use the links to the cluster or workload pages on the problem card to navigate quickly to more specific information for troubleshooting the problem at hand.
Technically, both extensions build upon the ability to scrape OpenMetrics (Prometheus format) in Dynatrace from any service or pod within Kubernetes.
How to get started
Starting with ActiveGate version 1.223, you can enable both extensions via the Dynatrace Hub. Simply go to Hub in the Dynatrace menu and search for “OpenShift.” All the steps for enabling the extensions are explained in the details of each extension. If you’re not yet a customer of Dynatrace, feel free to check out the public page for these extensions in our Software Intelligence Hub.
What’s next?
Of course, these extensions are just a first step towards full observability for the Kubernetes control plane. In upcoming releases, we plan to enhance the OpenShift Control Plane extension with more detailed insights into individual control plane components.
Besides this, we’re currently in the process of overhauling many of our Kubernetes-specific pages to provide you with more insights for troubleshooting (for example, enhanced integration of events and logs), and the initial updates are already being released.
As we constantly strive to make your job as easy as possible, we’re currently also overhauling the setup process of our Kubernetes monitoring so it’s more cloud native and is better fitted to adhere to security best practices in the near future. For example, we’ve recently released our new Dynatrace Operator for Kubernetes.


Looking for answers?
Start a new discussion or ask for help in our Q&A forum.
Go to forum