We’re excited to announce Dynatrace has been named as a select launch partner for a newly launched Amazon Web Services (AWS) offering, Amazon Elastic Kubernetes Service Anywhere (EKS). With Amazon EKS Anywhere and Dynatrace, users now have the same consistent management and advanced observability for your on-premises hardware as you do with Amazon Cloud Managed Kubernetes.
What is Amazon EKS?
Amazon EKS is a managed service that organizations can use to run Kubernetes on AWS without the need to install, operate, and maintain their own Kubernetes control plane or nodes. It gives users the flexibility to start, run, and scale Kubernetes applications in the AWS Cloud or on-premises, in addition to helping enable you to provide highly available and secure clusters and automates key tasks.
EKS is designed with AWS best practices for security, scalability, isolation of failure domain, and fault tolerance. It is highly scalable and built to meet the demands of production workloads.
EKS seamlessly integrates with AWS native services. You can ship logs to Amazon CloudWatch and configure alerts. Ingress with the AWS Load Balancer Controller and implement security and access controls with integrations to Amazon Identity and Access Management (IAM) and leverage services such as IAM Roles for Service accounts or use other AWS security and encryption services such as Key Management Service (KMS).
What is EKS Anywhere?
Amazon EKS Anywhere is a new deployment option for Amazon EKS, enabling customers to easily create and operate Kubernetes clusters on-premises virtual machines.
The primary goal of EKS Anywhere is to provide an EKS-like experience to customers that need to deploy and operate Kubernetes on their own hardware. Customer requirements for this include:
- Existing investments need to be depreciated
- Governance necessitates customer-owned hardware and tooling
- The regulation requires maintaining root access
- Data Residency requirement for data to be stored in a specific geographical location
- Low Latency application requirements
To accomplish this, EKS Anywhere provides an opinionated bundle of tooling to assist with differences in how on-premises environments are configured as compared to the cloud. Amazon minimizes the friction customer may have as they move workloads onto Kubernetes by delivering the same operational models and tooling for automation, deployment, and security controls between on-premises and cloud. As a result, EKS brings operational consistency and cost of operating Kubernetes.
How does Dynatrace work alongside Amazon EKS Anywhere?
As Kubernetes adoption continues to grow it becomes more important than ever to simplify the activation of observability across workloads without sacrificing the deployment automation that Kubernetes provides. Observability should be as cloud-native as Kubernetes itself.
In just a few minutes, you can deploy the Dynatrace Kubernetes Operator to new or existing EKS Anywhere clusters to extend visibility into workload and cluster health and deep code-level visibility into the performance of Kubernetes pods. As its name suggests, the Kubernetes Operator is built to deploy, configure, maintain, and upgrade Dynatrace full-stack observability of the Dynatrace OneAgent across Kubernetes clusters.
Typical Setup
EKS Anywhere runs within your datacenter and Dynatrace can be deployed either as a SaaS solution, with the option of retaining data in the AWS, or within a customer-managed version called Dynatrace Managed. Refer to the diagram and numbered descriptions below for components of a typical implementation.
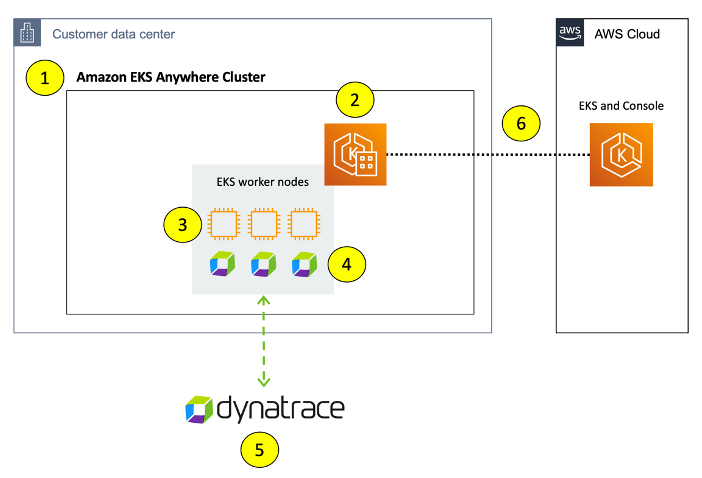
- Amazon EKS Anywhere Cluster installed within your data center based on Amazon EKS Distro
- Amazon EKS Distro, the same Kubernetes distribution used by Amazon EKS for clusters on AWS
- EKS Anywhere Cluster worker nodes
- Dynatrace Operator running within a dedicated namespace that manages the OneAgent lifecycle for worker nodes.
- Dynatrace SaaS or Dynatrace managed environment
- The fully connected connectivity option lets you leverage an integrated dashboard in the AWS console for connecting, visualizing, and troubleshooting Kubernetes clusters and applications running anywhere
Dynatrace Kubernetes Support
Below are a few benefits you reap with the Dynatrace Operator running on any EKS Anywhere cluster.
#1 Infrastructure and cluster health
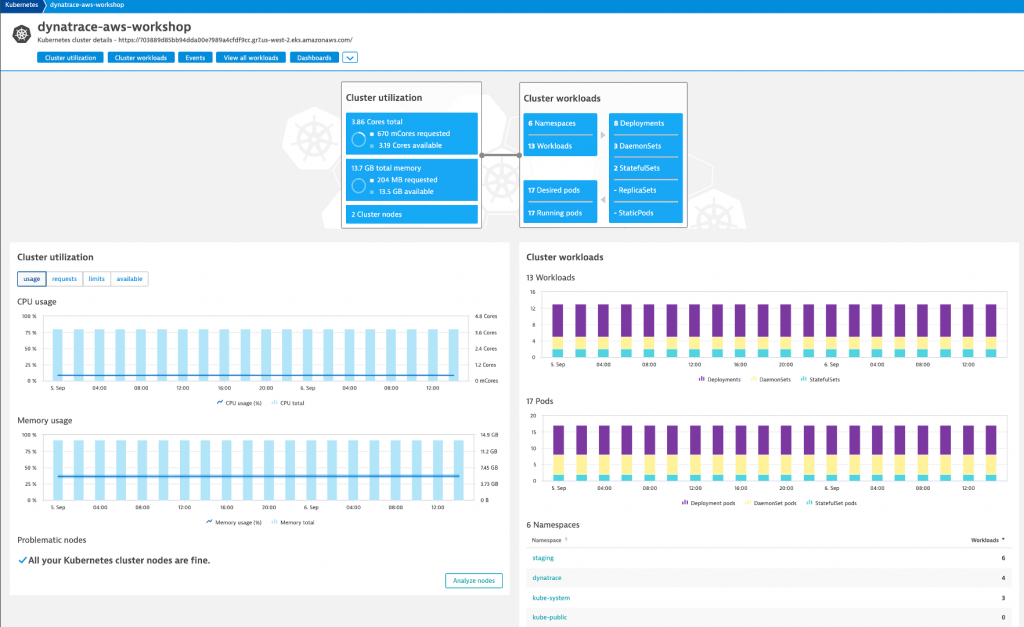
Dynatrace supports full-stack monitoring from the application to the operating system layer using OneAgent. When OneAgent is installed it automatically collects all relevant monitoring data, including load metrics, memory consumption, and logs—with no configuration required. And, by providing Dynatrace access to the Kubernetes API additional insights are also possible such as event tracking and over-commitment rate (resource requests vs. resources available). Dynatrace provides an out-of-the-box Kubernetes dashboard, shown below, for each cluster for a summary view of the cluster, workloads, events, and cluster security vulnerabilities.
#2 Native Kubernetes Events
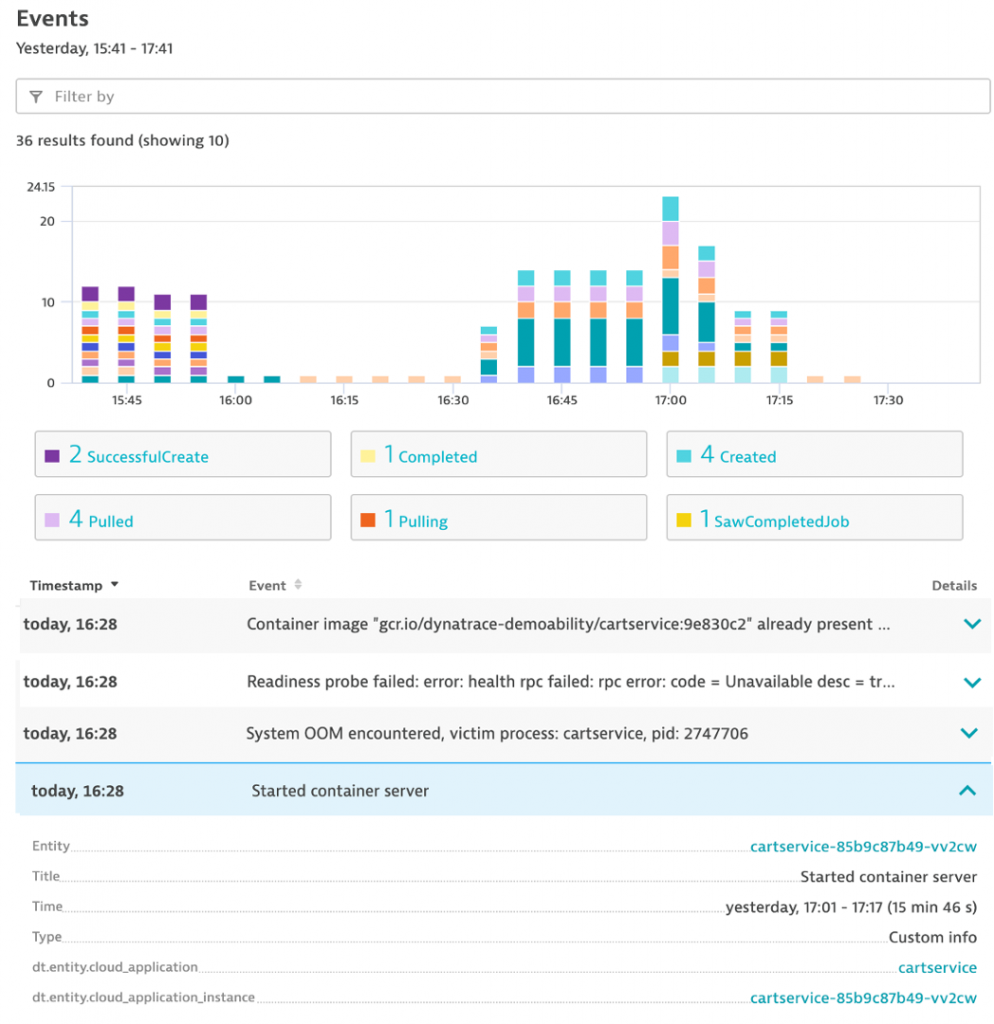
could be from a state change of a node, such as an eviction threshold being met and the kubelet attempting to reclaim memory, or from workloads go through different phases of their life cycles.
Within Dynatrace, these events can be filtered using multiple field selectors and build compound expressions for each Kubernetes environment and are shown on the Kubernetes dashboard as shown in the example below.
#3 Workload and container monitoring
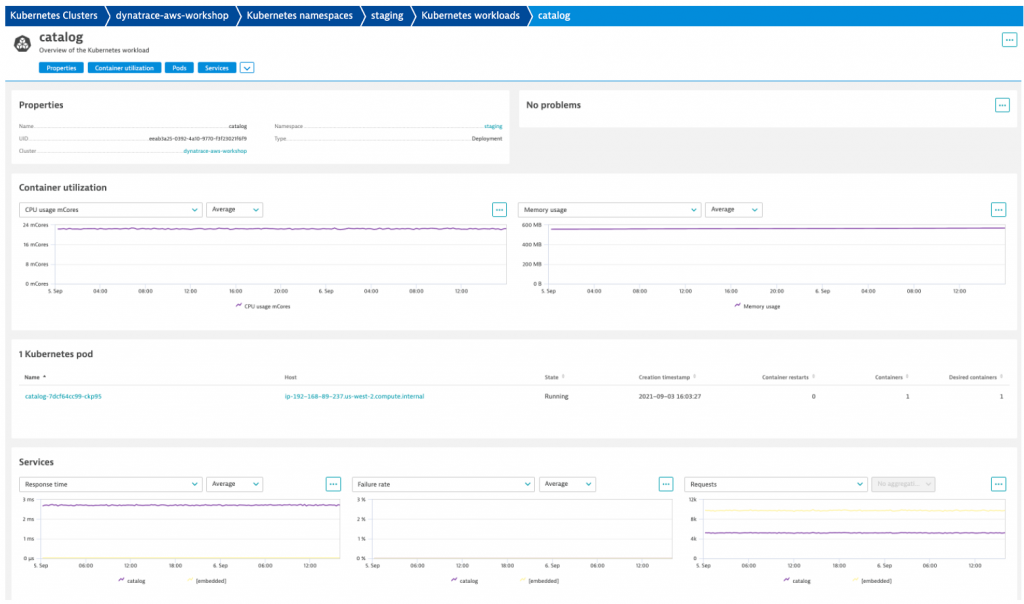
Monitoring containers is inherently challenging due to their highly dynamic nature. With the Dynatrace OneAgent you don’t need to know what’s running in every container, and you don’t need to modify container images or code. Just install the OneAgent and Dynatrace does the rest. Below is an example out-of-the-box workload analysis view that provides insights into resource utilization, problem detection, vulnerabilities (if you have Application Security enabled), number of pods in the respective workload, number of services that are sending traffic to the pods, and events for all of the pods in a given workload. This information is valuable for analyzing the overall performance of a microservice rather than looking at specific problems in a pod instance.
#4 Davis
The Dynatrace AI engine, Davis®, automatically processes billions of dependencies in real-time, continuously monitors the full stack for system degradation and performance anomalies, and delivers precise answers with root-cause determination, prioritized by business impact. This multiplies teams’ productivity by enabling them to spend less time troubleshooting, and more time innovating and driving better business outcomes.
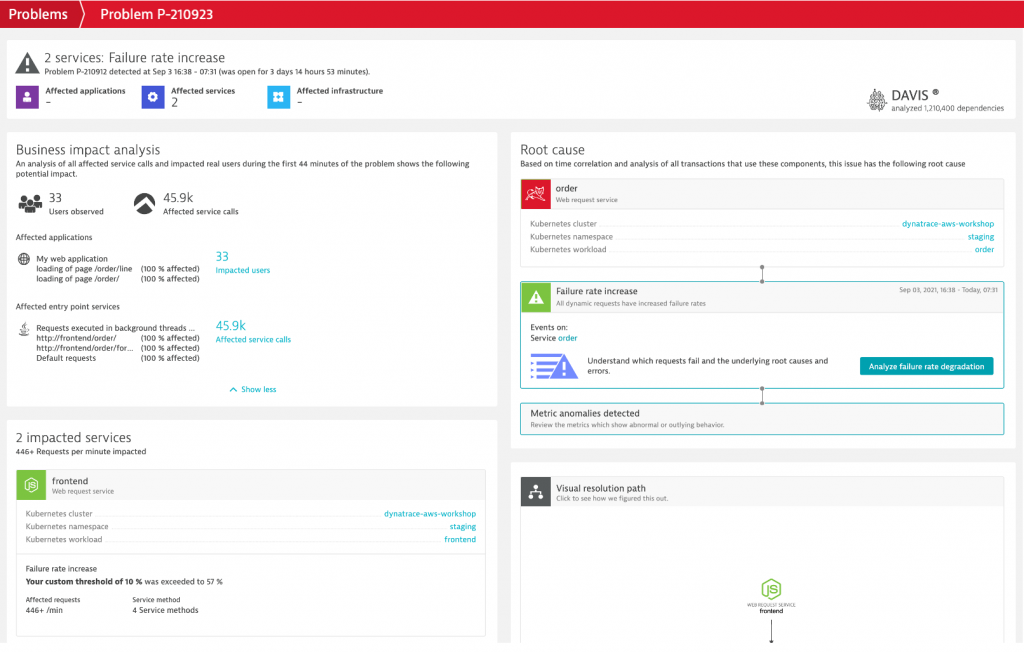
Dynatrace-detected problems are used to report and alert on abnormal situations, such as performance degradations, improper functionality, or lack of availability. Problems have defined lifespans and are updated in real time with all incoming events and findings. Once a problem is detected, it’s shows as a. Below is a problem for the order service from the previous example that is showing user and business impact, problem duration, impacted services with the Kubernetes details, and the root cause issue.
#5 Prometheus Metric Ingest
Prometheus has become the dominant metric provider in the Kubernetes space and Dynatrace supports bringing these Kubernetes pod metrics into the larger context of the microservices and pods, and allowing for enhanced alerting with auto-adaptive baselining of these metrics. The metrics automatically feed into Dynatrace AI driven alerting and root cause analysis and are available for further analytics. The following example is a chart for the redis_commands_duration_seconds_total metric for all Redis pods and split the metric by the dimension cmd.
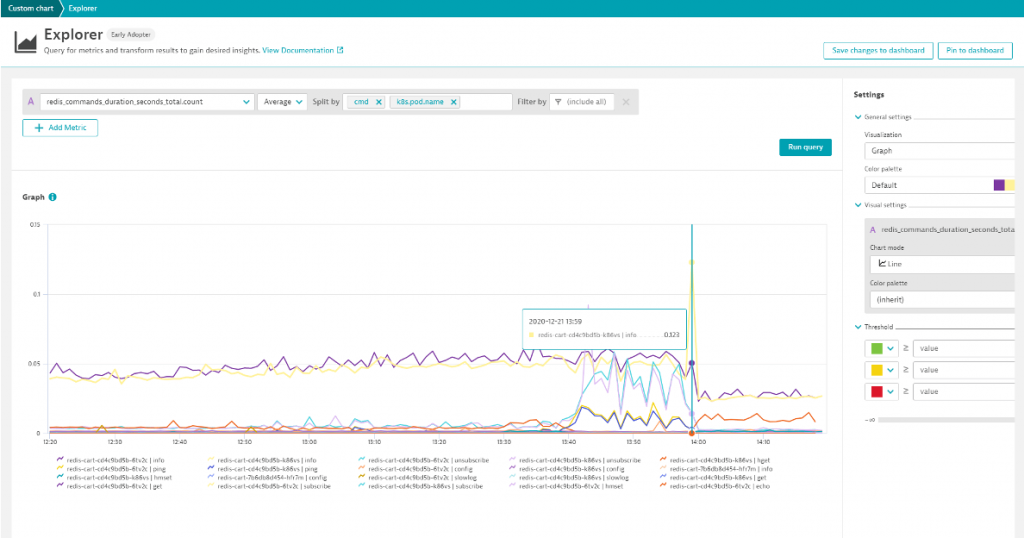
Charts can easily be pinned to dashboards and thus provide an instant overview of all important metrics. When metrics are displayed on dashboards, management zone filtering is applied automatically so that team members only have visibility into those metrics that they are authorized to view.
Resources
Getting started with Dynatrace and AWS EKS Anywhere has never been easier.
- Refer to our EKS monitoring documentation for more detailed information.
- Existing Dynatrace customers can reach out to their DynatraceOne team or if you’re new to Dynatrace, sign up for a Dynatrace trial for free.



Looking for answers?
Start a new discussion or ask for help in our Q&A forum.
Go to forum