Many software delivery teams share the same pain points as they’re asked to support cloud adoption and modernization initiatives. These include spending too much time on manual processes, finger-pointing due to siloed teams, and poor customer experience because of unplanned work. These problems are the drivers behind Dynatrace’s solution offering called Cloud Automation and this two-part blog series shows how to tackle these problems using GitHub Actions.
Specifically, some of the cloud automation capabilities we will review in more detail include:
- Release version awareness – Automatic and configurable detection rules for component versions.
- Release inventory and analysis – Automatic detection of deployed components and applications as well as a complete audit for each deployment and configuration change.
- SLO validation – Automatically collect and evaluate business, service, and architectural indicator metrics to promote or roll back deployments.
Topics in this blog series
Part 1 of this series will cover the key ingredients needed for successful 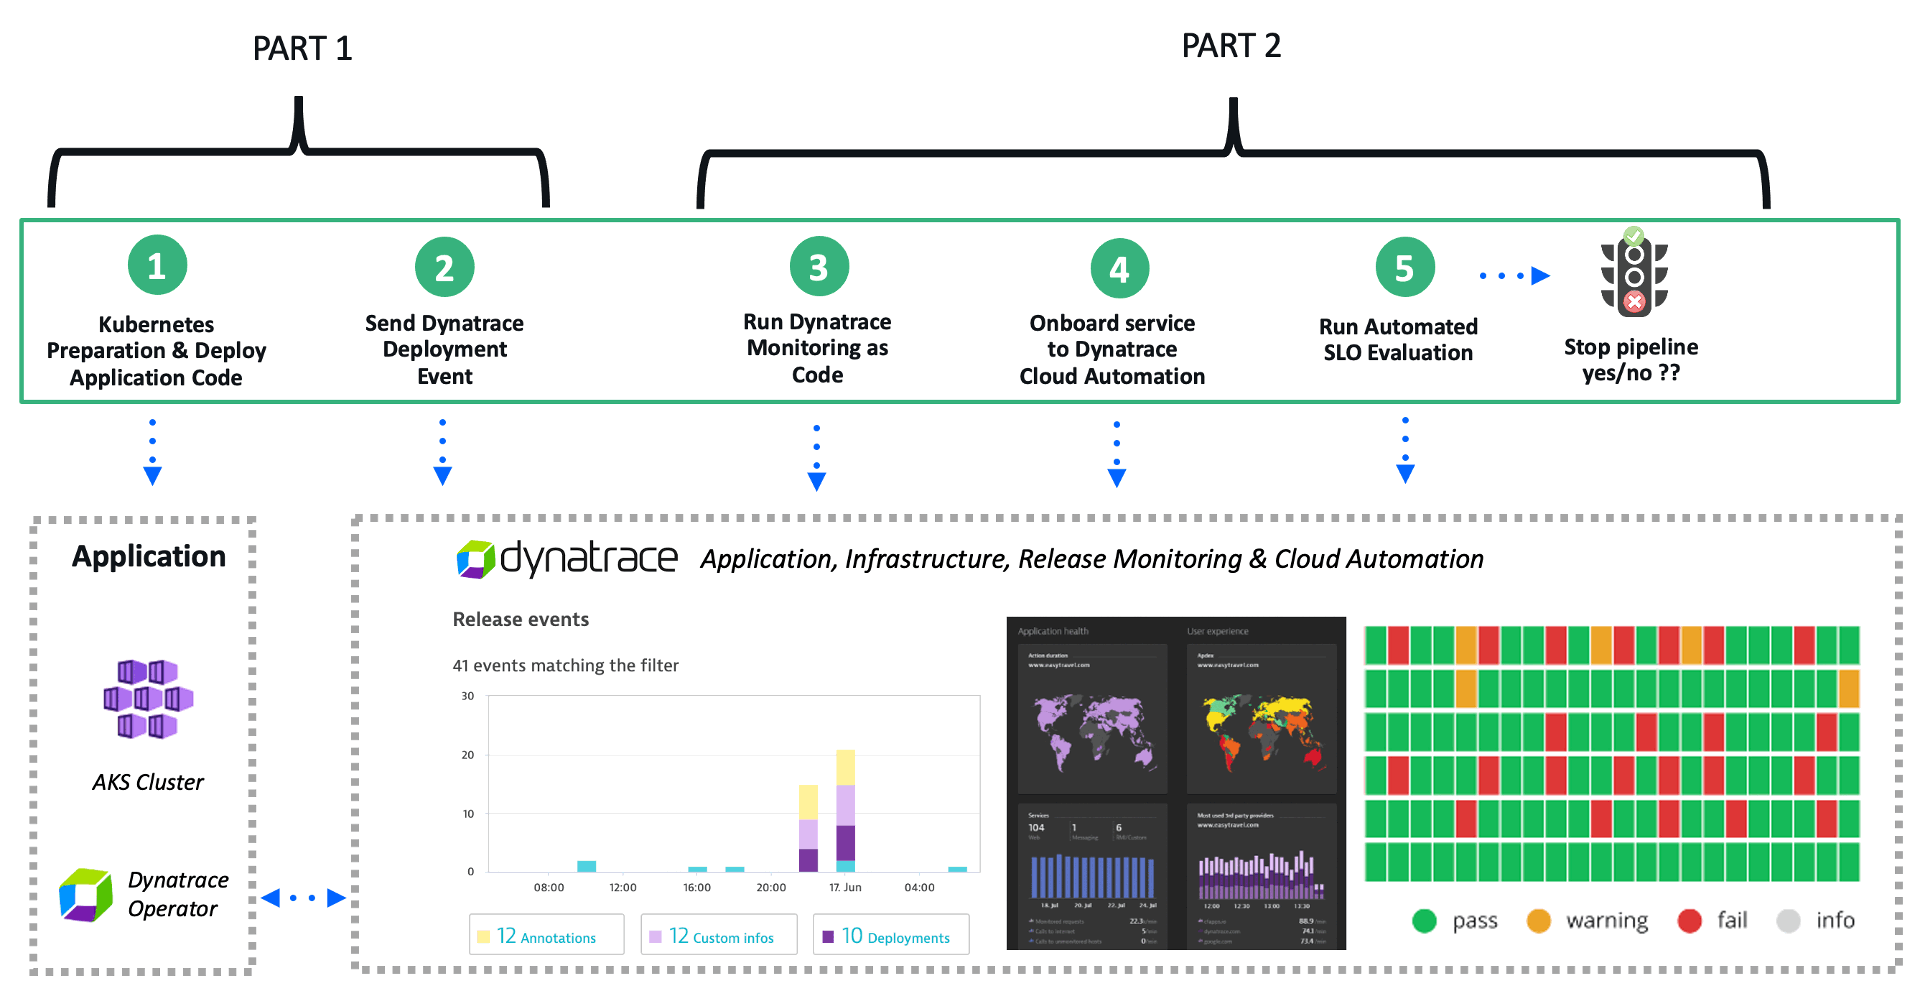
Key ingredients required to deliver better software faster
Successful DevOps teams have figured out that “delivering more with less” requires careful management of release risks and automation to scale. Here are a few areas teams are prioritizing:
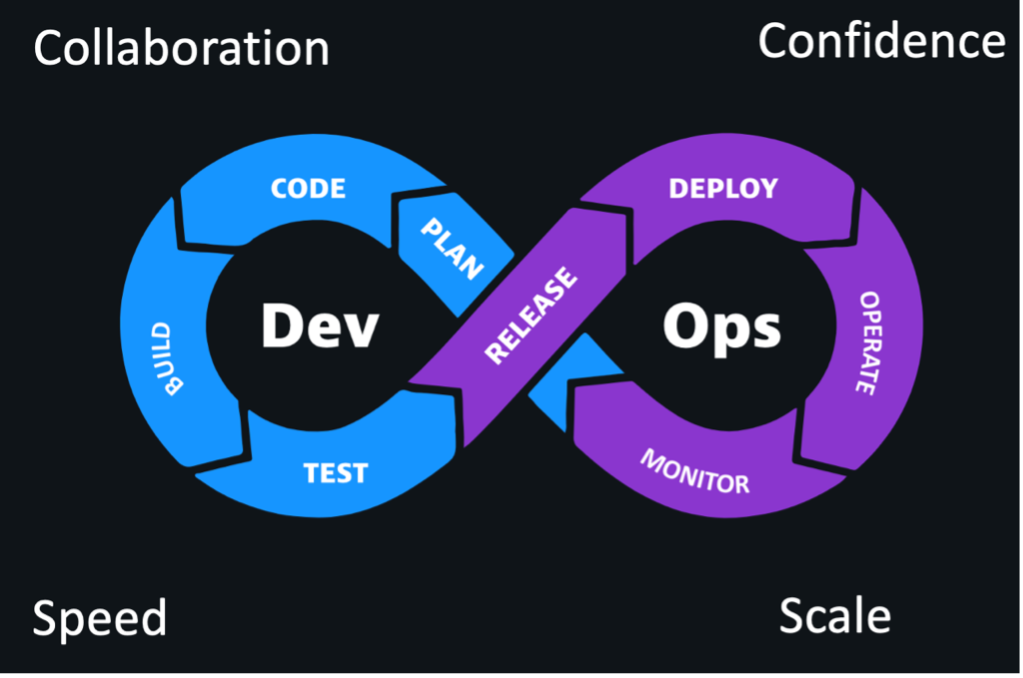
#1 Collaboration
- Developing a shared language of service level objectives (SLOs).
- Keeping business stakeholders in the loop with end-to-end observability with deep insight and continuous feedback loops
#2 Confidence:
- Automating SLOs with quality gates and release verification (Shift-left)
#3 Speed:
- Eliminating toil through automation and optimizing flow and integration
- Automating lifecycle orchestration including monitoring, remediation, and testing across the entire software development lifecycle (SDLC)
- Automating self-healing and auto-remediation enabling risk-free releases
# 4 Scale:
- Providing standardized self-service pipeline templates, best practices, and scalable automation for monitoring, testing, and SLO validation
- Leverage AI-driven decision making and leveraging standardized pipelines
GitHub and GitHub Actions
Microsoft’s GitHub is the largest open-source software community in the world with millions of open-source projects.
Since becoming General Availability in the fall of 2019, GitHub Actions has helped teams automate continuous integration and continuous delivery (CI/CD) workflows for code builds, tests, and deployments. And, to accelerate GitHub Action adoption, GitHub also provides the GitHub Marketplace where developers and organizations, like Dynatrace, share apps and Actions publicly with all GitHub users.

Now let’s review how GitHub and Dynatrace integrate with a combination of out-of-the-box and open-source integrations to automate the orchestration of code delivery, deployment, and remediation across the pipeline to achieve faster time-to-value.
Example #1 – Deploy application code to Kubernetes
Since Kubernetes emerged in 2014, it has become a popular solution for scaling, managing, and automating the deployments of containerized applications in distributed environments. Architects and operations teams are adopting Kubernetes as it simplifies the operation and development of distributed applications by streamlining the deployment of containerized workloads and distributing them over a set of nodes. However, with this adoption comes the need to simplify deployments and observability across all containers controlled by Kubernetes.
Kubernetes deployments can be managed using a combination of both the open-source Azure Kubernetes set context Action and Kubernetes deployment GitHub Action. The set context action established the credentials to connect to the cluster. Then the deployment action deploys the container image defined in the Kubernetes manifest file.
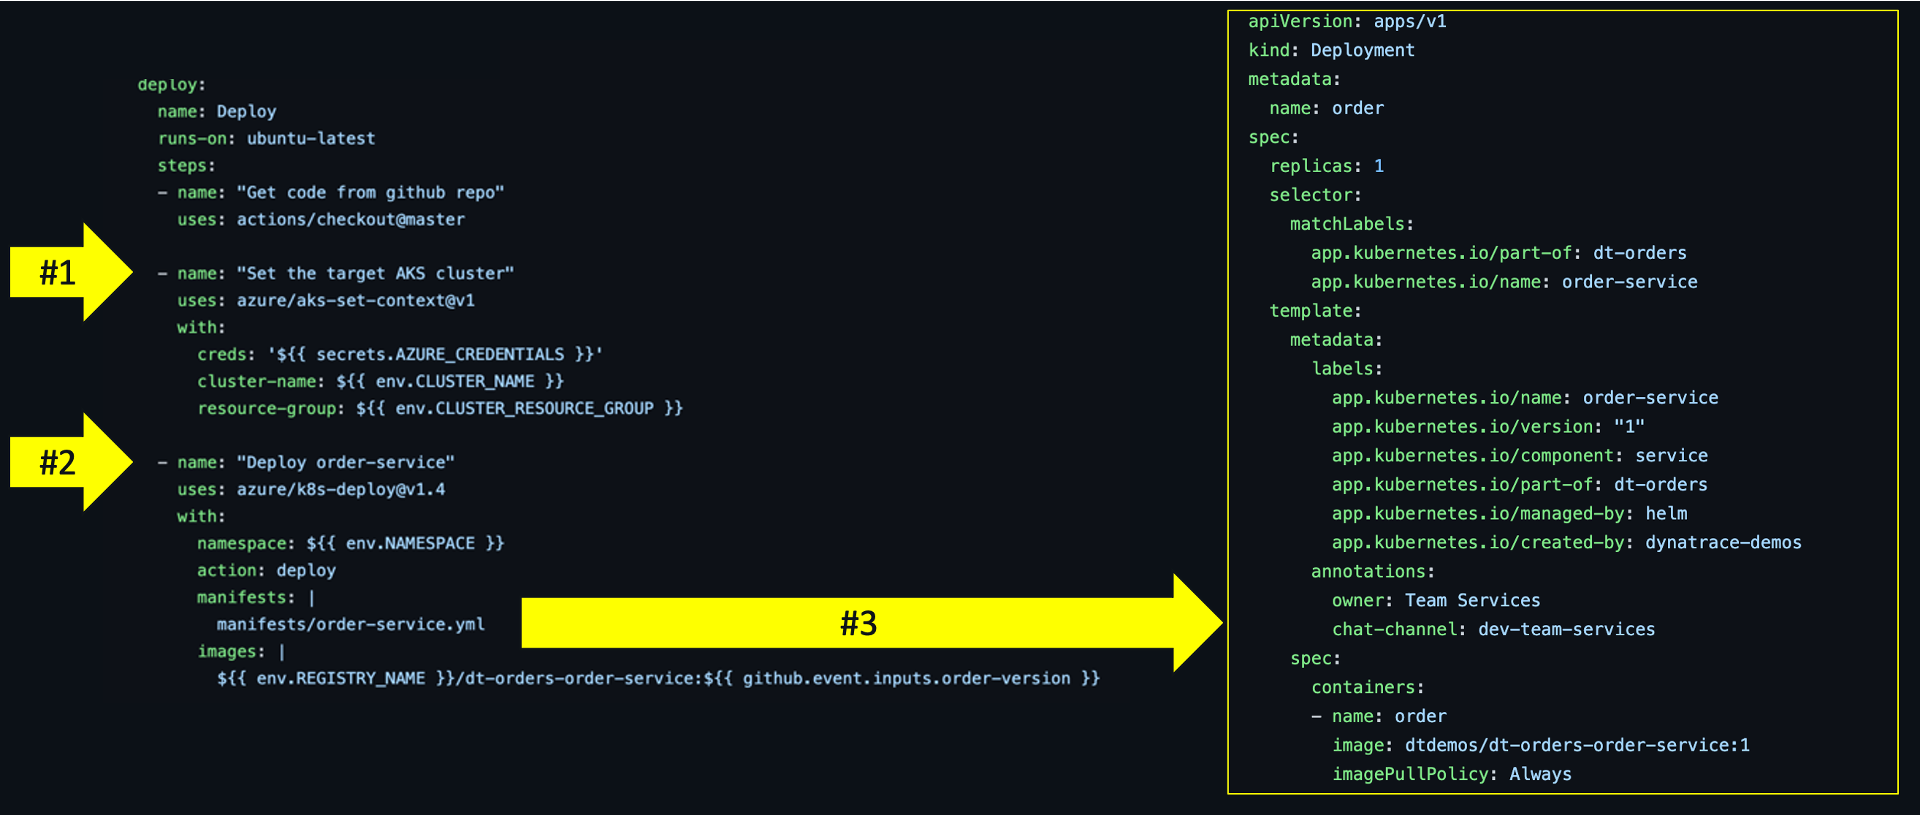
Below is an example workflow from this repo for a basic deployment strategy:
- The GitHub workflow first sets the Azure cluster credentials using the set context Action.
- Kubernetes deployment Action is deploying the defined namespace and manifest file.
- The example manifest file with the container name, replica counts, and associated meta-data shown on the right can be viewed in this repo.
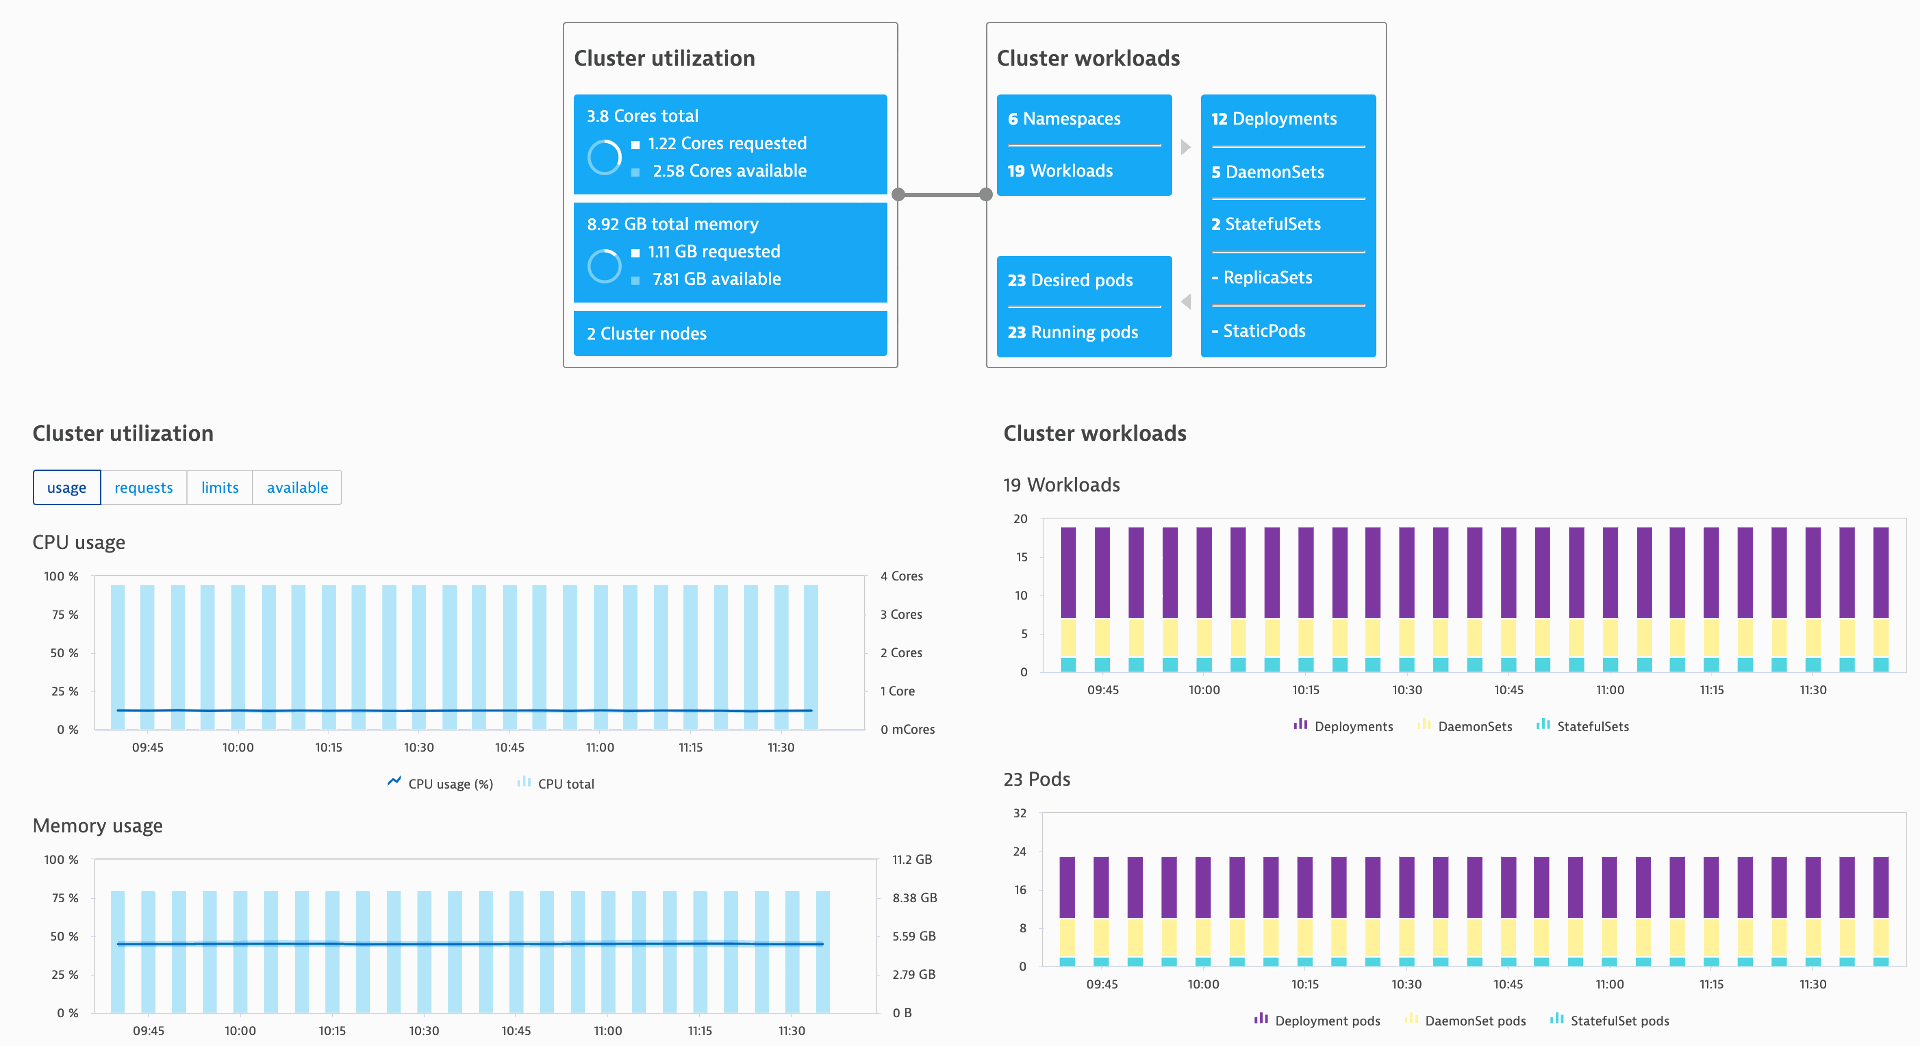
Once deployed, the Dynatrace for Kubernetes – now in general availability – can be used and provides a cluster-level workload view of the environment, as shown below.
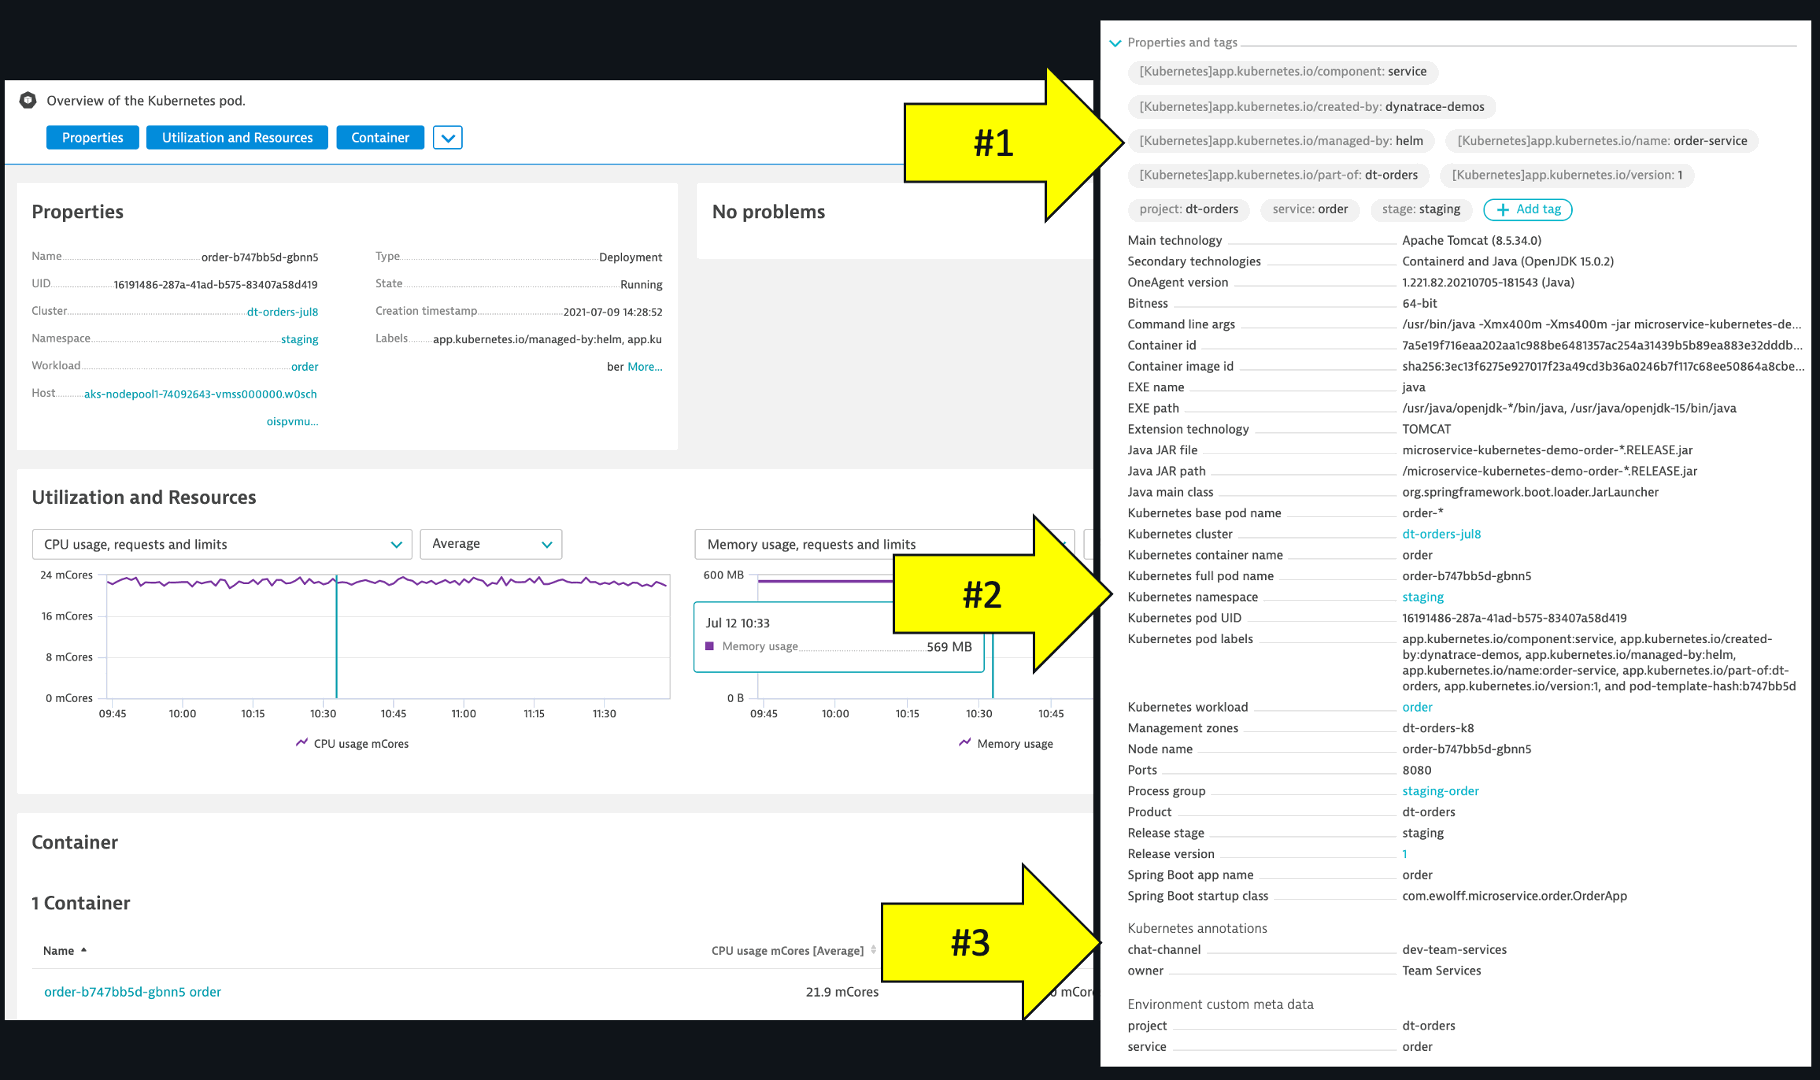
At the pod and container instance level, Dynatrace automatically detects Kubernetes labels and attributes and allows users to confirm and monitor what was deployed. The example below demonstrates:
- Dynatrace automatically added tags created from Kubernetes labels
- Kubernetes pod attributes
- Custom annotations that the OneAgent picked up
It can be quite time consuming to manually gather all the facts related to release insights and risk, to answer questions like:
- Which versions are deployed across our deployment stages and production environments?
- Which release stages are these deployed versions in?
- What known bugs have we identified and are any of them release blockers?
To help answer these questions, Dynatrace uses built-in version detection strategies to support different technology standards for versioning. The latest version detected can be influenced by environment variables, Kubernetes labels, and events ingestion.
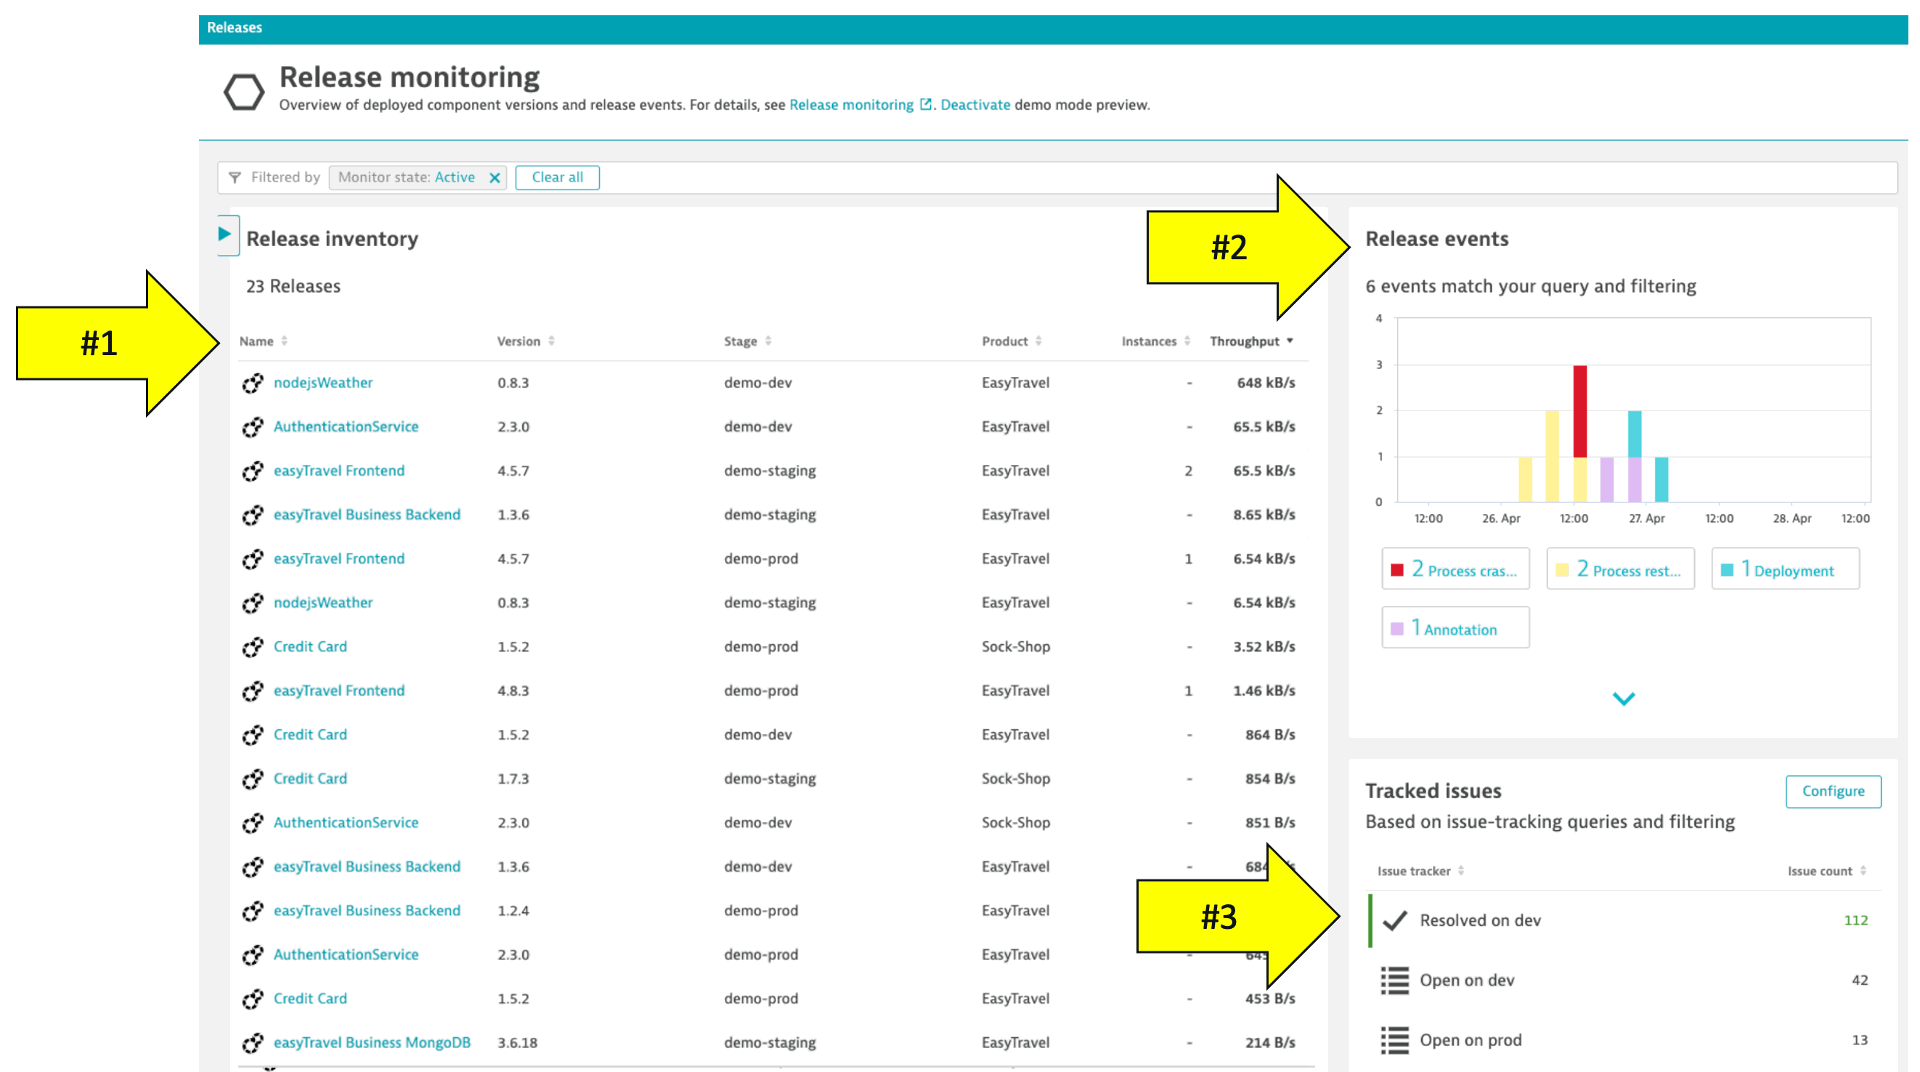
Below is an example of the Dynatrace release inventory screen that shows:
- Release and version analysis by component using filters
- Component levels information events such as releases and configuration changes
- Component issue statistics from configurable issue tracking queries integrated with tracking systems like GitHub
Example #2 – Deployment information events
We just saw how easy it was to deploy our service, but how easy is it for other teams to track down the versions, and find from what workflow team they were deployed when issues come up? Here is where the idea of integrating observability tools with events like deployments, configuration changes, and other activities like a performance text or chaos experiment occurred. Just imagine getting alerted about an issue and immediately seeing that a load test or deployment took place.
Dynatrace calls these “information only events” and there are five types:
- Deployment
- Annotation
- Configuration
- Information
- Marked for termination
Each event has a timestamp, event source, required fields based on the event type, and custom fields such as service owner or a hyperlink back to the GitHub repo workflow.
Adding information-only events into pipelines is easy thanks to the open-source you can find in the GitHub marketplace. This Action requires the Dynatrace API URL and token, the event type, event details, and the targeted host or service to add the event.
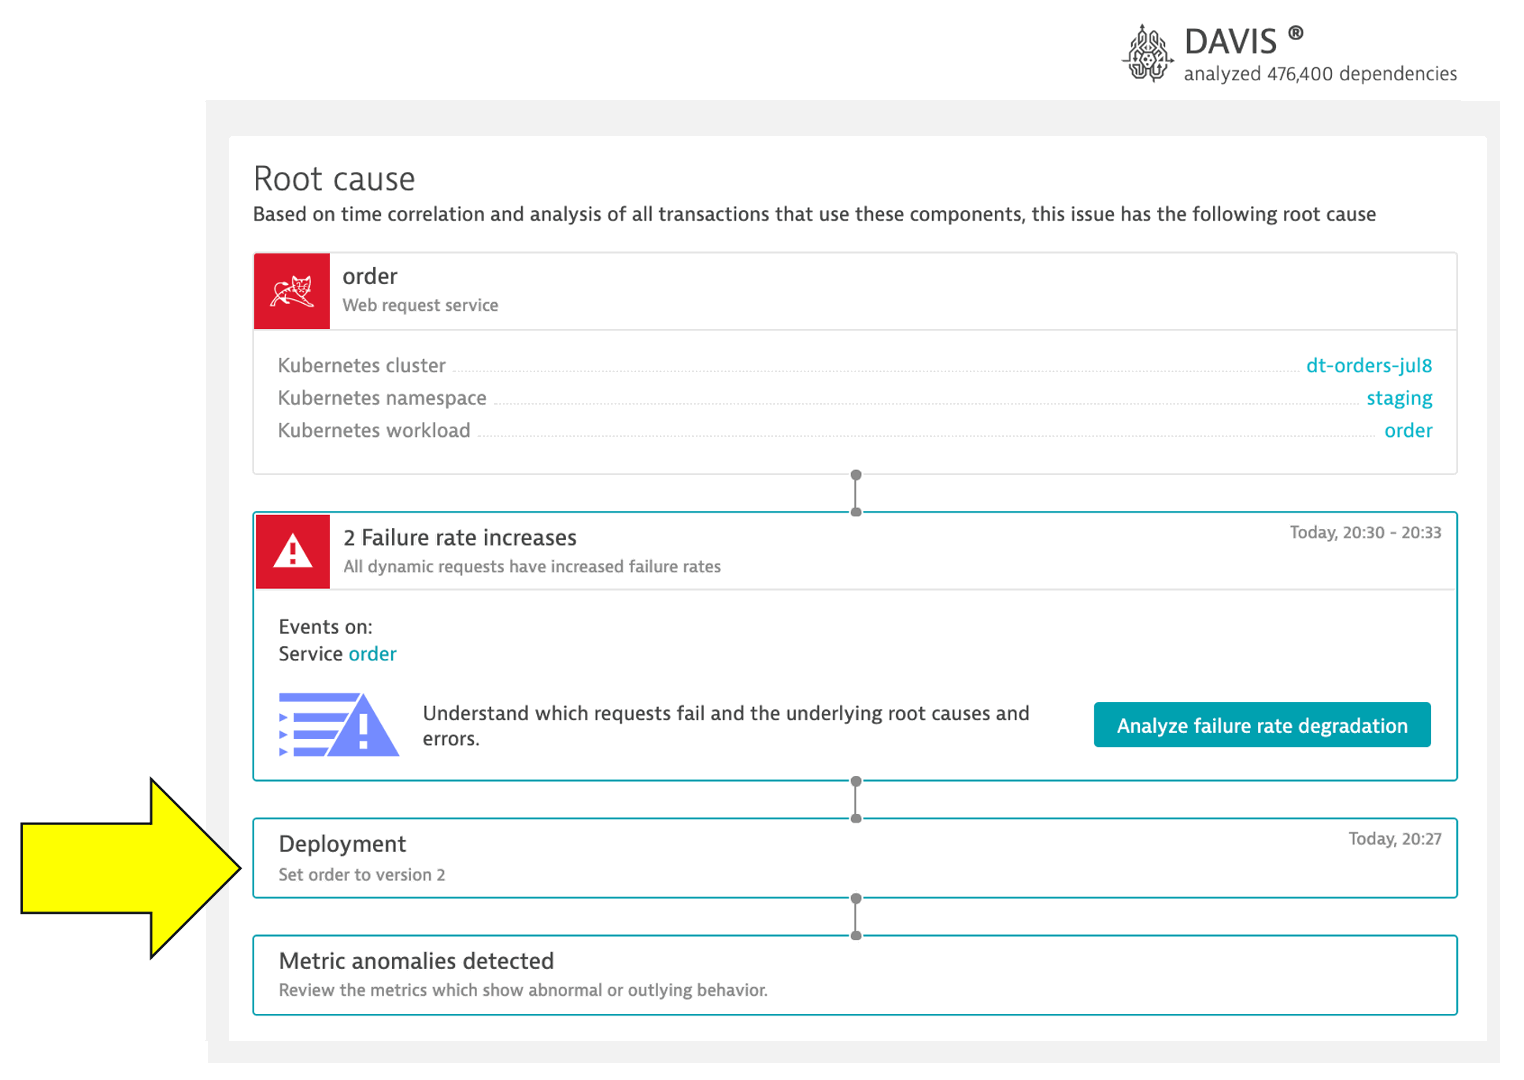
Below is the GitHub Action step for the Dynatrace deployment information event for this order service. The event shows in the Dynatrace platform with various meta-data such as the URL to the GitHub workflow, with various meta-data such as the URL to the GitHub workflow.

While a deployment may or may not be the root cause of a problem, these information events are automatically associated with the root cause service problem the Dynatrace AI engine, Davis®, determined as shown below. This information can provide useful context when triaging problems.
Try it yourself
All the examples shared in this blog post are available as open-source and demonstrated on Microsoft DevRadio, so be sure to try them in your environment and let us know how you get on.
We would love to hear your feedback on how the combination of GitHub Actions and Dynatrace helps you to:
- Reduce time spent on manual processes by simplifying and standardizing Kubernetes deployments and introducing self-service monitoring as code
- Get an instant overview of your K8s environment through the Dynatrace operator and many out-of-the-box features for Kubernetes
- Eliminate finger pointing by adding context for environment changes and versioning
Be sure to check out part two of this blog series, where we continue with more examples such as Dynatrace Monitoring as Code and SLO release validation using Dynatrace SaaS Cloud Automation.



Looking for answers?
Start a new discussion or ask for help in our Q&A forum.
Go to forum