If you conduct business on the web, you’re likely dealing with multiple payment gateway providers. One single payment provider issue can undo HUNDREDS of hours spent optimizing the critical user journeys of your mobile or web applications, designed to encourage users to progress through the funnel and complete a purchase. This could be adding high-quality graphics, running A/B testing to make UX tweaks, or deploying new code to make it perform better. All of it to make a frictionless experience for users.
On average 70% of users will abandon an online shopping cart; 12% of those due to website errors/crashes. But instead of looking at the statistics, let’s look at how you can combat and avoid these issues.
In this blog, we’ll explore how Dynatrace Business Analytics gives you full visibility into payment errors affecting your user base, which enables you to see which payment errors are affecting your users, and how you can quantify the business impact. Dynatrace Business Analytics is powered by Dynatrace Real User Monitoring (RUM), Dynatrace PurePaths, and external metrics ingested through the Dynatrace API.
By leveraging multiple aspects of the Dynatrace platform, Business Analytics delivers powerful, actionable insights into payment errors, enabling you to:
- Prioritize payment errors by their impact on your revenue
- Make informed, real-time decisions to enable or disable different payment gateways
- Identify impacted users for retargeting purposes
Understanding the business impact of payment errors
To understand the total business impact, User Session Query Language (USQL) can be used to generate some simple yet powerful visualizations. Below we can see 18 users have abandoned their cart due to a payment error, with a total combined basket value of £14,401.
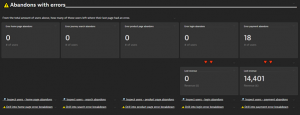
Very quickly, you’ll know the potential revenue loss and the scope of the problem. Is it site-wide? Does it come from a small number of high-value customers? Further down, we show you how to identify those individuals for follow-up or re-targeting.
With regards to the gateway providers themselves, Dynatrace can leverage data from many sources to drive real-time, actionable insights and answer the below questions:
- Are there issues with payment gateways?
- How do these issues impact business outcomes?
- What conditions should trigger auto-remediation (such as disabling a specific payment gateway)?
Using full-stack data to capture the health of payment gateways
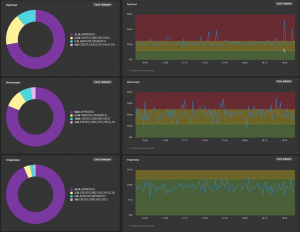
In the screenshot below, the charts on the left are powered by data ingested from an external API, while the charts on the right (from the new data explorer) are powered by server-side PurePath data from OneAgent, giving an ongoing view of response time from each provider.
But how do we get to this point?
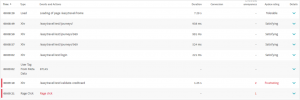
A user session captured by Dynatrace
Dynatrace RUM already gives out-of-the-box insight into errors experienced by users. In the example user journey below we see a user hitting an issue at the validate credit card step. This has caused them to “Rage Click” and as a result, abandon their purchase.
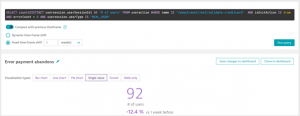
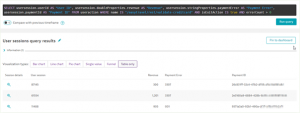
We can interrogate this RUM data using USQL to understand how many users had the same issue. The query below looks for the total users that had an error during payment and then abandoned their purchase.
But we can go much further than that! What was the error they had? Which payment gateway was responsible? What’s the status of all our payment gateways? How you extract this information depends on where it’s exposed; Dynatrace can pull it from within the user’s browser or as it’s passed through in your code.
If most of the interaction is in the browser – session properties are your best bet. They can be used to pull further details using CSS selectors (if the detail is in the HTML) and from global JavaScript variables. Quite often JavaScript variables already exist because of analytics tools, or as a standard implemented by the web dev team for exposing useful data (dataLayer is one we see quite often).
If the interaction is happening server-side, you can retrieve the data using request attributes. In the example below, we’re extracting the payment ID and gateway provider as it’s passed through the code in a Tomcat service.
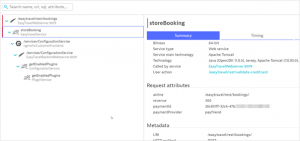
Whatever the source (CSS selector, JavaScript variable, or request attribute) – this can then be associated with the individual user as shown below. In addition, the “basket” or “order” value can be pulled this way so we can start to quantify the business impact beyond the number of affected users.

At a high level, this now enables us to re-visit our USQL query and expand it to pull a list of users (with their user ID so we can identify them) who abandoned their purchase due to a payment error and list out the specific error they got, as well as the payment ID to help to troubleshoot with the gateway provider. This information can also be used in re-targeting efforts where you might want to follow up with an offer of help, or some sort of incentive to complete the failed purchase.
Even after payments are handed over to the provider, information can be ingested to visualize their status. For example, many payment gateways provide an API to query payments and their status. This information can be pushed into Dynatrace using the ingest API as shown in the Postman example below.
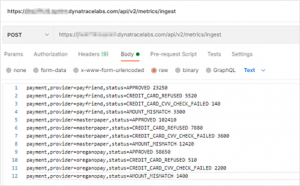
Once this information is in Dynatrace, not only can it be baselined by our AI engine, Davis, but also visualized for the purpose of reporting or real-time dashboards.
Like taxes, payment gateway issues are inevitable. But unlike taxes, they don’t have to subtract from your bottom line.
To learn more, or to see business analytics in action, contact your Account Team for a demo or Proof of Concept highlighting Dynatrace Business Analytics. New to Dynatrace? Try our free trial!


Looking for answers?
Start a new discussion or ask for help in our Q&A forum.
Go to forum