Who watches the watchers? Dynatrace's Sergio Hinojosa explains why it's now critical for companies to leverage advanced solutions that deliver automated, AI-driven observability across K8s environments, and how Dynatrace can make it happen—automatically.
With containers now the common framework for deploying microservices-based applications at scale, the need for robust management tools is also increasing. Kubernetes (K8s) is the platform of choice for many organizations, providing a portable, extensible, open-source solution designed to streamline containerized workload oversight.
But who watches the watchers? According to InfoQ, Kubernetes monitoring offers substantial benefits for container management, but it’s not a complete platform in and of itself. Rather, it’s a foundational piece of your larger IT ecosystem. As a result, it’s now critical for companies to leverage advanced and agile solutions capable of delivering automated, AI-driven observability across K8s environments.
Sergio Hinojosa, Sales Engineer Manager EMEA at Dynatrace, sheds light on the advantages of automatic, AI-driven, end-to-end container observability and the insight and control it gives teams over their Kubernetes environments.
Why organizations are struggling with container observability
“Companies now have hundreds or thousands of containers talking to each other, but there are still some blind spots,” Hinojosa says. “You need to understand and detect non-performing code or where and how exceptions happen—which user or transaction triggered it, its context, its backtrace, and its metadata. So if there’s an increase in response time or failure rate without this automatic full-stack visibility, you won’t be able to understand the real root cause of the problem.”
Hinojosa asserts that effective Kubernetes monitoring demands observability, not only across metrics, logs, and traces but also the context in which things happen and the user impact. Despite this need, however, just 13% of enterprises say they have end-to-end observability across applications and services. Instead, they’re often frustrated by three common container challenges:
1. Missing relationships
Without a complete understanding of how microservices, worker nodes, and user sessions interact—and the dependencies they rely on—organizations are effectively flying blind when trying to determine the root cause of issues among their containers.
2. Manual stitching
While it’s possible for IT teams to track down and tally up current connective constructs, this manual stitching requires significant time and effort and is prone to potential errors that could negatively impact overall performance.
3. Unknown impact
“The biggest blind spot of all is the unknown impact on your end-users,” Hinojosa says. This lack of in-depth visibility into container interactions leaves enterprises in the dark when it comes to understanding end-user interactions with cloud- and web-based services.
The solution: Automatically map, measure, manage with intelligent observability
Kubernetes monitoring from Dynatrace offers a way to bridge the observability gap. “It starts with Smartscape,” Hinojosa says. “It’s a multidimensional model, a living representation of your IT landscape that shows the real-time connections and dependencies among the vertical and horizontal stack: the data centers and cloud providers, the hosts running on them, the processes running on those hosts, the services of these processes talking to each other, and the users interacting with these microservices.”
At the core is the Dynatrace deterministic AI engine, Davis. “It continuously analyzes all these dependencies and connections in real-time, detecting anomalies within seconds,” Hinojosa says. “It will tell you what the problem is, how many users were affected, along with the root cause.”

In practice, the Dynatrace solution improves Kubernetes monitoring across three key areas:
1. Dependency mapping
Smartscape technology automatically detects your entire IT ecosystem, providing a multidimensional view of your interdependencies, whether they number in the thousands or billions. This includes all connections between containers inside your pods, its services, worker nodes, and data centers along with incoming and outgoing connections along the vertical stack. The result? End-to-end dependency mapping that leaves no digital stone unturned and enables near-instant insight into the root cause of a slowdown or issue.
2. Impact measuring
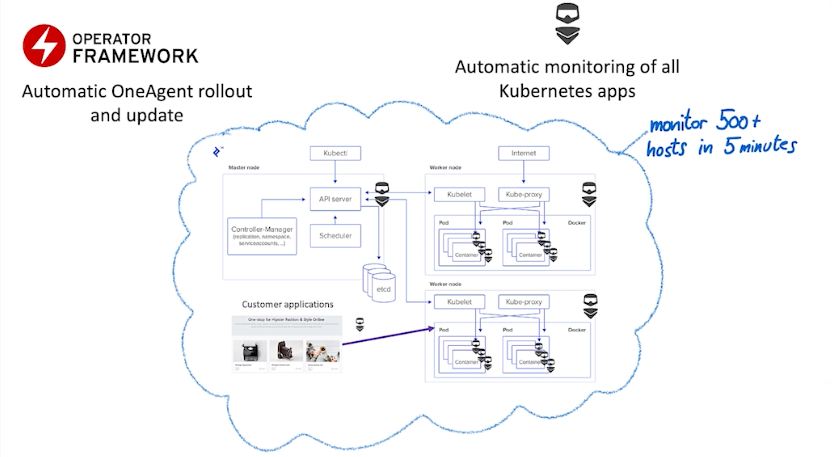
The Dynatrace Operator for Kubernetes helps measure the impact of current services and solutions on your IT environment at scale. “This makes Dynatrace a first-class citizen in your Kubernetes environment,” Hinojosa says. “Dynatrace highlights current hot spots to help you optimize specific endpoints or services.” For example, the Service flow shows the transactions through your different deployed technologies and infrastructure components, allowing companies to break down their silos and drill down to specific sections.
3. Experience management
How many users are accessing web services? How many sessions are starting, and how long do they last? How many conversions does your site generate under different performance circumstances?
Monitoring Kubernetes with Dynatrace helps manage end-user experience by showing problems such as slow loads and communicating these issues in terms of how many users they impact and for how long. IT teams can even replay individual user sessions to see what users are seeing, observe what went wrong, and determine if the end result was rage-clicking frustration that requires an immediate response.
Monitor 500 hosts in 5 minutes
Hinojosa demonstrates how simple it is to deploy the Dynatrace Operator to start automatically monitoring your Kubernetes environment at scale. By using the Helm Hub, Operator Hub, or Dynatrace Marketplace, organizations can easily deploy the Operator with just a few clicks. It will then automatically monitor all worker nodes, the pods running in them, the processes running inside the containers, and their transactions, threads, CPU, and memory usage. It will monitor all the end-users interacting with your Kubernetes clusters automatically. Dynatrace gathers and analyzes all infrastructure and application events and metrics so IT teams can view their respective KPIs on their Kubernetes dashboards.

“With this automatic full-stack visibility across all infrastructure and application components, your ITOps teams can effectively optimize the allocation and consumption of resources of your Kubernetes clusters, such as CPU and memory,” Hinojosa says. “You can identify hungry pods, poorly dimensioned deployments, throttled containers, out-of-memory pods, and many more across tens, hundreds, or thousands of worker nodes and the containers running in your Kubernetes pods within their service mesh.”
The best part is no code changes are required to collect and make sense of your Kubernetes data at scale.
Although Kubernetes is now critical for effective container management and monitoring, IT teams can become bogged down by its complexity and miss critical insights because of inadequate visibility. AI-driven automation with Dynatrace empowers organizations to automatically monitor all their nodes and clusters and receive actionable insights that help them break down silos, collaborate, and deliver optimized user experiences.
View Hinojosa’s full presentation:

Still curious about the need for container monitoring and management? Read our eBook, The State of the Kubernetes Ecosystem, and discover what your organization has to gain from adopting Dynatrace’s powerful software intelligence solution.


Looking for answers?
Start a new discussion or ask for help in our Q&A forum.
Go to forum