Dynatrace is enhancing its Software Intelligence Platform to log streams from Kubernetes and multicloud platforms, including AWS, GCP, Azure, and the most widely used open-source log data frameworks. These new log sources complement observability data and additional context like user sessions or topology information in Dynatrace, extending the Davis AI engine and enabling DevOps and SRE teams to centrally analyze all logs.
Leveraging cloud-native technologies like Kubernetes or Red Hat OpenShift in multicloud ecosystems across Amazon Web Services (AWS), Microsoft Azure, and Google Cloud Platform (GCP) for faster digital transformation introduces a whole host of challenges. The sheer number of used technologies, components, and services in use contributes to the growing complexity of modern cloud environments.
Also, these modern, cloud-native architectures produce an immense volume, velocity, and variety of data. Every service and component exposes observability data (metrics, logs, and traces) that contains crucial information to drive digital businesses. But putting all the data points into context to gain actionable insights can’t be achieved without automation in web-scale environments. Also, if you don’t add more context like user experience or interdependencies between components you’ll find critical information is missing.
Logs provide information you can’t find anywhere else
Logs and events play an essential role in this mix; they include critical information which can’t be found anywhere else, like details on transactions, processes, users and environment changes. They are required to understand the full story of what happened in a system.
Putting logs into context with metrics, traces, and the broader application topology enables and improves how companies manage their cloud architectures, platforms and infrastructure, optimizing applications and remediate incidents in a highly efficient way.
Getting actionable answers from log data is impossible at scale without the bigger context, automation, and AI
Organizations struggle to effectively use logs for monitoring business-critical data and troubleshooting. Legacy monitoring, observability-only, and do-it-yourself approaches leave it up to digital teams to make sense of this data. The huge effort required to put everything into context and interpret the information manually does not scale.
- Collecting data requires massive and ongoing configuration efforts
Using log data together with traces and metrics entails a massive effort to set up, configure, and maintain log monitoring for the many technologies, services and platforms involved in cloud-native stacks, if you don’t follow a highly automatic approach.
- Connecting data siloes requires daunting integration endeavors
Some companies are still using different tools for application performance monitoring, infrastructure monitoring, and log monitoring. To connect these siloes, and to make sense out of it requires massive manual efforts, including code changes and maintenance, heavy integrations, or working with multiple analytics tools.
- Manually maintaining dependencies among components doesn’t scale
Observability-only solutions often require manual tagging to define relationships between different components and their data points. While feasible in smaller teams or for certain initiatives, this requires vast standardization efforts in global enterprises and web-scale environments.
- Business context is missing without user sessions and experiences
The “three pillars of observability,” metrics, logs, and traces, still don’t tell the whole story. Without user transactions and experience data, in relation to the underlying components and events, you miss critical context.
- Manual alerting on log data is not feasible in large environments
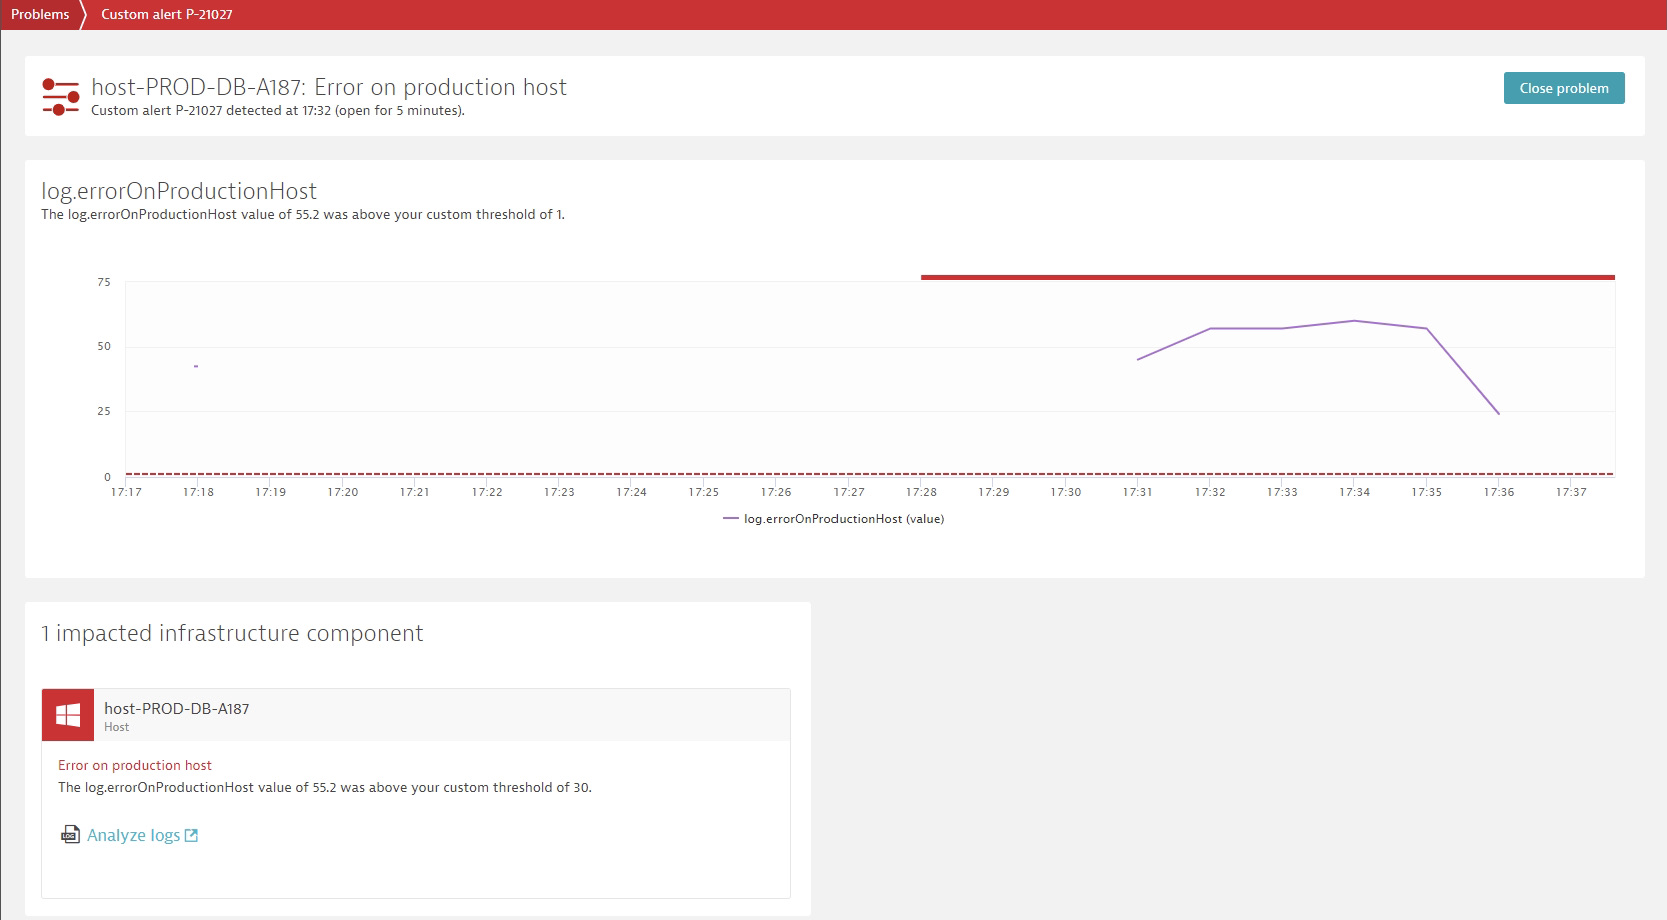
Tracking business-critical information from logs is another area that requires automation. Solutions that require setting and adjusting manual thresholds do not scale in bigger application environments.
- Manual troubleshooting is painful, hurts the business, and slows down innovation
Some solutions that use logs for troubleshooting only provide manual analytics to search for the root causes of issues. This manual approach may be easy in some use cases but can break down quickly for a failure on a service level in a complex Kubernetes environment. To identify which log lines are relevant because an individual pod caused this problem requires expertise, manual analysis, and too much time, preventing the most valuable people from innovating.
Dynatrace applies AI to new log sources including cloud logs and Fluentd to drive automation in multicloud environments
We are happy to announce we are enhancing our Software Intelligence Platform to automatically capture log and event streams from Kubernetes and multicloud platforms, including AWS, GCP, Microsoft Azure, and Red Hat OpenShift. We now also provide out-of-the-box support for the most widely used open-source log data frameworks, including Fluentd and Logstash and open up the AI-engine for any log or event data.
New log sources complement observability data, user sessions and topology, automatically, in context
Powered by OneAgent and PurePath4, Dynatrace is collecting extensive observability data. This already included all logs on hosts with OneAgent, which provides fully automatic continuous discovery and monitoring of everything running on the respective host, with no manual interaction or configuration required.
Now, Dynatrace applies Davis, its AI engine, to monitor the new log sources. This provides AI-powered log monitoring for all sources and makes Davis even smarter at the same time. Davis and the new log viewer enable DevOps and SRE teams to centrally analyze logs and automatically get alerts and root cause analysis on anomalies in log events from various log streams in your Kubernetes and multicloud environments. The newly added sources include:
- All log streams from the hyper-scale cloud providers AWS, Azure, and GCP
- All log streams from pods in Kubernetes environments
- Native support for open-source log data frameworks, Fluentd and Logstash
- Any log event (JSON or plain text) via HTTP REST API
AI-powered answers and additional context for apps and infrastructure, at scale
Across all platforms and data sources, Dynatrace enables you to have a holistic, topology-enriched overview of your whole environment based on logs, traces, and metrics enhanced with user experience data and code-level analytics. This enables the Dynatrace Davis AI-engine to provide precise, context-based answers that can drive automation.
- Track log metrics and receive alerts without manually setting thresholds
Davis provides auto-baselines and anomaly detection for metrics based on occurrences of log events.
- Identify root causes automatically
Davis automatically analyzes the root causes of issues without any manual interaction. In the case of service degradation in a Kubernetes environment, Davis is able to pinpoint the individual pod which caused the issue or even the line of code within a service running inside a pod.
- Leverage log analytics for additional context
Dynatrace enables users to jump directly from the automatically identified root cause of issues, like the Kubernetes pod, to the respective log lines within the relevant timeframe, and supports a high-performing full-text search for additional investigations.

Quickly search, explore, and analyze log and event data from any source
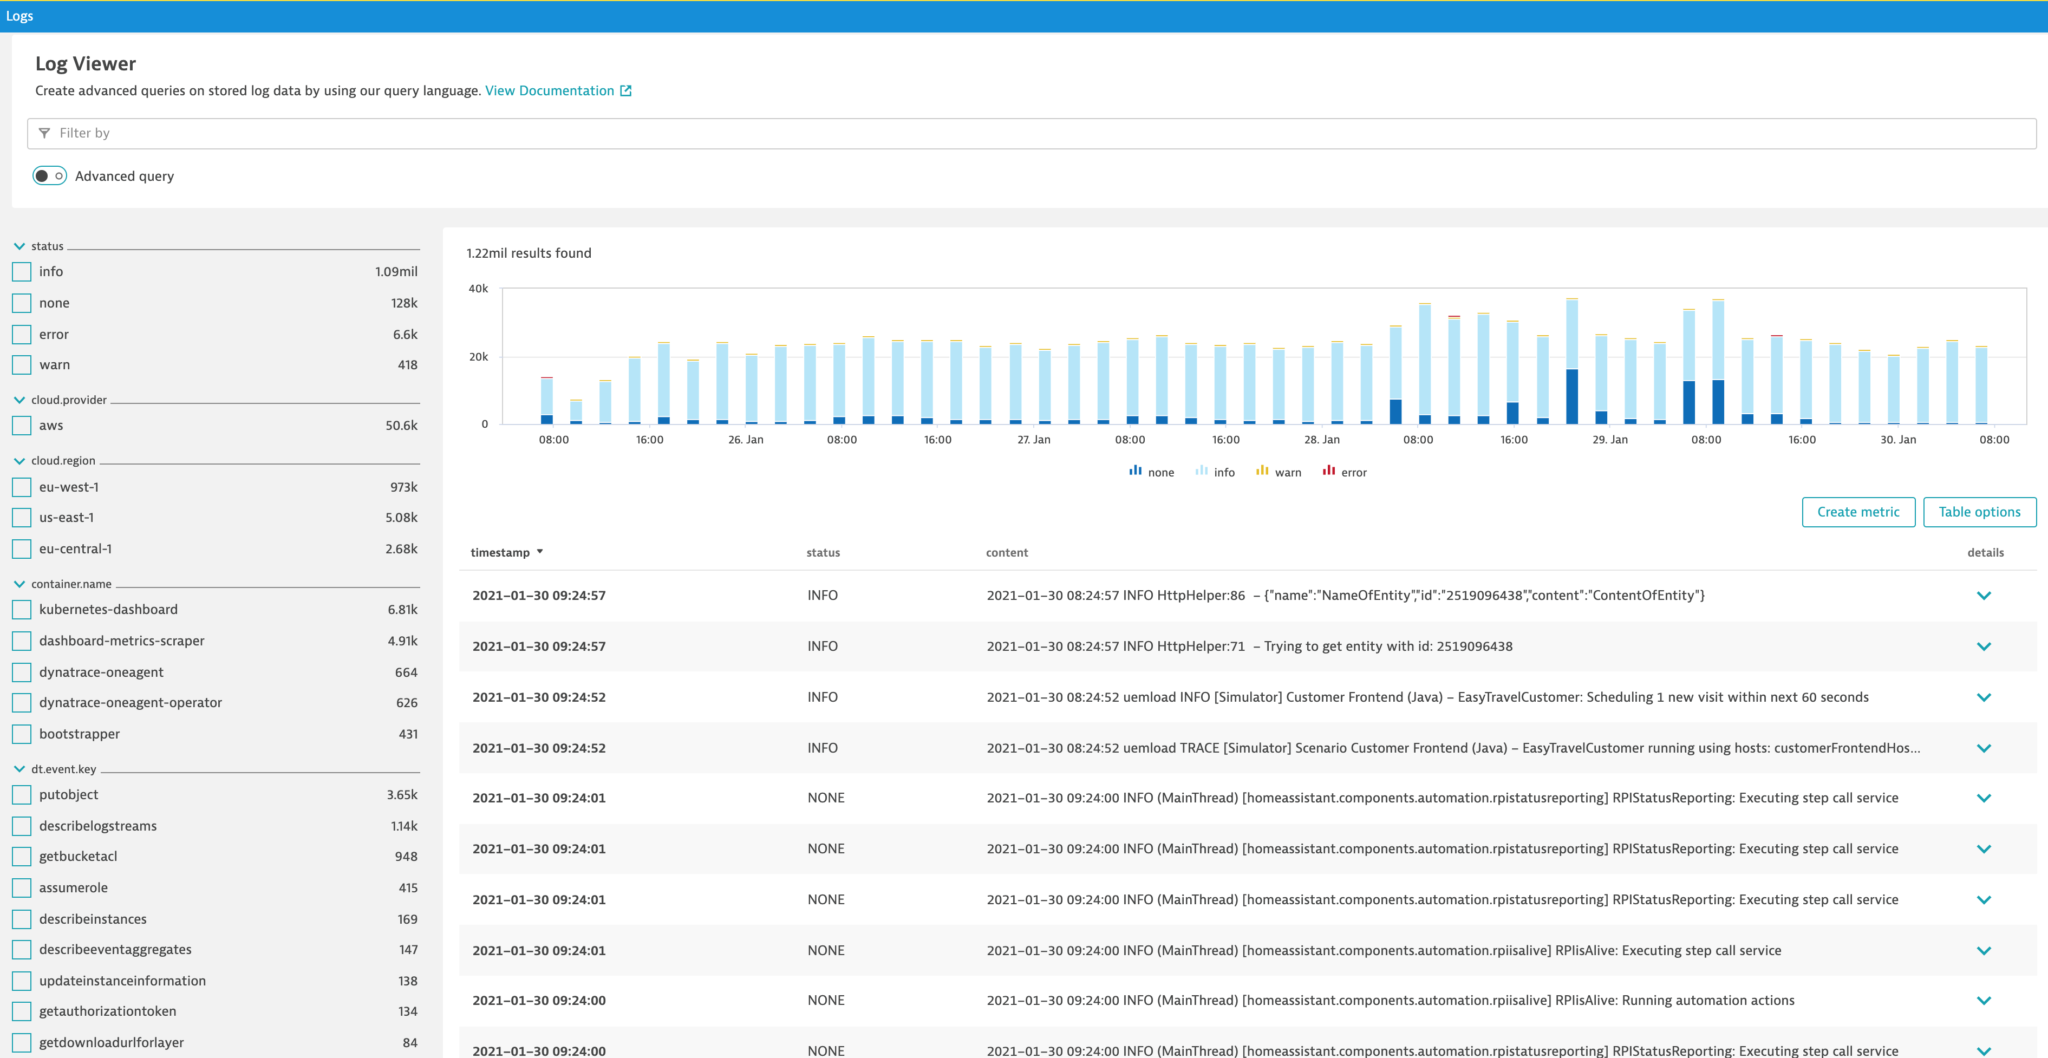
The new log viewer allows you to explore, segment, and find data across different sources, including auto-discovered log files and log streams from various platforms or services.
Powerful filtering capabilities enable you to segment the data by log event attributes, such as status or HTTP method, or the attributes of the log producer, such as container name, cloud provider, region, pod ID, database name, or other.
Log and event data is always available in the context of its producer, so it’s easy to move between components like pods, containers and hosts and the respective logs to easily connect component metrics and log lines in relevant timeframes.
This detail and context enable teams to extract relevant information from logs and events to cover custom use cases, like debugging with additional log context, governance audits, platform usage optimization, and many others.

What’s next
All Dynatrace enhancements mentioned in this blog post will be available to all Dynatrace customers within the next 90 days. So please stay tuned for updates.
Seeing is believing
New to Dynatrace? You can start monitoring your multicloud environments now. Try it by starting your free trial today.


Looking for answers?
Start a new discussion or ask for help in our Q&A forum.
Go to forum