In my last blog article, I answered the question “What is OpenTelemetry?”, with the goal of providing a high-level overview of the OpenTelemetry project and answer some of the most commonly asked questions. If you haven’t had a chance to read this post, or it’s been a while and you need a refresher, I would recommend reading through it first (and then come right back here), since a good base understanding of OpenTelemetry would be a useful context for understanding this post.
Problems in the cloud-native world
If we think back to just a few years ago when most application workloads were primarily monolithic and deployed on-premise, it was fairly simple to gain observability by collecting some logs, metrics and traces, since all the infrastructure was self-owned and the scale was manageable. In fact, most applications at this time were independent of each other and the only commonality between them may have been a data store. This type of application (and organizational) independence gave application teams the freedom to choose whatever monitoring solutions they wanted since there was little advantage to having a cohesive solution that encompassed the entire enterprise.
Fast forward to today and the application landscape is trending in very much the opposite direction. Application teams focus on building individual services that are consumed by other app teams across the entire organization, and many workloads have moved out of the data center and into the cloud leveraging different cloud services. On top of that, the sheer number of business-critical applications has increased exponentially. There is now a requirement to have end-to-end visibility across application boundaries, including visibility into components you don’t own (e.g. cloud services and third parties).
OpenTracing + OpenCensus = OpenTelemetry
The problems outlined above were experienced early on by some of the bleeding edge technology companies (Uber, Google, etc.), which came up with different approaches to solve it. This was when OpenTracing and later OpenCensus was born. However, neither of these projects solved the end-to-end observability problem, mainly for two reasons:
- They were two competing projects, with different specifications; if one application group chose to use OpenTracing and another chose OpenCensus you no longer had end-to-end visibility
- Neither specification defined a standard way of propagating trace-context
The industry-recognized two competing projects would only make it more difficult for companies to achieve end-to-end visibility, and so it was decided to merge the two projects into OpenTelemetry. OpenTelemetry is designed to solve the above issues by being the sole specification that everybody agrees. Also, by implementing the W3C Trace Context as the default trace-propagation mechanism there’s now a standard in place making trace-context propagation universal.
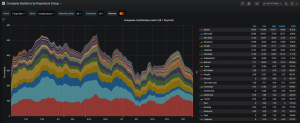
Taking a quick look at the breakdown of organizations that are actively contributing to the OpenTelemetry project, it’s evident the project has the full support and collaboration of all the major cloud and APM vendors.

Importance of W3C Trace Context
If you implement an application tracing solution today, whether it be commercial or open-source, more than likely the actual tracing is done by adding specific HTTP headers to the transactions so you can have an end-to-end view across the tiers of your application. The problem is, the headers that are added to the transaction are vendor-specific and can be dropped by intermediaries that do not understand them (e.g. firewalls, load balancers, etc.), resulting in a “broken” trace.
The W3C Trace Context was created to solve this problem by putting an actual standard in place that specifies what HTTP headers will be used to propagate trace context, lessening, and hopefully eliminating the lost context problem. If you’re interested in learning more about how Dynatrace is utilizing Trace Context, check out this blog post by my colleague Sonja Chevre.
Extended observability
When most people think about observability, they usually think about the visibility into the application layer. While this is arguably the most critical component, since it’s what your users actually see and judge you on, there are many other components involved in fulfilling a user’s transaction (e.g. load balancers, transaction gateways, etc.).
In the current world of distributed tracing, the focus has primarily been on providing an end-to-end view of the application tiers since it’s very difficult to “instrument” something like a load balancer. One of the goals of OpenTelemetry is to make observability a built-in platform feature. This means it’s entirely possible that cloud vendors will implement OpenTelemetry into their cloud services which provide users with the ability to observe both their application layer and external services in one end to end view.
Tip of the iceberg
OpenTelemetry has great promise and already has A LOT of support from most of the industry leaders (Dynatrace included), which is very impressive for a project that as of this writing is still in Beta. Provided the current momentum continues as the project matures, OpenTelemetry will truly make observability much easier for everybody (both end-users and vendors).
Watch webinar!
This Performance Clinic, Dynatrace and OpenTelemetry work #BetterTogether, will show you how Dynatrace helps IT operations teams and Site Reliability Engineers to leverage OpenTelemetry data to gain end-to-end observability insights in various scenarios.


Looking for answers?
Start a new discussion or ask for help in our Q&A forum.
Go to forum