The new Dynatrace ActiveGate extension extends our SAP monitoring capabilities to support SAP HANA databases.
If you’re running SAP, you’re likely already familiar with the HANA relational database management system. HANA maintains all the business and analytics data that your business runs on. However, if you’re an operations engineer who’s been tasked with migrating to HANA from a legacy database system, you’ll need to get up to speed quickly. But how can you become an expert in such a complex tool like HANA without a serious learning curve? Don’t worry, when it comes to SAP monitoring, Dynatrace has you covered.
Dynatrace ActiveGate extensions allow you to integrate Dynatrace monitoring with any remote technology that exposes an interface. For example, you can get comprehensive monitoring of SAP ABAP Systems, which lowers the barrier of communication between enterprise IT operations and SAP Basis teams. Today we’re proud to announce that we’ve extended our SAP monitoring capabilities to support SAP HANA databases.
Simplify SAP HANA performance monitoring and analysis
Our new SAP HANA database monitoring extension allows you to:
- Easily understand the health and performance of your HANA databases
- Enable the Davis® AI causation engine to automatically analyze every metric
- Avoid false positives with auto-adaptive baselining
- Migrate confidently with simplified observability into database components
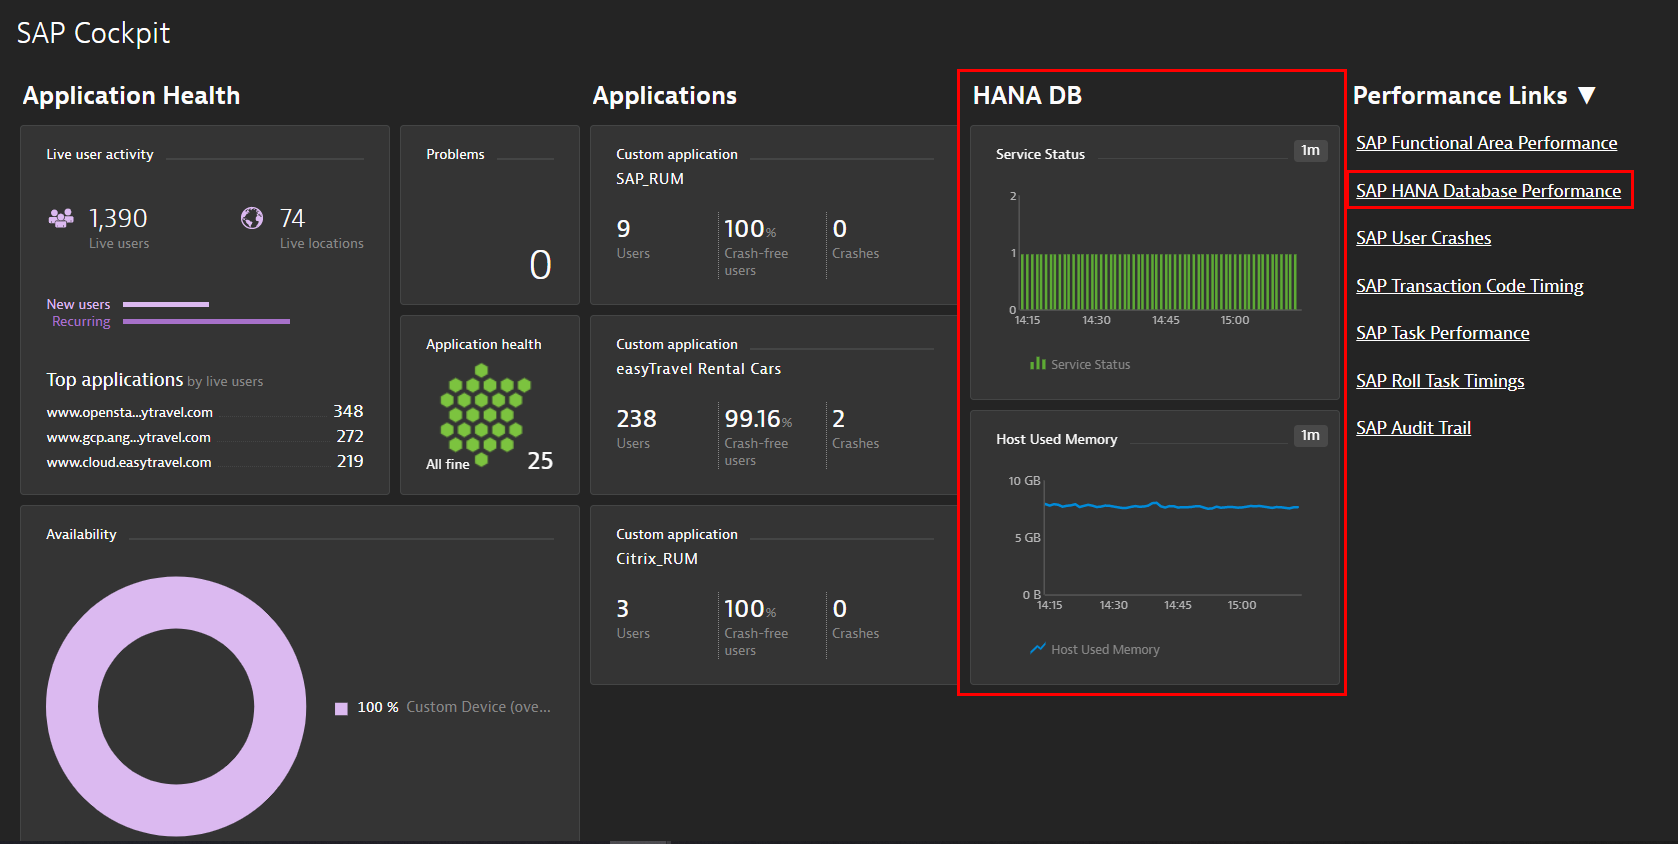
Easily understand the health and performance of your HANA databases
SAP HANA comes with hundreds of performance observability views that track and report the health and performance of the environment. SAP-native performance management tools, like Solution Manager and Focused Run, take advantage of these views to deliver deep insights into the internal operations of SAP HANA. However, for non-SAP engineers, the amount of available information can be overwhelming—it’s not always clear where to look for answers when you have questions about the performance of your SAP HANA database.
Especially in situations where systems at the edge of the SAP landscape depend on HANA at the back end, operations specialists only need an answer to a simple question: is the SAP HANA back end performing as it should, or are there anomalies that require the attention of a specialist?
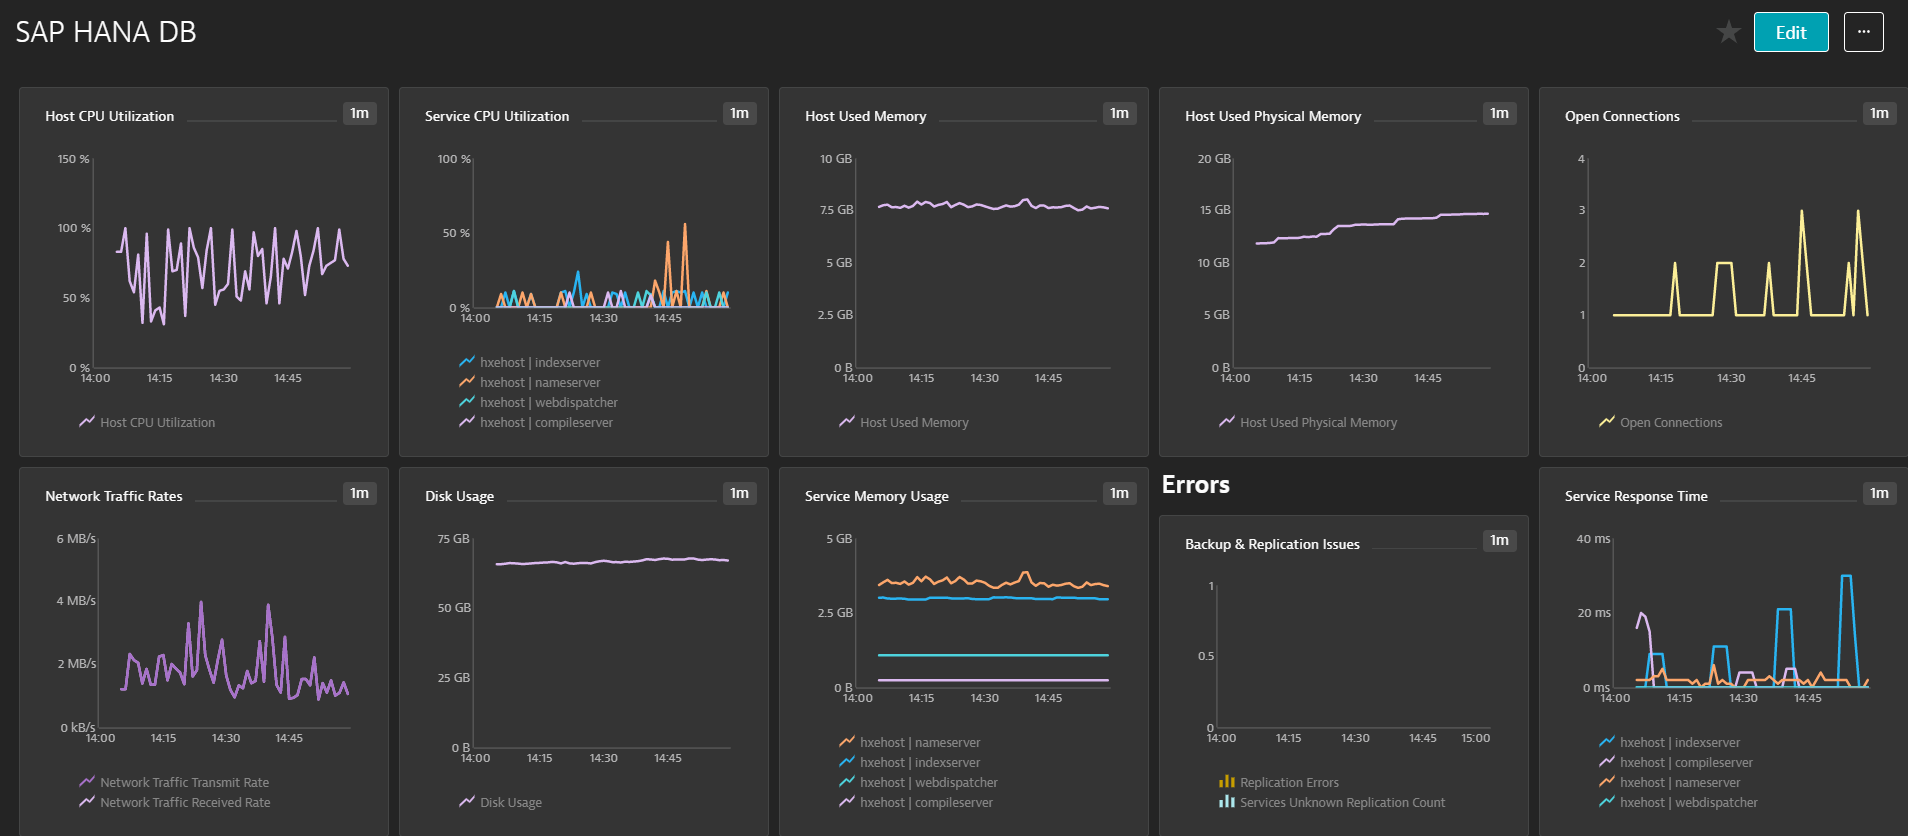
In response to customer feedback, we’ve distilled the vital information provided within HANA DB performance views down to a short list of metrics that offer comprehensive, detailed, and reliable insights into HANA DB performance. This short list of SAP HANA metrics provides you with more than enough detail to enable effective dashboard analysis in the Dynatrace web UI and to provide the Dynatrace Davis AI causation engine with the information it needs to automatically detect performance problems that affect the database.
Get up and running with no agent installation
The HANA DB monitoring extension uses a remote connection to pull performance data from the HANA DB server (using that same mechanisms that SAP tools use) while distilling the information that’s essential to KPIs. No agent installation is required on your SAP server. Captured metrics include infrastructure measures (CPU, Disk, and Network metrics) as well as details related to Backups, Savepoints, Replication, and more.
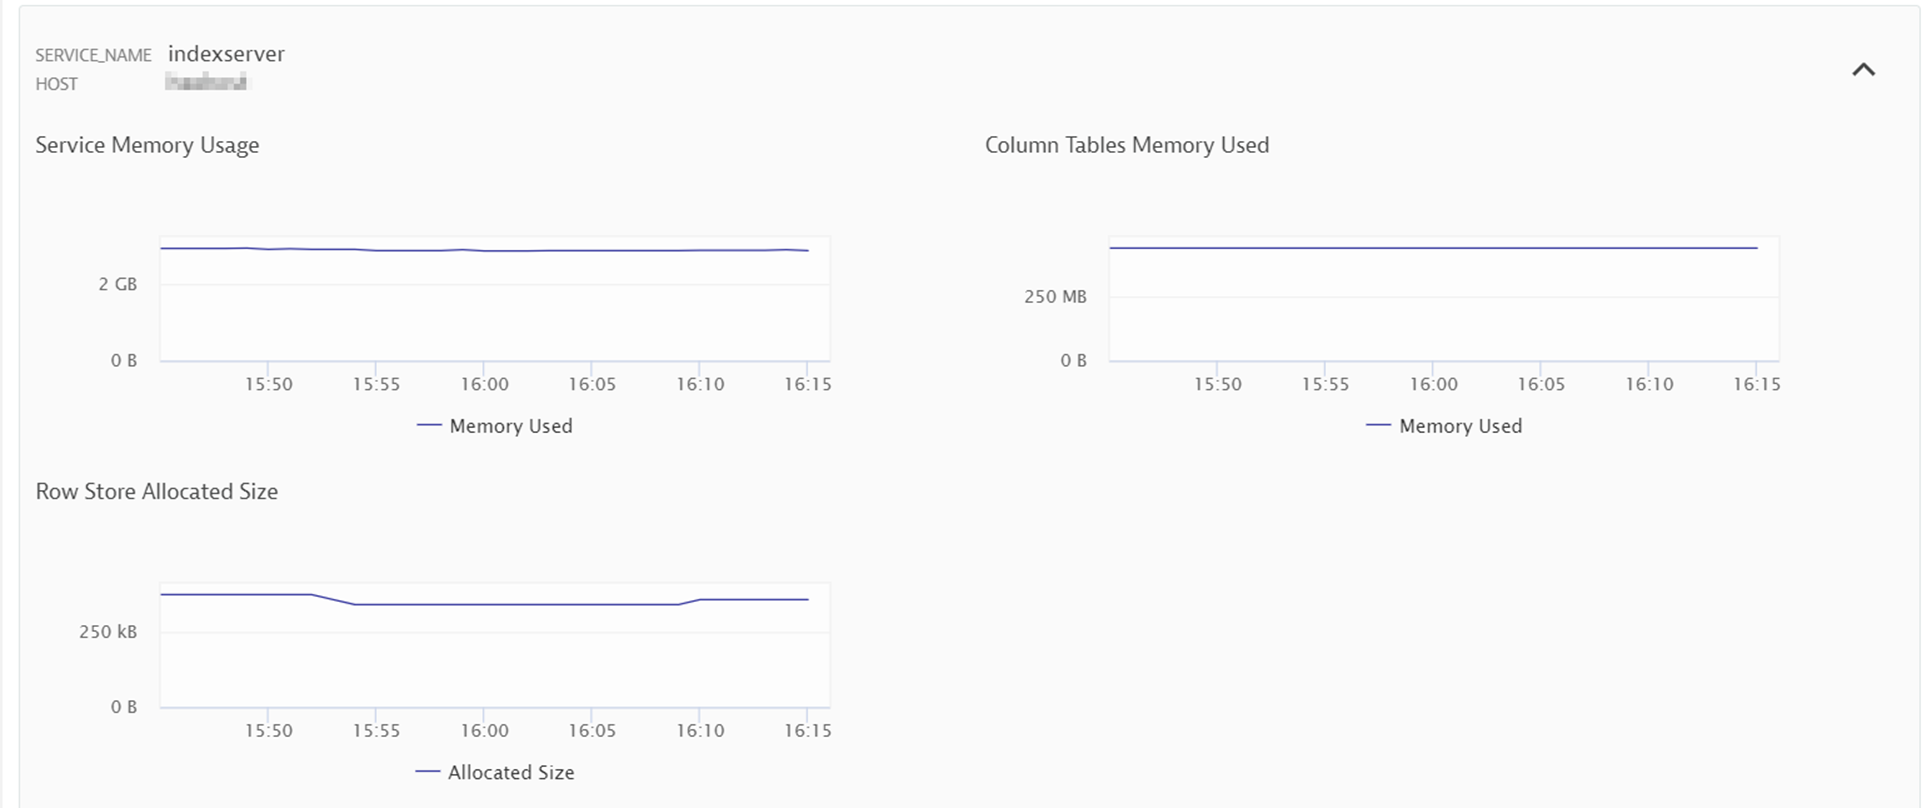
The ability to understand memory usage is a vital aspect of HANA database monitoring. Therefore, Dynatrace not only provides multiple metrics related to service and host memory usage, it also breaks down usage of the Column Table and Row Stores.
Enable the Davis AI causation engine to automatically analyze every metric
All metrics are analyzed for anomalies and used as input for automated problem analysis by the Davis AI.
The SAP HANA monitoring extension is preconfigured to watch for specific SAP HANA events and issues, like back ups, replication errors, and high CPU utilization.

Avoid false positives with auto-adaptive baselining
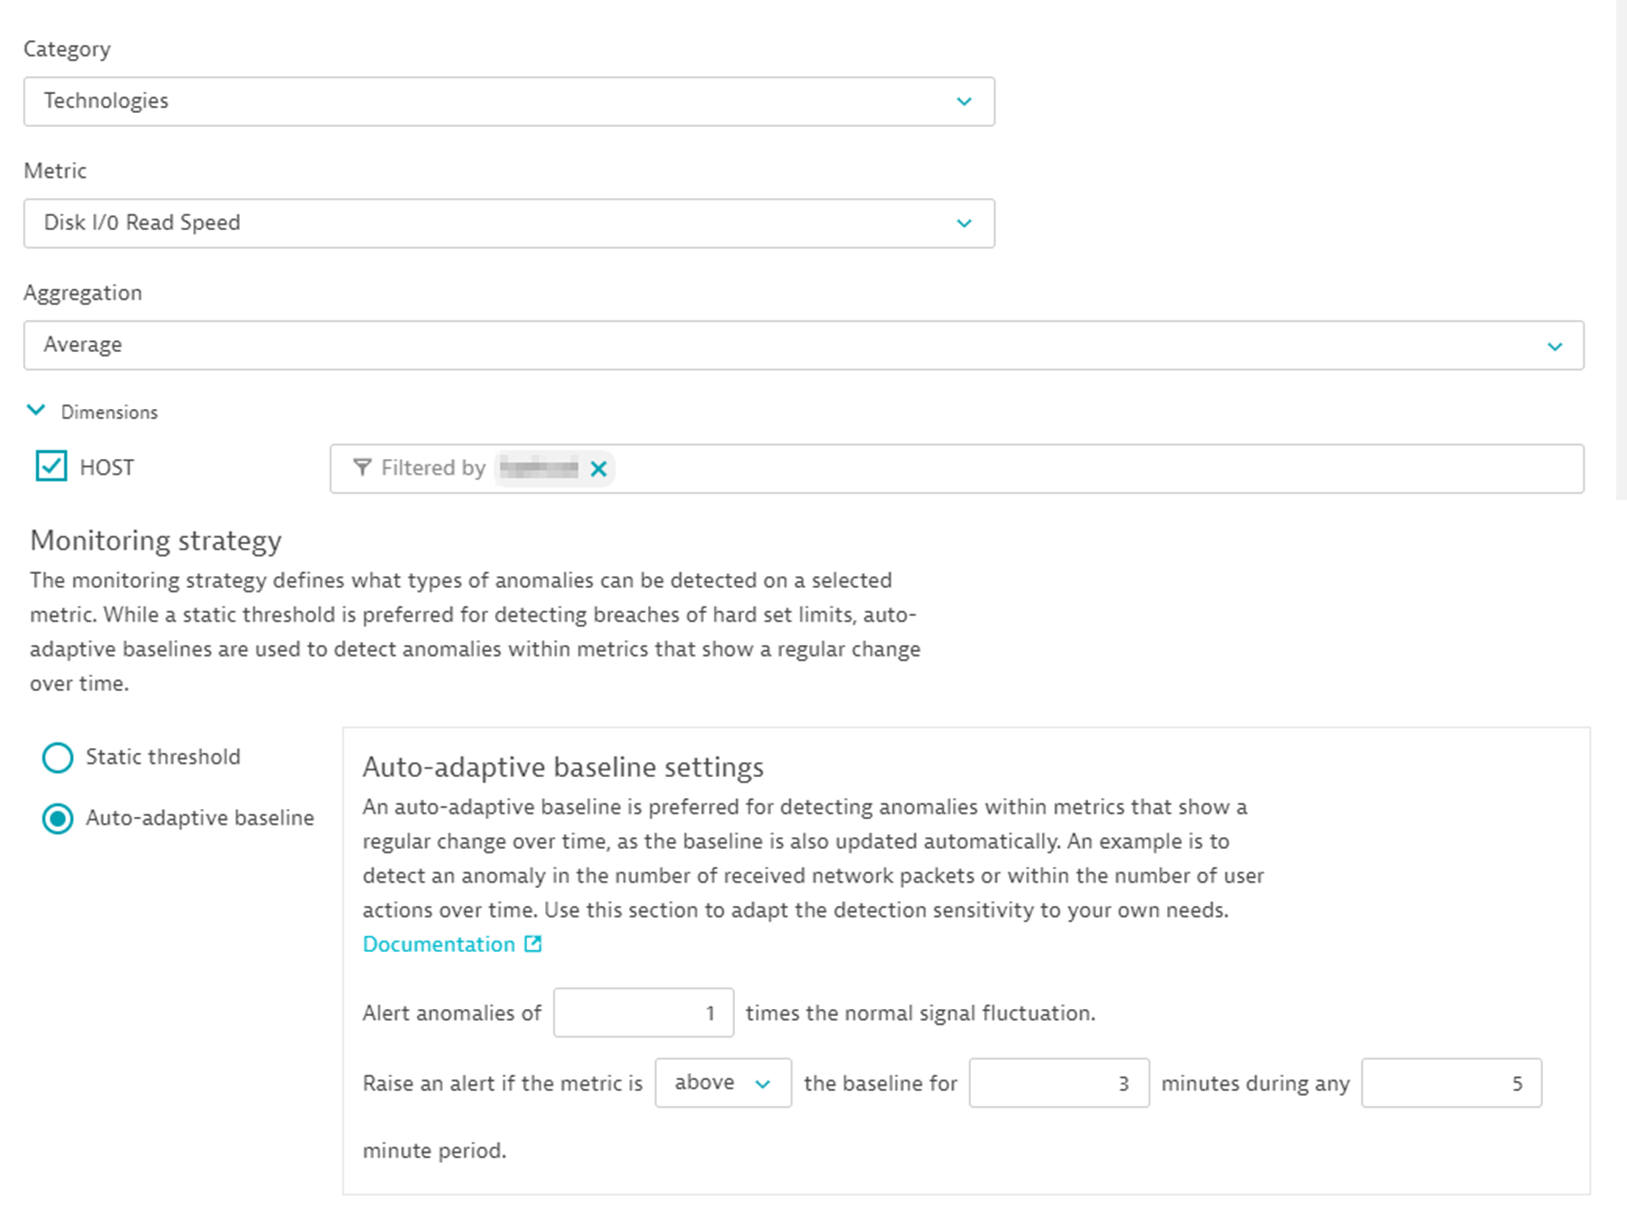
It’s easy to create custom events for alerting on any of the SAP HANA metrics that are provided by the extension. By creating custom events you can take advantage of Dynatrace auto-adaptive baselining. The key benefit of an auto-adaptive baseline is that it adapts to changing metric behavior over time, thereby avoiding false-positive alert spam.
Migrate confidently with simplified observability into your database components
Along with important time series metrics, the SAP HANA DB monitoring extension also reports on the properties and statuses of the various SAP database components. This includes the database version, licensed memory amount, if the license is valid or about to expire, and if the component services are running and healthy.
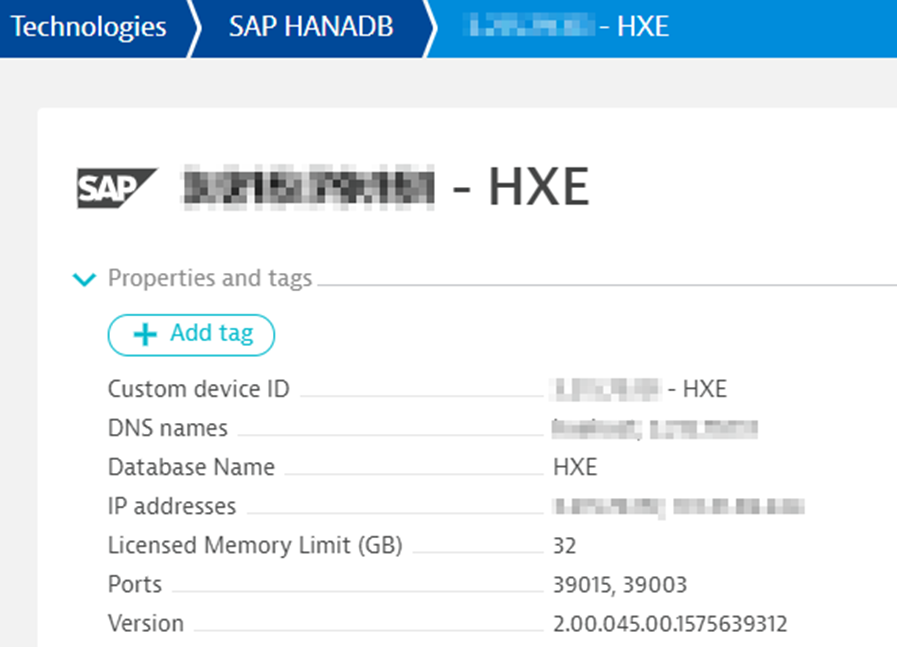
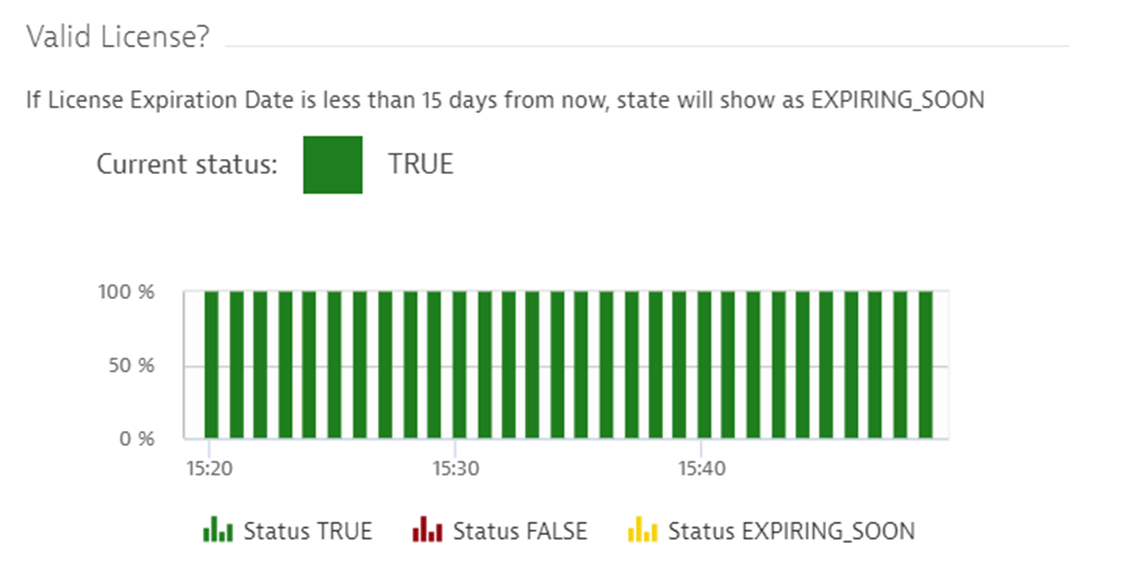

Such simple status details become crucial in dynamic environments, especially during migrations, when not only is infrastructure migrating from traditional data centers to hybrid clouds, but SAP enterprise systems are migrating to HANA. Such massive changes demand thorough observability of all database components so that supported business operations aren’t interrupted. It all starts with simple and reliable measurements of system performance, usage, and availability. And that’s exactly what Dynatrace provides for key SAP technologies, now including SAP HANA DB.
How to get started
To get started, just click the chat button in the upper-right corner of the Dynatrace menu bar to contact a Dynatrace ONE Product Specialist. Dynatrace ONE will make sure you have what you need to monitor SAP HANA databases.
Update 08.04.2021
We are pleased to announce that this extension is now generally available (GA). The full documentation for this extension can be found here.


Looking for answers?
Start a new discussion or ask for help in our Q&A forum.
Go to forum