Revamped user interfaces for HTTP and third-party synthetic monitors ensure you have all the important insights at your fingertips to effortlessly monitor API endpoints and mobile back-end services.
APIs are everywhere these days—from internal APIs that are used within your microservice architecture, third-party APIs that your software relies on, to external APIs that you offer to your customers. So when an API breaks, your business is impacted. Dynatrace HTTP monitors help you to ensure that your APIs are available and performing well from all locations around the world in compliance with your SLAs. HTTP monitors are the perfect tool for proactively monitoring API endpoints, API transactions (for example, CRUD scenarios), health-check endpoints, and your mobile back-end services.
Since their introduction in 2018, Dynatrace HTTP monitors have proven to be the most unique and complete solution available for monitoring your APIs and are now considered to be a critical component of the observability strategies of many of our customers.
As we’re seeing an ever-increasing interest in HTTP monitor usage, we’ve also received quite a bit of feedback from our customers. Therefore, today we’re happy to announce that we’ve greatly enhanced our HTTP monitor and third-party monitor details pages.
All insights at your fingertips with the revamped HTTP monitor details page
With the new page design, you can:
- Instantly understand the scope of problems with aggregated availability
- Understand global performance at a glance
- Use filters to focus on the locations that you’re most interested in
- Explore further with detailed timings for HTTP requests
- Actively monitor your mobile app’s back-end service availability
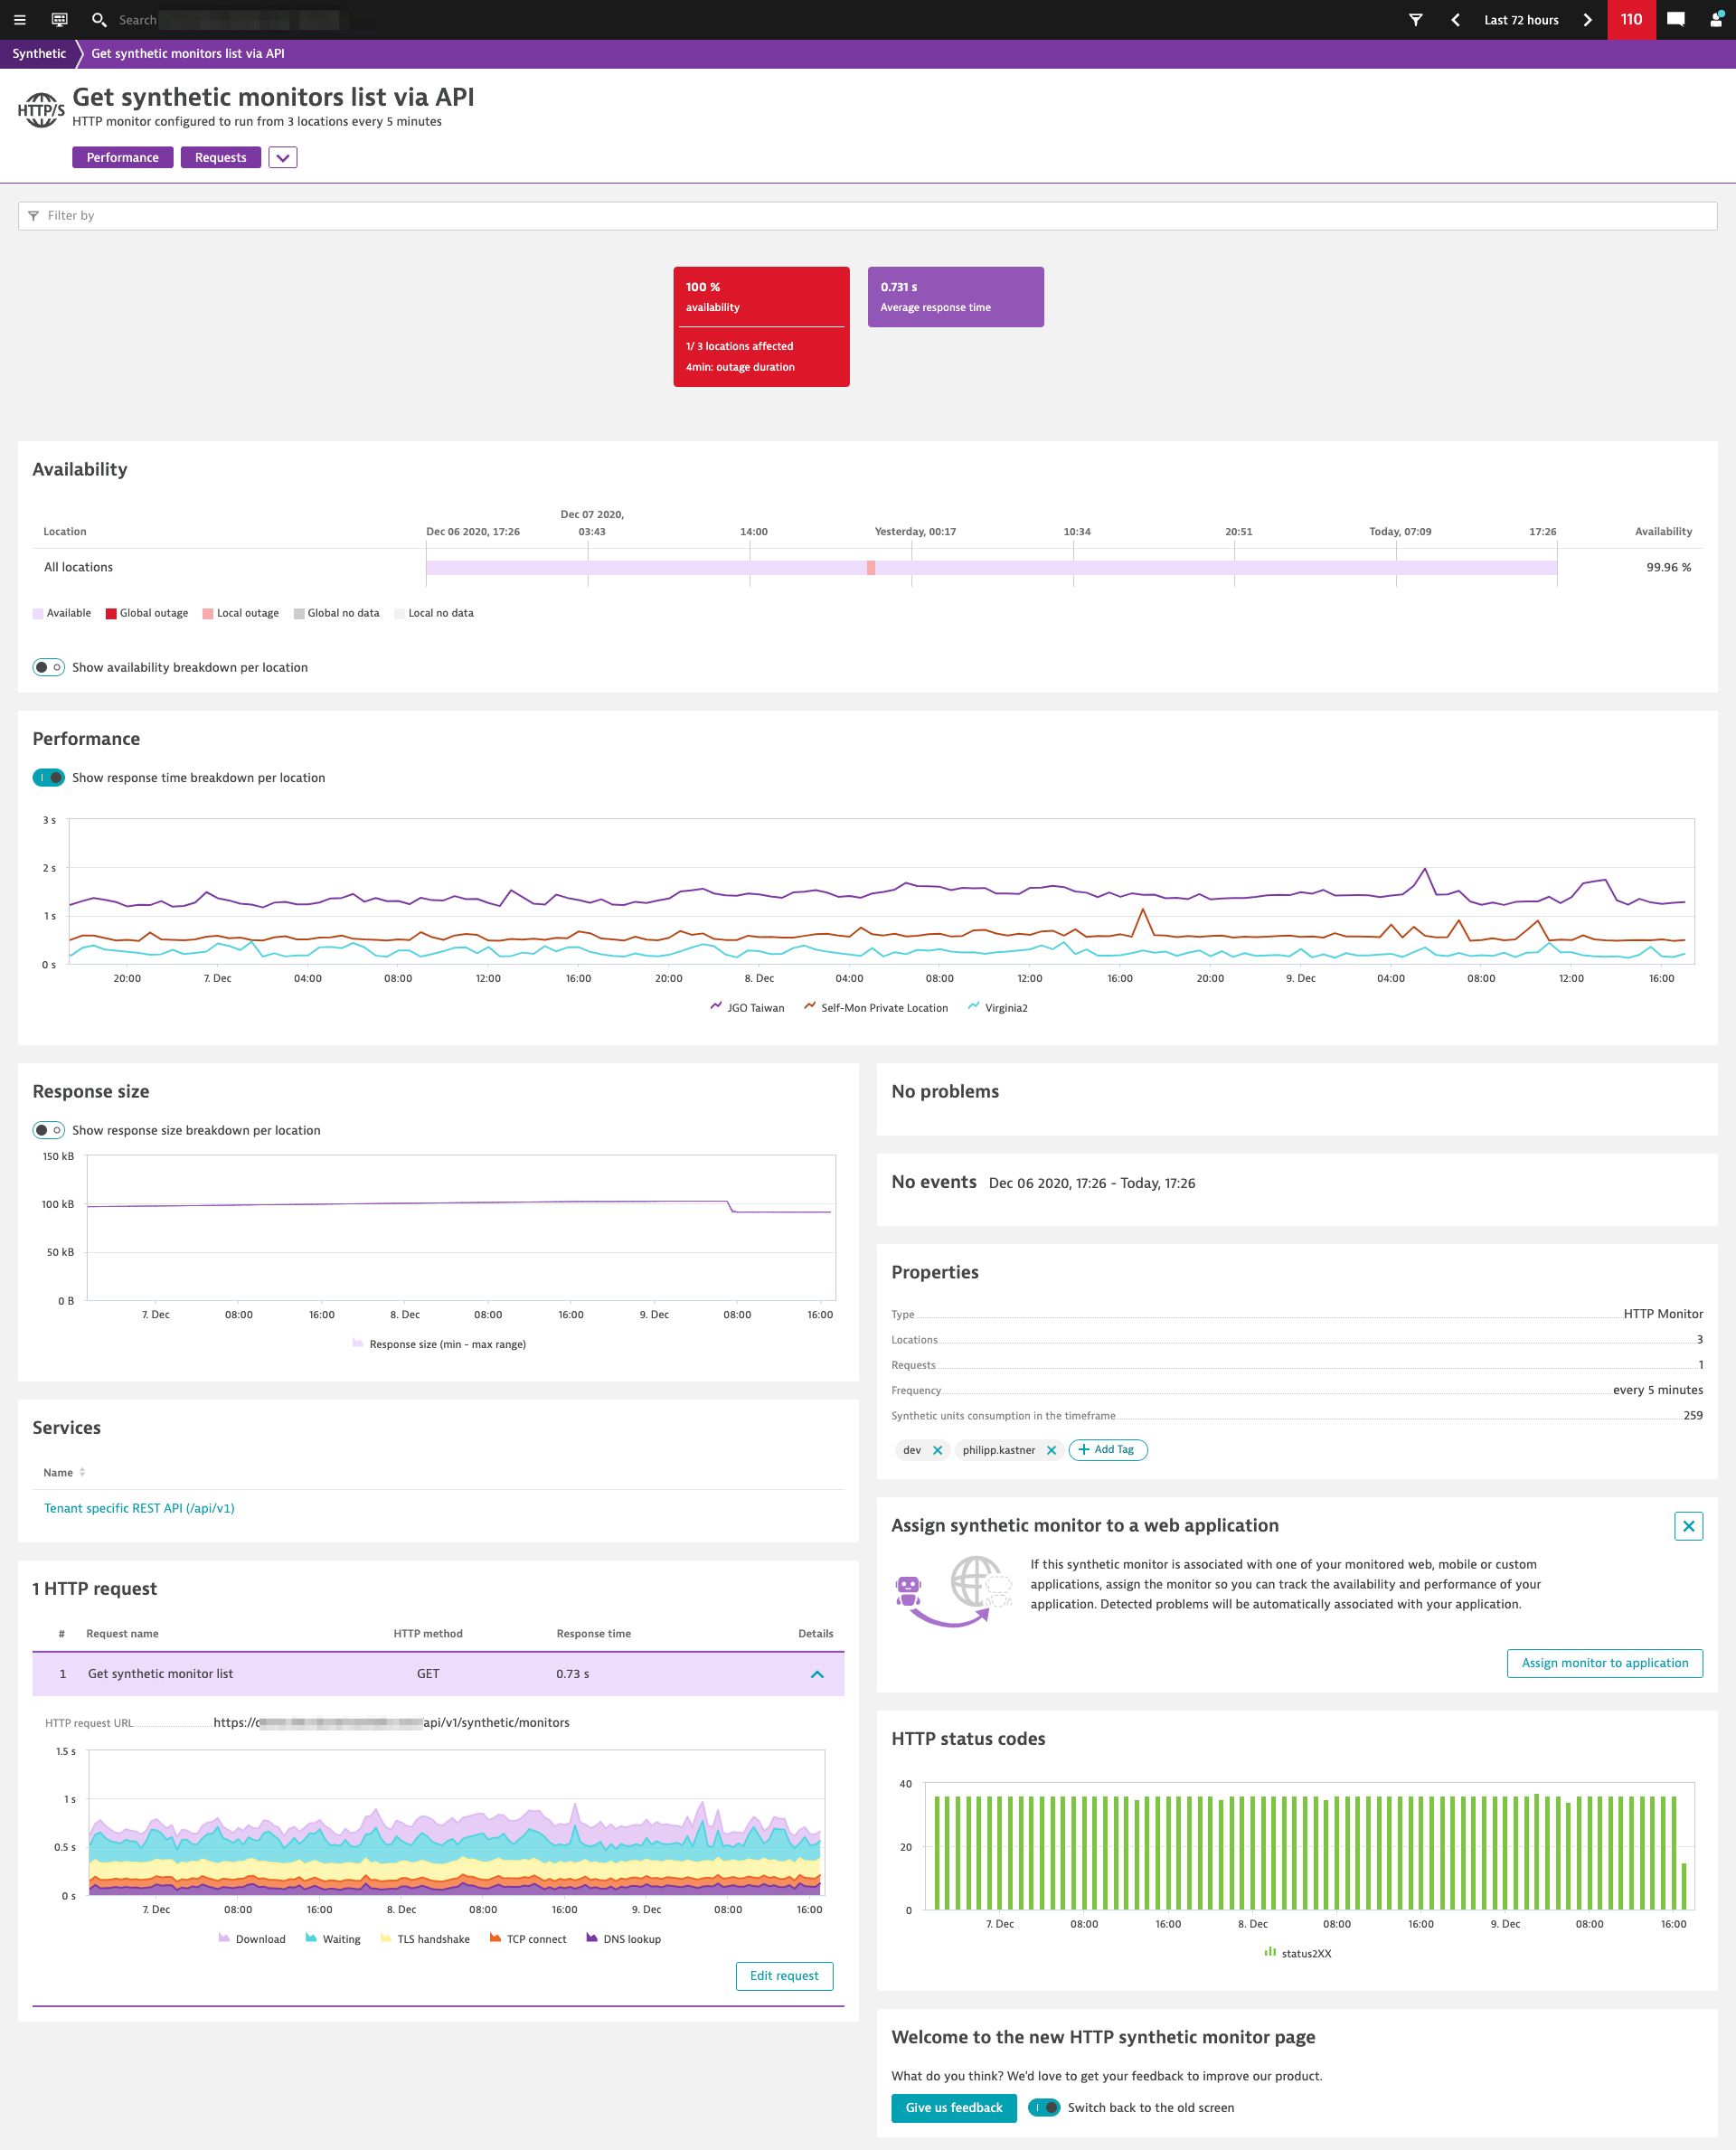
In the next sections of this blog post, we’ll walk through some of the highlights of the new page design. All screenshots featured in this blog post are taken from an actual HTTP monitor that we use at Dynatrace for self-monitoring (in the spirit of “eat your own dog food,” or, “drink your own Champagne” as we prefer to say).
Instantly understand the scope of problems with aggregated availability
HTTP monitors are usually executed from multiple, private (internal on-premises) and public locations to ensure availability from different geographies. The new availability card now offers a simplified view of global, overall availability.
At a glance, you can easily distinguish if an outage was local (unavailable at only a subset of locations) or global (unavailable at all locations). Whenever you need more detailed information, just select Show availability breakdown per location to see availability details per location.
Understand global performance at a glance
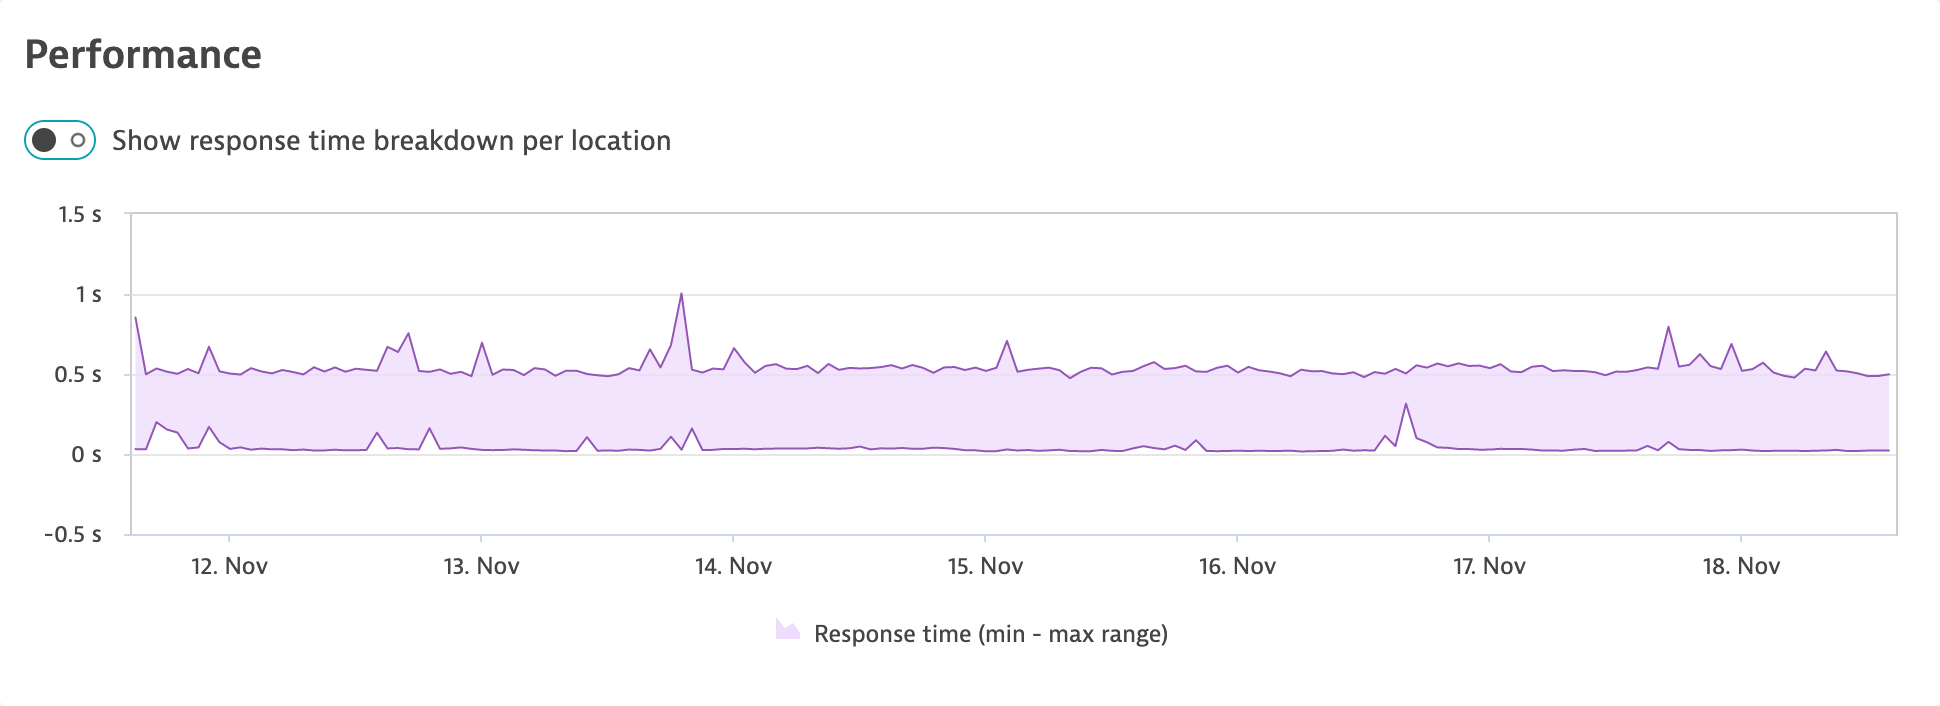
Usually, the second most important question after “is it available?” is “is it performing well?” Following the same principle used for aggregating availability data, the Performance card now shows the minimum and maximum response times by default. The range chart makes it easy to understand the spread of the response time. If the response time changes, it provides a clear indication as to whether or not the requests have slowed generally or only at a specific location.
Select Show response time breakdown by location to view the response time split by monitoring locations.
Use filters to focus on the locations that you’re most interested in
In some instances, you might want to focus on one or multiple locations to better understand geography-specific behavior. You can now easily filter the entire details page for specific locations using the filter field at the top of the page. This helps you focus on the details that are most relevant to your analysis.
Explore further with detailed timings for HTTP requests
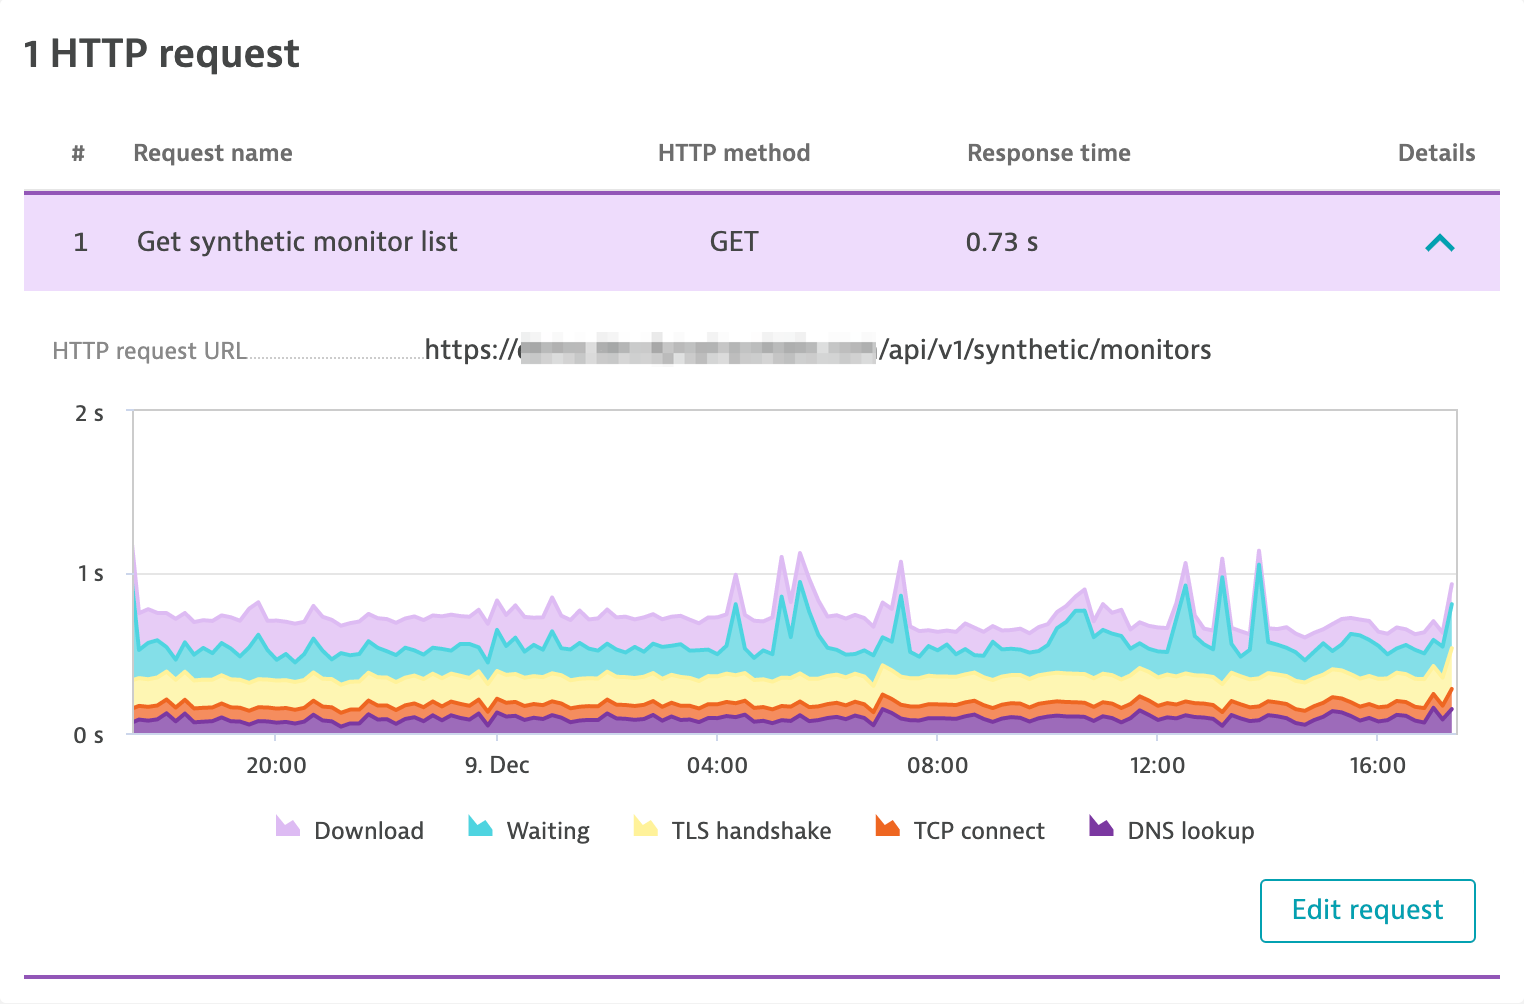
An HTTP monitor can consist of one or multiple HTTP requests. The HTTP request card gives you an overview of all executed requests, their order, name, and the HTTP method used.
If you expand a request, you’ll see detailed timings for the request. The stacked chart shows all individual timings that add up to the overall response time of the request.
- DNS lookup time: Amount of time taken to resolve the host name—If there are multiple DNS calls because of a redirect, this is the total time of all DNS calls.
- TCP connect time: Amount of time taken to establish the TCP connection—If there are multiple TCP connections because of a redirect, this is the total time of TCP connection attempts.
- TLS handshake time: Amount of time taken to complete the TLS handshake
- Waiting: Amount of time taken for the server to respond with the first byte—This equals Time to first byte minus (DNS lookup time + TCP connect time + TLS handshake time).
- Download: Amount of time taken to download the HTTP response
Actively monitor your mobile application’s back-end service availability
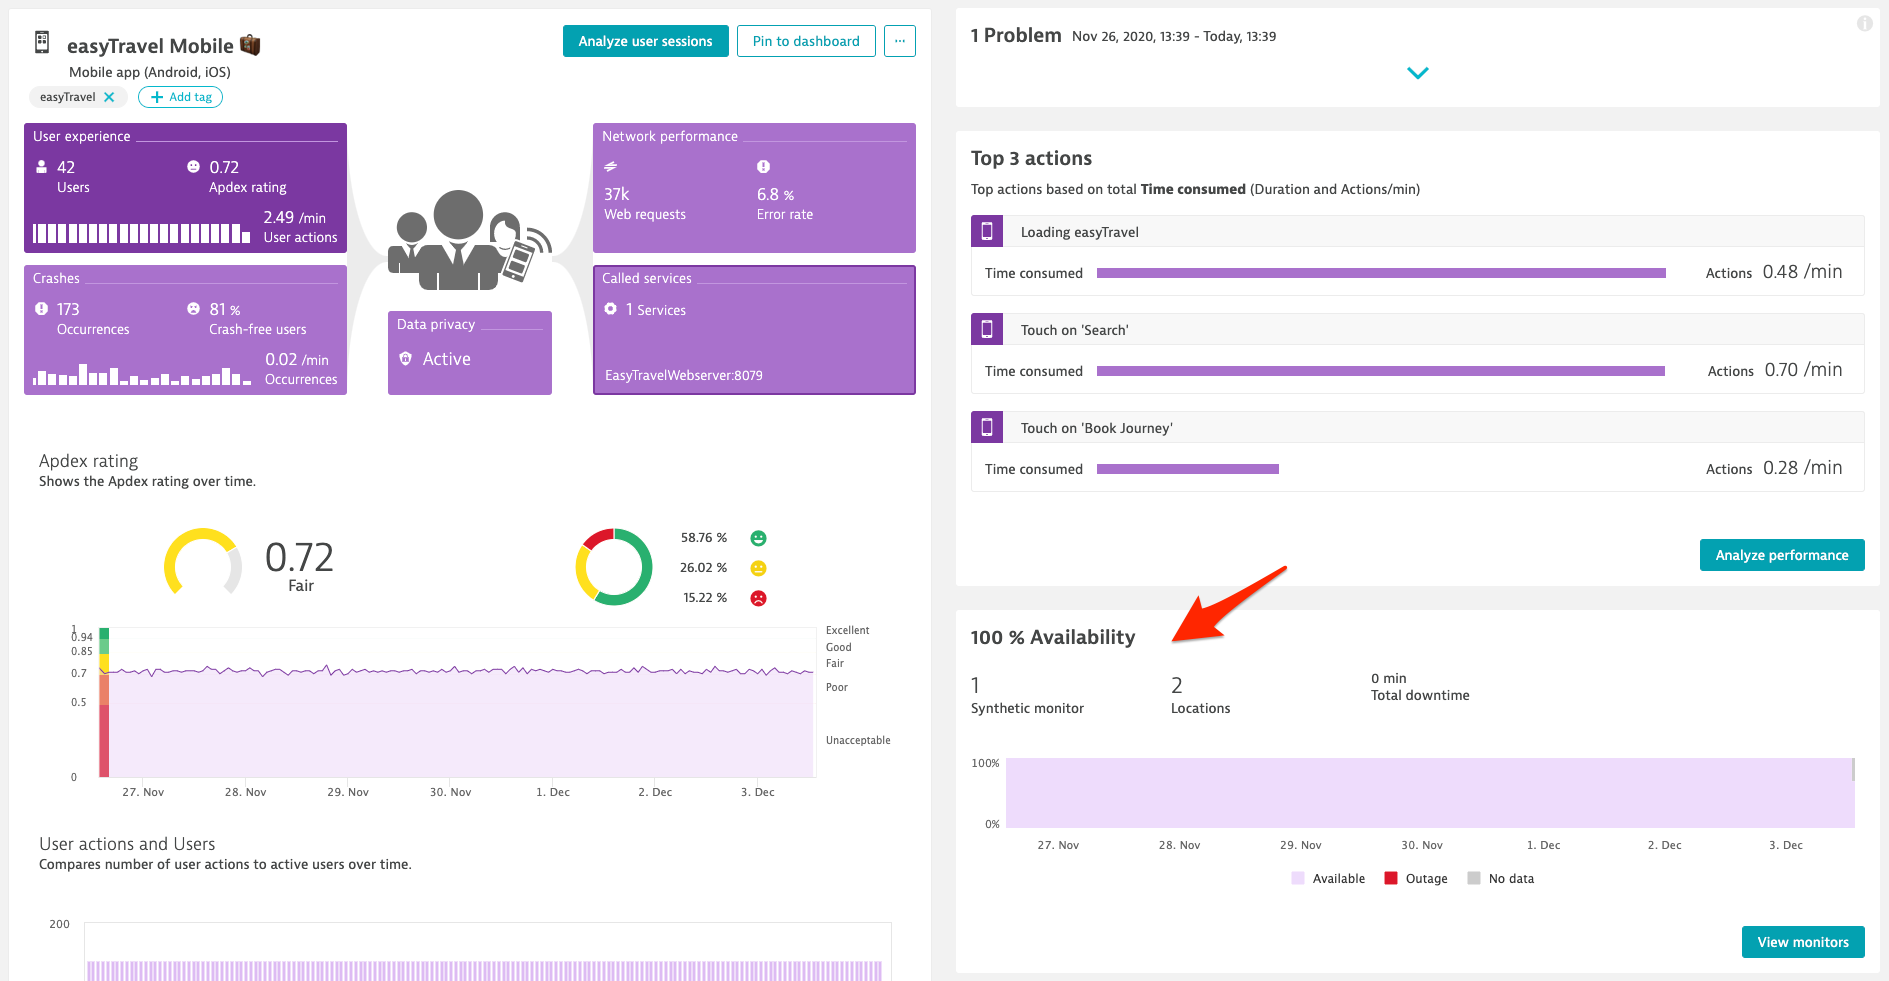
HTTP monitors are a great way to monitor the most important APIs used by your mobile apps. Usually you have some key back-end services for login, checkout, or search operations. These APIs are worth actively monitoring 24/7 to ensure the availability and functionality of your mobile apps around the globe. Now you can link HTTP monitors to mobile apps (as well as web and custom applications) via the Assign synthetic monitor to an application card.
After you have linked an HTTP monitor to a mobile app, synthetic monitor availability is displayed directly on the mobile app details page, and Davis® automatically associates detected synthetic monitor problems with the linked app.
Push third-party synthetic data to Dynatrace—analyze all your monitoring data in a single location
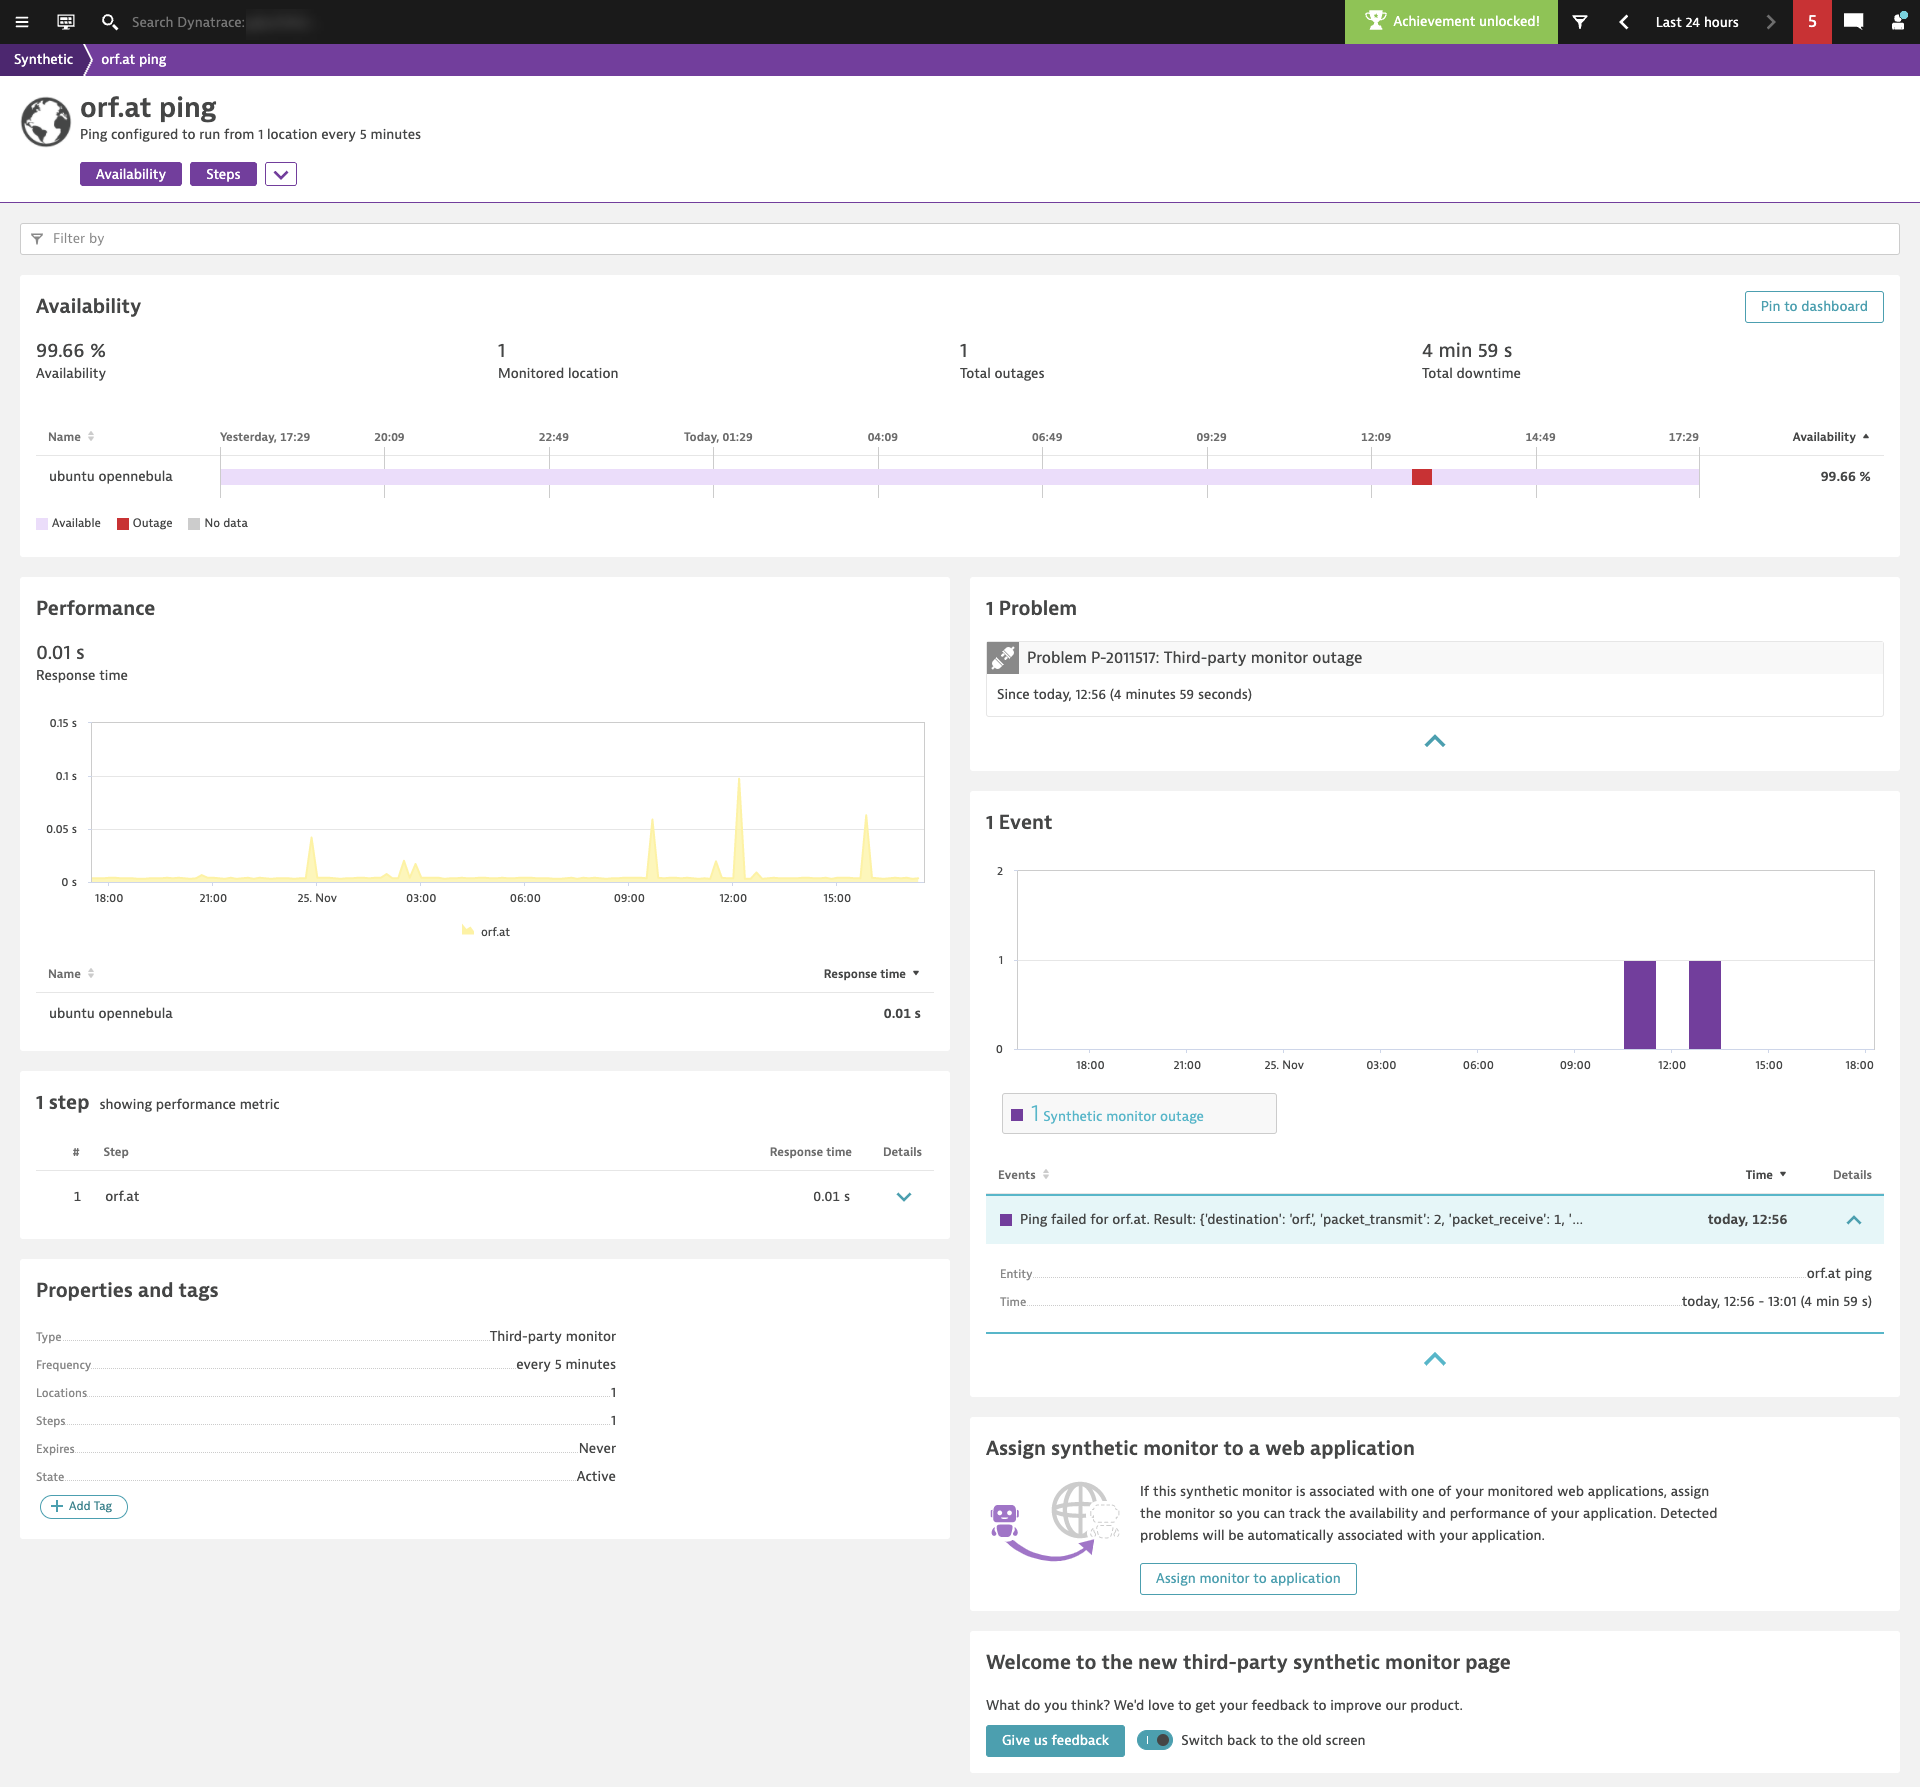
We’ve also refreshed the third-party monitor details page in a similar way. Third-party monitors allow you to ingest third-party synthetic data into Dynatrace.
For example, you can use third-party monitors to enrich Dynatrace data with synthetic results from a homegrown synthetic solution. You can even assign external synthetic data to the applications that you monitor with Dynatrace. As soon as they’re linked, Dynatrace augments its real user data with external synthetic data and correlates any detected problems. With this approach, you can analyze external synthetic data directly on your Dynatrace dashboards.
Third-party monitors are also a good way to perform synthetic DNS lookups, port checks, and pings, as my colleague Michael Lundstrom describes in his blog post.
We’d love to hear your feedback!
As mentioned earlier, a lot of these improvements are based on your feedback. But we’re not done yet, and this is just the first iteration of the new page design. If you have feedback you’d like to share with us, please select the Give us feedback button that appears on each monitor details page.
You can try out the new monitor details pages at any time. And for now, you can switch back and forth between the new and the old versions of the page.
What’s next
For the HTTP monitor details page, these changes are only a first step toward providing you with even more insights. We’re working on capturing additional details, like response body and header details that will help you (and the Dynatrace Davis AI causation engine) to better understand HTTP monitor–related problems and ensure that all your APIs are 100% available and working at all times.






Looking for answers?
Start a new discussion or ask for help in our Q&A forum.
Go to forum