Automatic and smart troubleshooting workflow ensures OneAgent health across the most complex hybrid cloud environments, all while greatly improving your customer support experience.
“I’m excited to contact customer support today”
— said no one ever.
With a growing product, new end user features every other week, and an ever expanding user base, we at Dynatrace are laser-focused on automating quality and stability, as we see these attributes as our clear competitive differentiators. Everything we build is built with a NoOps mindset, meaning that no traditional operational tasks are necessary to deploy and operate Dynatrace.
However, there are things that are outside of our control. For example, it might happen that a certain technology in your environment requires an adjustment or assistance from Dynatrace Support. In such cases too we want to provide you maximum automation, because it’s imperative that you can automatically pin-point where exactly in your complex environment there is need for extra attention.
To deliver a speedy resolution for such circumstances, and further improve supportability, we’re happy to introduce the fully automated OneAgent support self-service for both Dynatrace SaaS and Managed environments.
The self-service will allow you to:
- Automatically pin-point a specific OneAgent-related issue in highly dynamic environments, at a specific point in time
- Easily collect the diagnostic data for a specific entity, and automatically get potential solutions for detected anomalies
- Quickly resolve common issues on your own, reducing the amount of time spent on diagnosing
- Directly provide Dynatrace Support with all the details they need to diagnose the issue
Automatically get solutions to your host or process issues
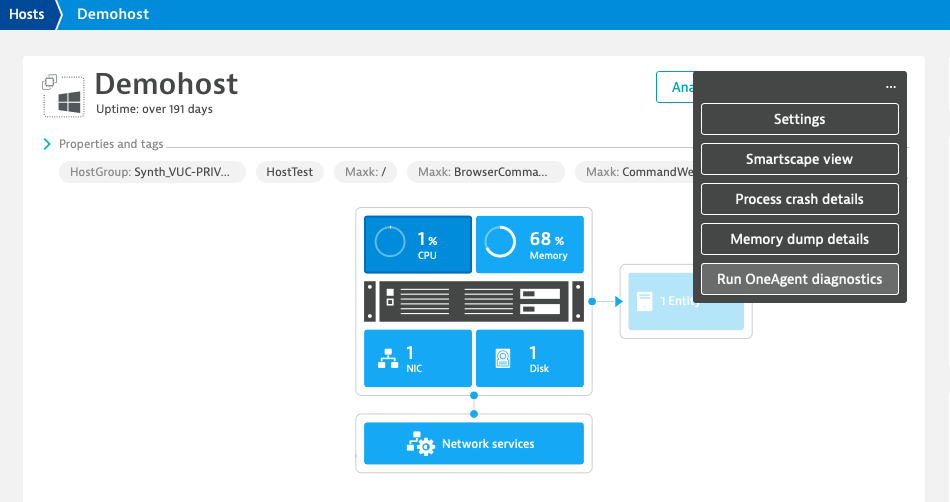
To start the automated OneAgent troubleshooting workflow, just select Run OneAgent diagnostics on the affected host or process.
Note: this troubleshooting workflow replaces the Download support archive feature. As with the Download support archive, you need the View sensitive request data environment permission to access this feature.
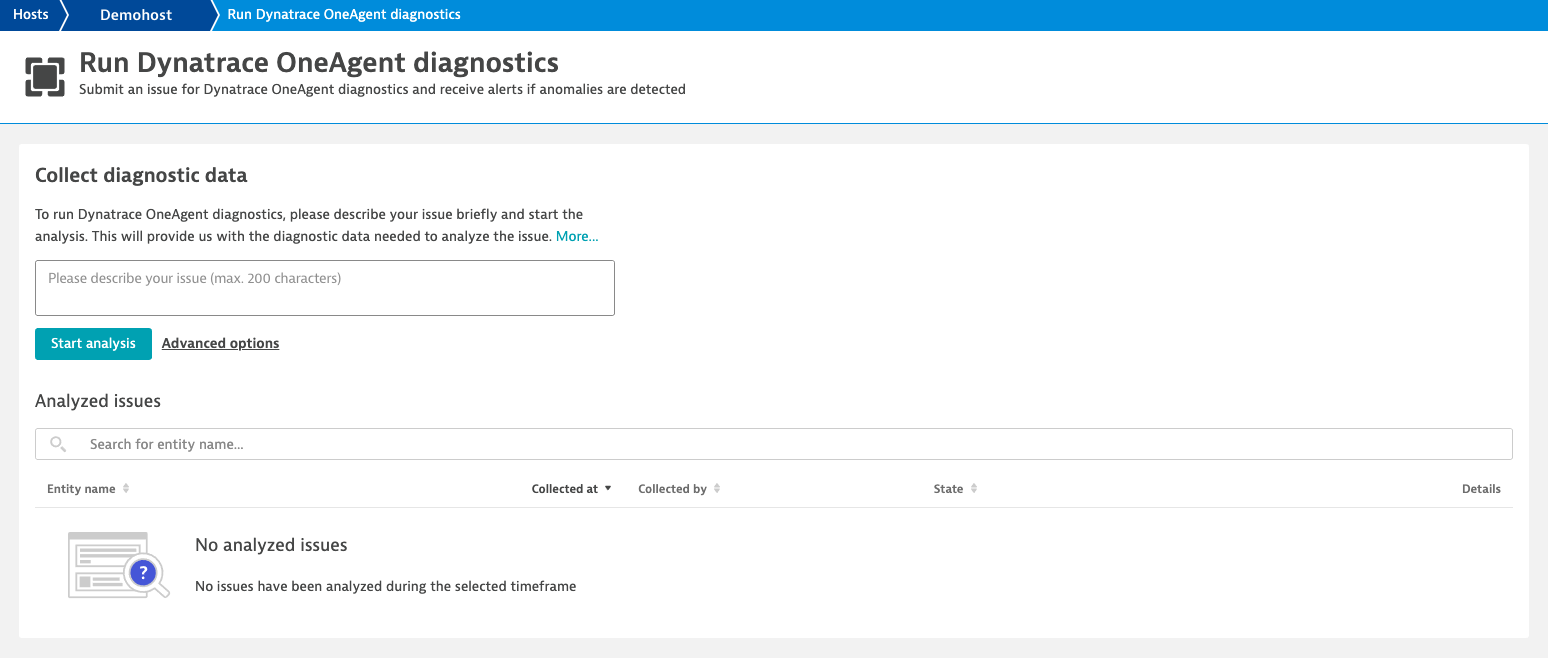
For the troubleshooting of your issue in a targeted manner, you are then prompted to enter a short description of what isn’t working as expected from your point of view. Once you select Start analysis, Dynatrace:
- collects diagnostic data for the last 24 hours of the affected host or process,
- stores the collected diagnostic data in your Cassandra database
- uploads the diagnostic data to a Dynatrace AWS S3 bucket for further analysis
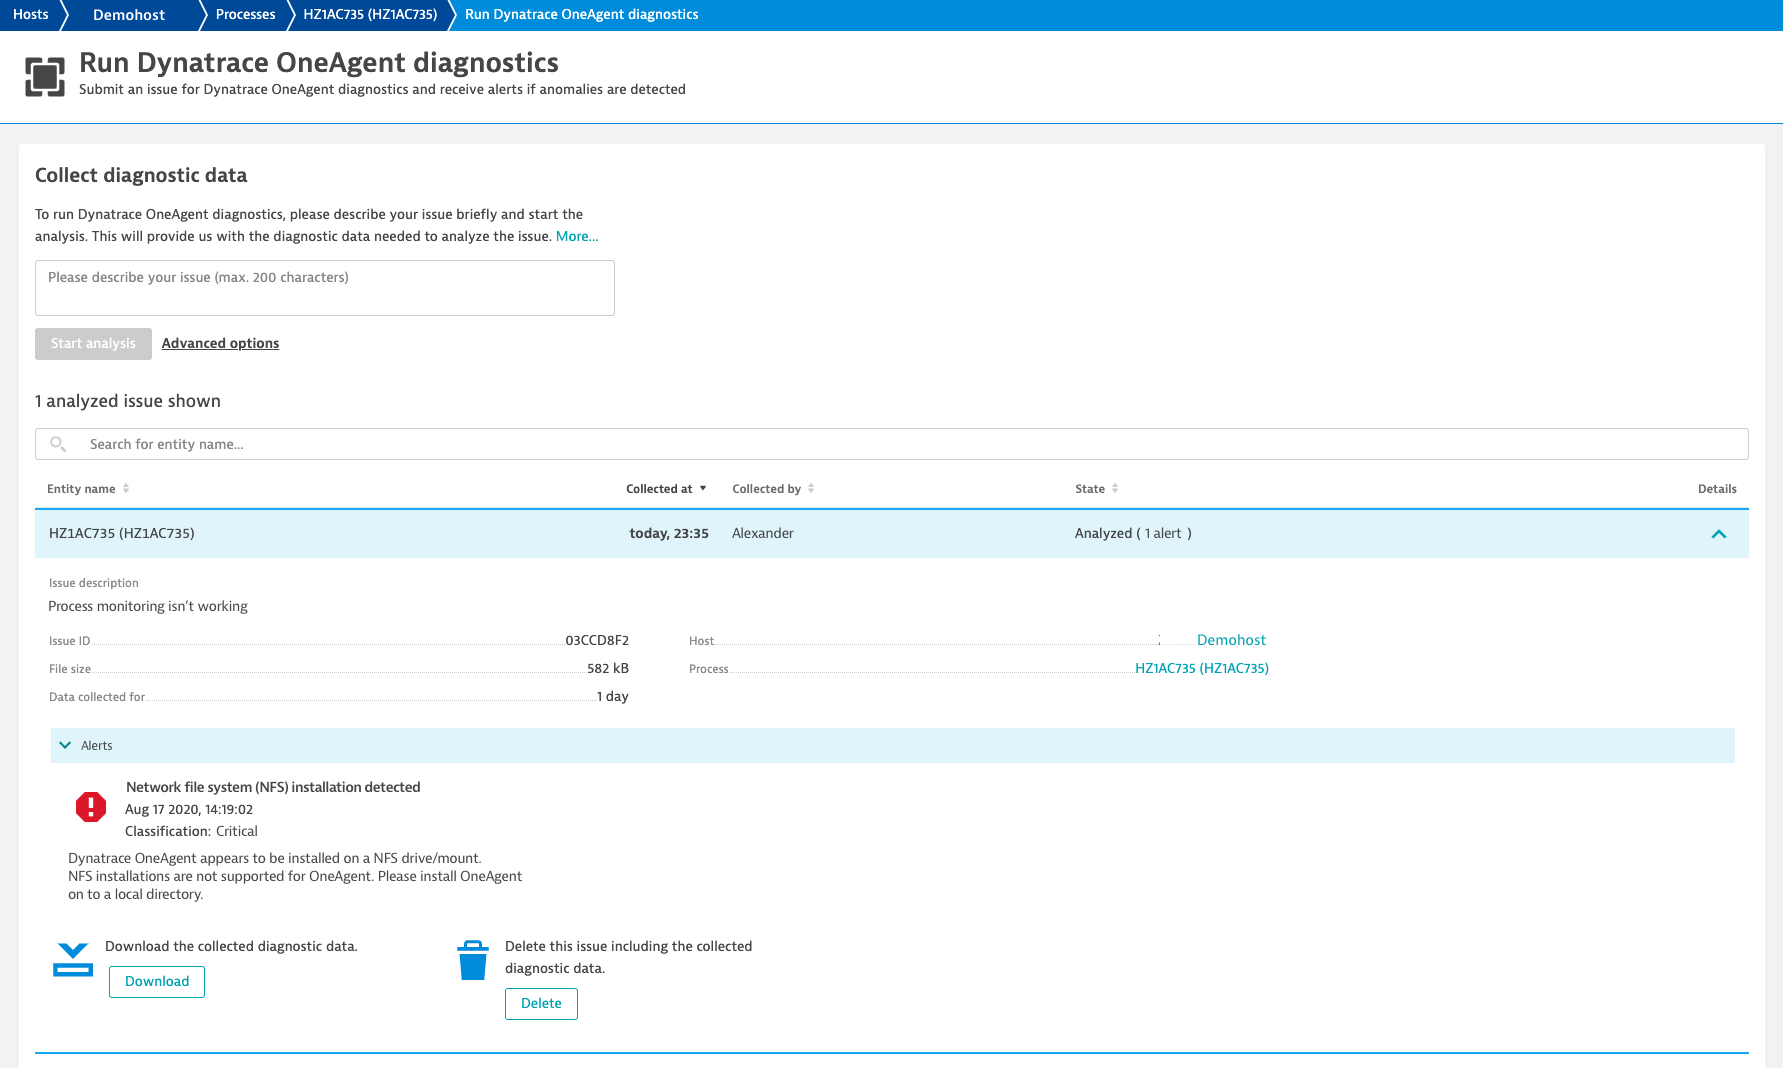
Once the analysis is complete, Dynatrace sends the results back to your environment. If a potential solution is identified, you will see it listed in the Alerts section. In the example below, you can see that the fully automated OneAgent troubleshooting workflow has detected that this OneAgent was mounted on a network file system (NFS), which isn’t supported. Instructions for resolving the issue are included.
If needed, easily review the diagnostic data before analysis
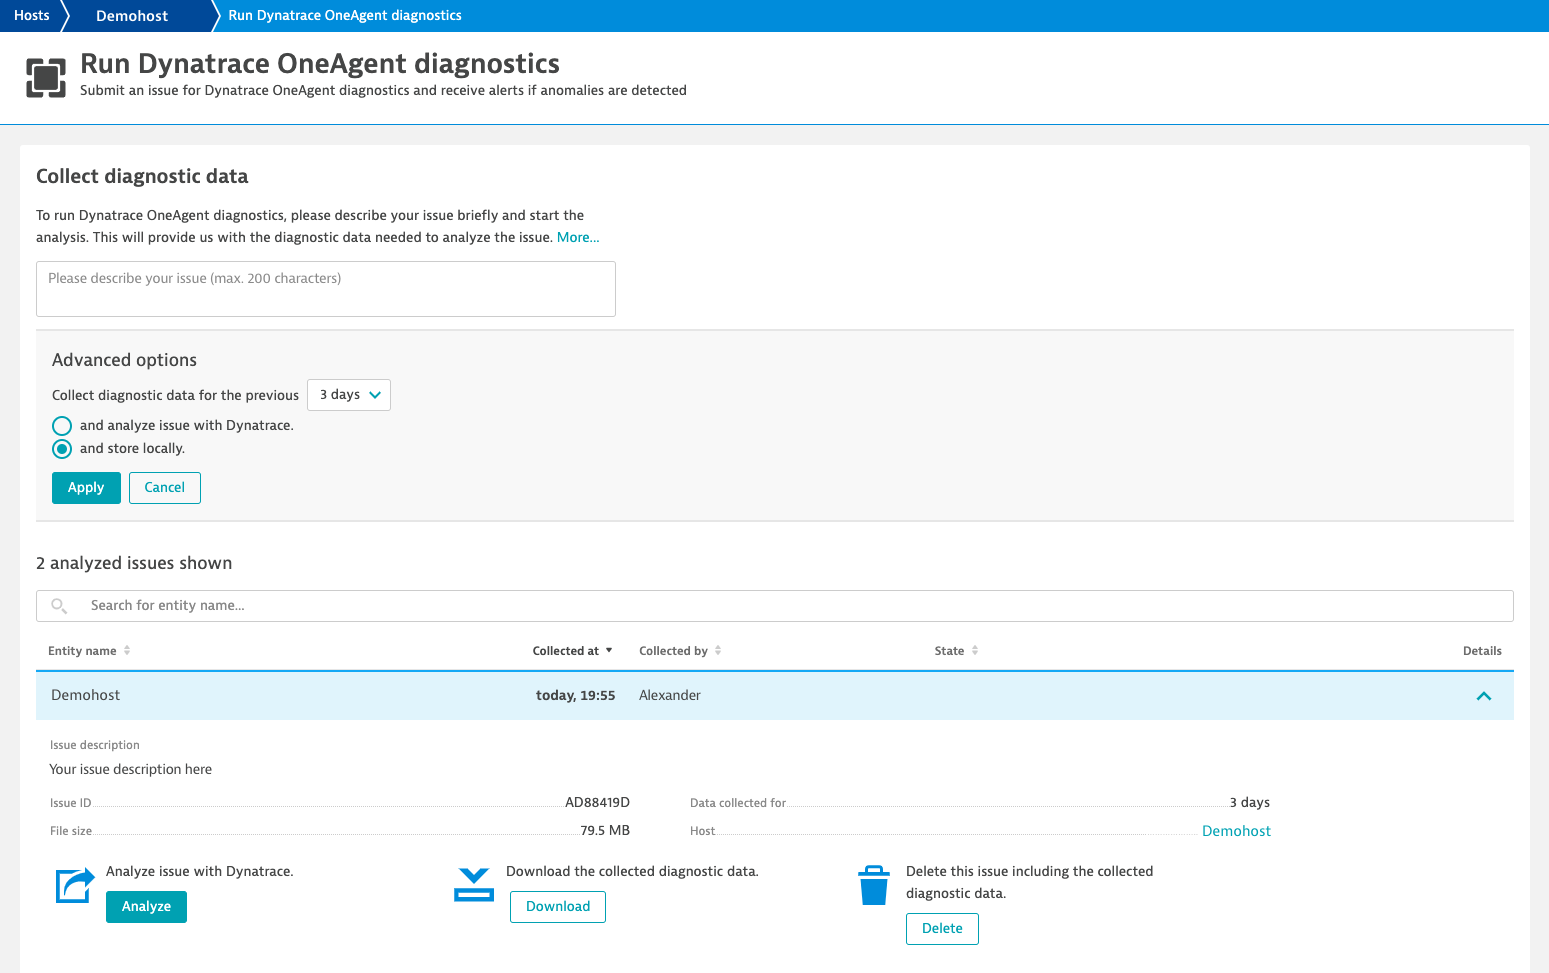
If you want to review the collected diagnostic data before analyzing it with Dynatrace, select the Store locally option in the Advanced options. You can even adjust the number of previous days that should be included in the diagnostic data (up to 7 days back). When the Store locally option is selected, the collected diagnostic data is stored in your local Cassandra database, but no further analysis is applied.
You can download the collected diagnostic data from the newly created record by selecting Download. After you’ve completed your review, you can analyze the diagnostic data with Dynatrace by selecting Analyze. Of course, you can delete the collected diagnostic data at any time. If the data has already been analyzed by Dynatrace, all references to the data in Dynatrace will also be deleted.
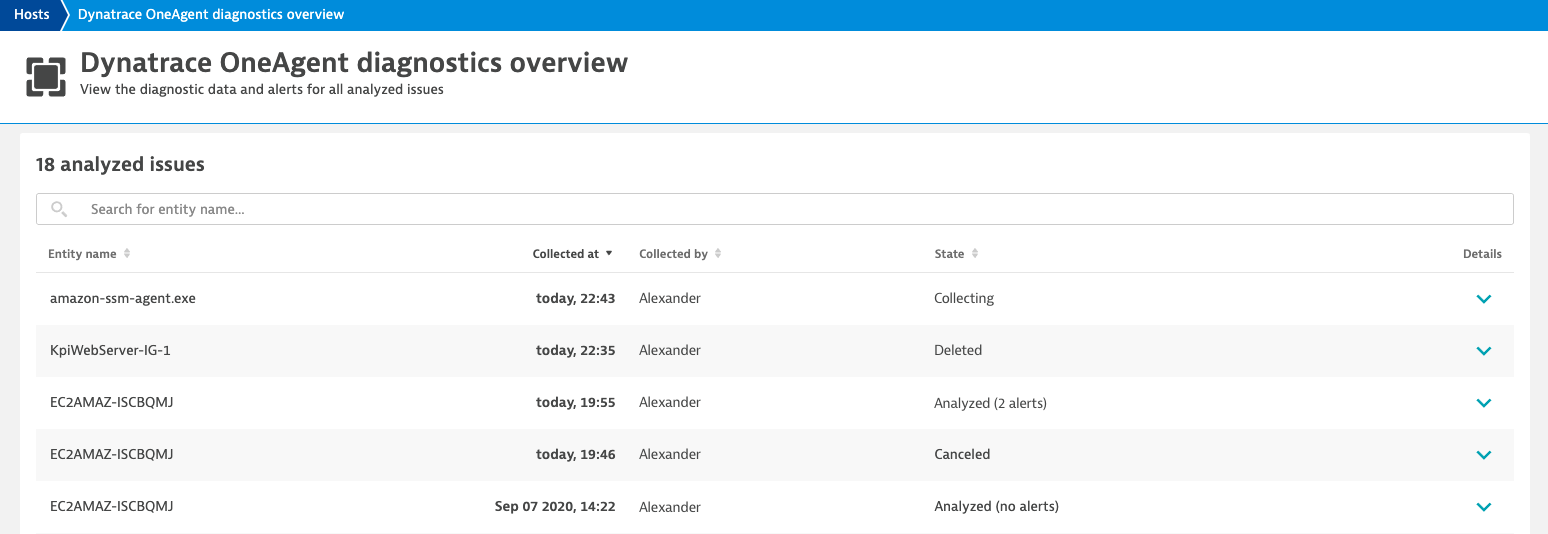
To get an overview of all OneAgent troubleshooting runs in your environment, select Hosts from the navigation menu, then open the browse (…) menu and select OneAgent diagnostics overview (see image below).
What’s included in the diagnostic data
All the collected diagnostic data is compressed into a ZIP file, which includes the following source files and folders:
- Support archive ZIP
Contains the local configuration of the OneAgent installed on the host or process where you’ve run the troubleshooting, as well as the OneAgent related log files. - Diagnostic files ZIP
Contains information about the process group detection, auto-injection problems, and OneAgent extension configuration. - Monitoring state JSON
Contains information about the monitoring state of processes and related problems. - OneAgent registration entries JSON
Contains information about which OneAgent code modules are connected to Dynatrace. - Host folder
Contains a snapshot of the topology information of the host entity including any relationships to other hosts. - Monitored entities folder
Contains a snapshot of the topology information of all involved process groups, process group instances, services, and service instances. - Archive JSON
Contains information about who, when, where, and why the diagnostic data was collected.
Full data privacy for all your diagnostics data
Dynatrace keeps a close eye on compliance with all regional data protection and privacy regulations. Therefore, Dynatrace masks some personal data (for example, IBANs and URI credentials) automatically before storing it in Cassandra. Dynatrace also automatically deletes all diagnostic data 30 days after its collection. This applies to both the data in your Dynatrace environment and on the Dynatrace Cluster.
If needed, you can delete collected diagnostic data earlier. However, to ensure transparency, Dynatrace keeps a small set of information about who, when, where, and why the diagnostic data was collected.
For complete details about Dynatrace data privacy, see Personal data captured by Dynatrace, Data retention periods, and Dynatrace compliance with GDPR for EU citizens.
OneAgent troubleshooting in Dynatrace Managed environments
In Dynatrace Managed environments, the OneAgent troubleshooting workflow begins with the option of automatically collecting the diagnostic data using the Store locally option, as described above. Once the collection of the diagnostic data is completed, you’re encouraged to add the data to your Support ticket, as usual. Our internal tools can then fetch the diagnostic data from your support tickets, analyze it, and provide automated feedback to Dynatrace Support about detected anomalies. Stringent data privacy protections are enforced and logged at each step during the process.
What’s next
The fully automated OneAgent troubleshooting workflow is still in an early phase, and we have several planned improvements in the works:
- Develop further capabilities for detecting anomalies in the diagnostic data and providing more valuable solutions.
- Release the fully automated OneAgent troubleshooting workflow to Dynatrace Managed environments.
- Extend the OneAgent troubleshooting concept to the Cluster Management Console.
Your feedback
If you have questions or comments about this announcement, we’d love to hear from you. Please reach out to us via Dynatrace Community, directly within the product via Dynatrace ONE chat, or via your Dynatrace Account Manager.




Looking for answers?
Start a new discussion or ask for help in our Q&A forum.
Go to forum