Dynatrace is happy to announce the improved Monitored entities REST API v2. Use it to flow Dynatrace context information into third-party integrations and massively automate business-critical processes like deployment pipelines, CI toolchains, and cloud migration projects.
The world is moving faster than ever. To drive productivity and boost efficiency, enterprises are increasingly automating their critical business processes. At the same time, navigating modern IT infrastructures can seem like stumbling through a maze, as they’re becoming overly complex, containing hundreds of technologies and billions of dependencies. So how can your Operations teams automate processes such as CI/CD deployment pipelines, configuration changes of ITSM tools, or the simple generation of a monthly architectural topology report if they’re struggling to find critical information about your highly complex environments? With Dynatrace, all this can be done easily.
One of the many ways our customers can cut through this ever-growing complexity is by using the Dynatrace Monitored entities API v2. This version 2 API helps you integrate Dynatrace context information into all kinds of automation workflows, from cloud migration projects, through deployment pipelines, and CI tool chains.
Read on to learn more about the improved entity API and see the implementation of a few use cases.
Automate your CI toolchain, migrate to the cloud, and more with the Dynatrace Monitored entities API v2
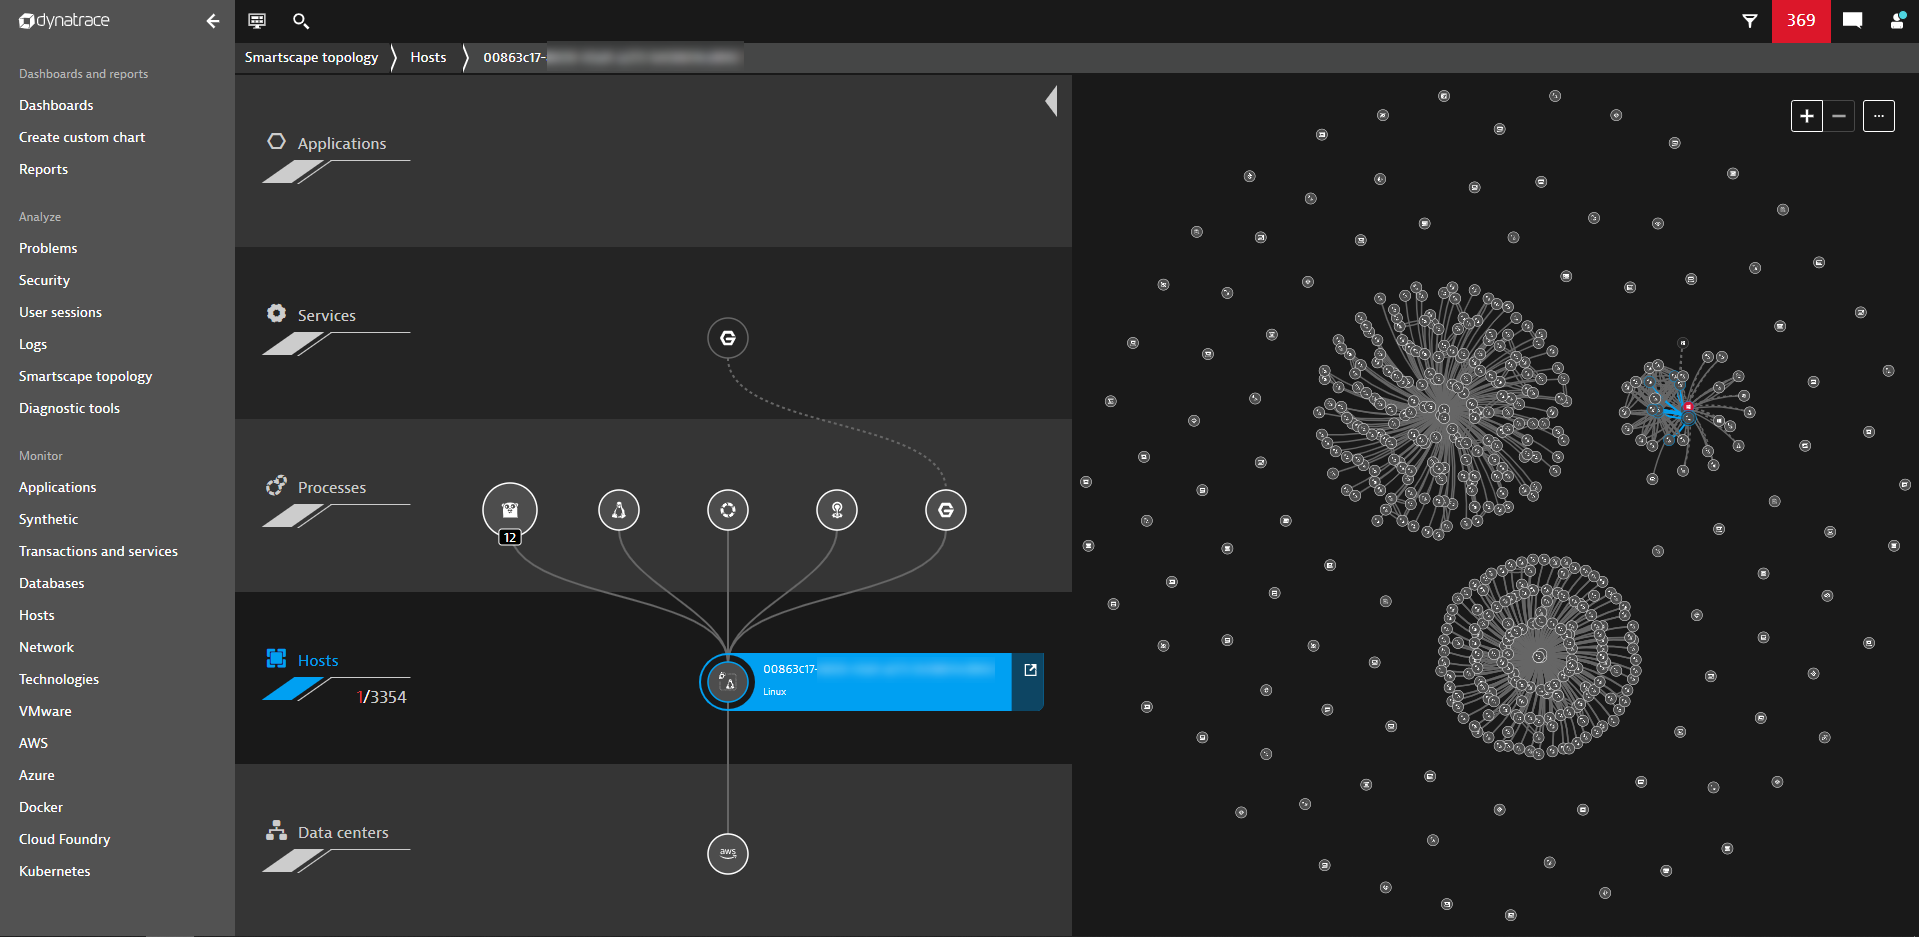
With its patented Smartscape technology, Dynatrace offers a unique way of visualizing all your running IT services and their critical relationships. As Dynatrace OneAgent discovers all the entities and dependencies within your application environment, Smartscape simultaneously builds an interactive map of how everything is interconnected. Every service is overlaid with real-time performance and stability measurements, which provide critical information for your Operations teams.
By leveraging the Monitored entities API, you can empower third-party integrations to use and integrate Dynatrace context information into all kinds of automation workflows. A few of the customer use cases we’ve seen so far include:
- Accelerating cloud migration by measuring the scale of complex applications
- Automatically keeping track of business-critical services in the existing CMDB (ServiceNow, Atlassian, and others)
- Making design decisions based on size and critical dependencies of applications
What’s new in the Monitored entities v2 REST API (Early Adopter release)
To further enable the efficient use of Smartscape-provided information with external integrations, we’re happy to announce improved Monitored entities API endpoints. The following major features are available in this v2 REST API:
- One single endpoint to fetch information about any exported entity type
By having a single endpoint, querying for different entity types such as hosts, services, processes, and applications becomes much simpler.
- More entity types available for export
With this improvement, you can now also export disk, data center, and Docker components to your third-party CMDB.
- New API endpoint for getting the schema (type) of a given component type
This allows your integrations to automatically check for new attributes and types.
- Consistent pagination, entity and timeframe selection across all v2 API endpoints
The consistent use of pagination and entity and timeframe selection across all the v2 API endpoints allows for scale within your web-scale monitoring environments.
- Full control over the resulting payload and information
By having full control over the resulting payloads and information, you can minimize network traffic at your data centers when fetching Dynatrace data.
- Common UI backlink
We’ve added a single navigation URL for redirections back to entity pages within the Dynatrace web UI, so that you can build your own reporting UIs with direct backlinks to the relevant Dynatrace entities.
Here’s the family of entity API endpoints that are newly available in the version 2 REST API:
Monitored entities API use cases
The examples below guide you through the implementation of use cases featuring the Monitored entities API. We start with a simple example and then iteratively implement more complex use cases.
Get an initial overview of the types of entities available
This first example examines the different kinds of entities that are exposed by the entity API and the kinds of properties and relationships each entity type has. The following endpoints provide overviews of the Dynatrace entity model in an automated fashion.
As an example, we’ll call the /api/v2/entityTypes endpoint to get the list of entity types that are available. The resulting JSON payload, as shown below, returns 22 individual entity types along with all their properties. The list endpoint exposes many entity types, such as hosts, applications, services, processes, custom devices, disks, VCenters, and more.
If we focus on a specific entity type, such as hosts, in /api/v2/entityTypes/{type}, we can see all the relevant properties, tags, and management zone information that Dynatrace collects for the hosts and the relationships that these hosts have with other parts of the topology:
Get a filtered list of processes
Now let’s switch to the endpoints that expose instances of identified entities monitored by Dynatrace within your IT environment.
Use the /api/v2/entities endpoint with entitySelector=type(PROCESS_GROUP_INSTANCE) to receive the list of processes running in your environment:
The API call immediately returns all processes running in the Dynatrace environment. As the total number of monitored processes is 50593, the API call does not return everything in a single result, instead returning the first page (the default size is 100 time series per page, which can be changed) of processes along with a nextPageKey that you can use to get the next page of results.
The resulting payload returns the entityId and displayName for each process by default.
It’s likely that you’re not interested in all 50,000+ processes and just want to focus on a subset instead.
The entitySelector request parameter can again be used to refine your query for processes. For example, you can modify the query for processes within a given management zone:
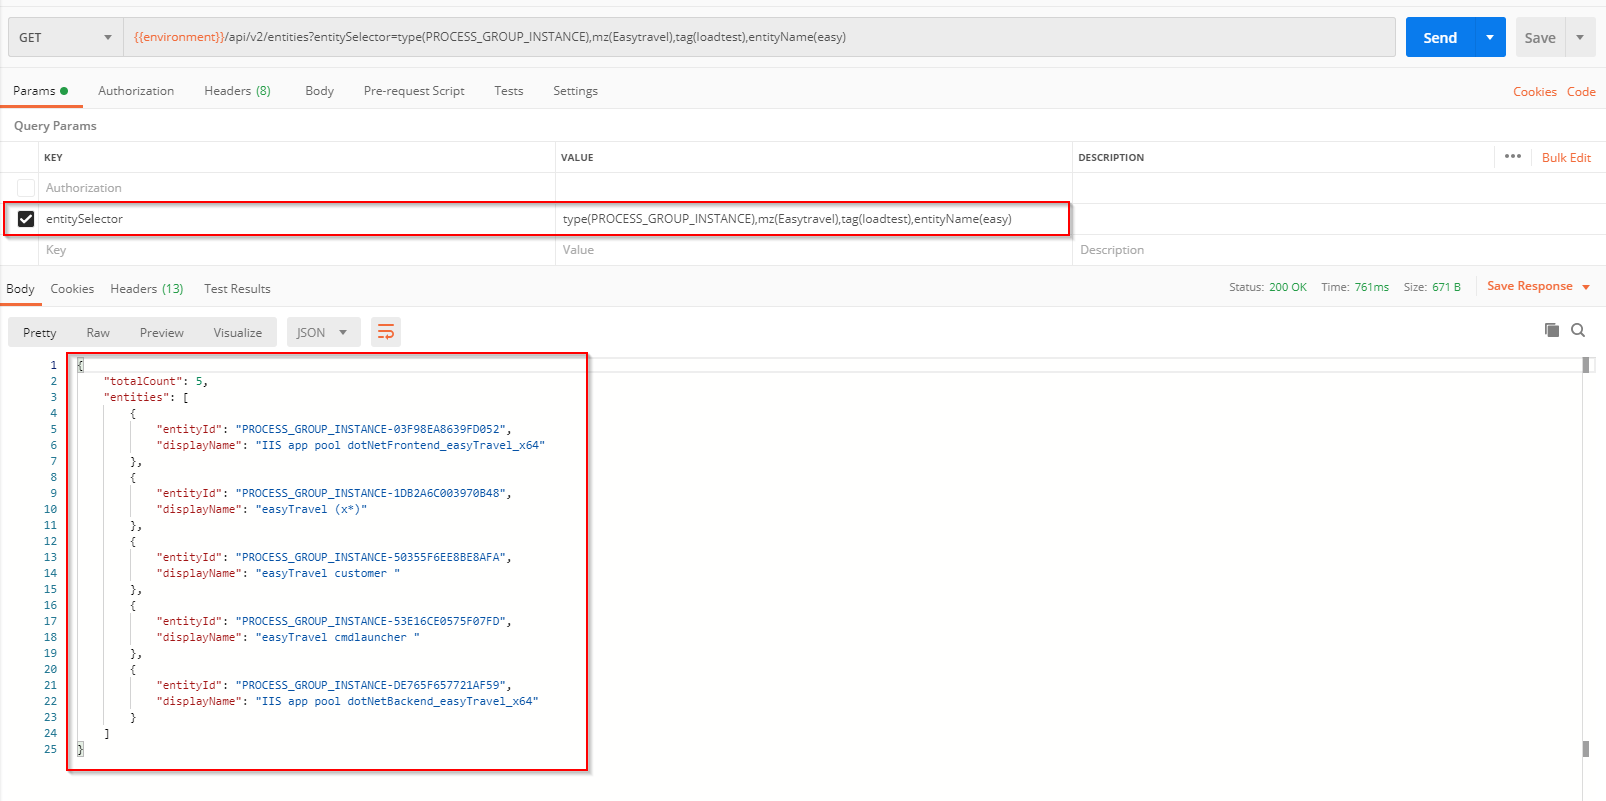
entitySelector=type(PROCESS_GROUP_INSTANCE),mz(Easytravel) In addition, let’s filter for processes that have the loadtest tag assigned and where the displayName contains the string easy:
entitySelector=type(PROCESS_GROUP_INSTANCE),mz(Easytravel),tag(loadtest),entityName(easy)This immediately filters the 50,000+ processes down to a reasonable number of five processes (see below).
Take control of the resulting payload
Next, you can select which information you’d like to include in the results payload.
By default, the API only returns the entityId and displayName to keep the payload as small as possible. Use the fields request parameter to control what else you’d like to get in the results payload.
Say you want to get the tags for each process. Simply add fields=+tags to your API call. Here’s what the result looks like after requesting tags with the fields parameter:
You can add multiple attributes with the fields parameter using the syntax shown below:
fields=+tags,+propertiesproperties represents grouped attributes that can be added at a group level, as shown above. If the API consumer is interested in a subset of properties, you can add those individually, as shown below:
fields=+tags,+properties.appVersionThe resulting payload:
Use relationships to query entities
In many cases, API consumers might want to filter a request based on a given relationship with either a parent entity or a dependent entity within the monitored topology. Popular examples of this are fetching all the disks of a given parent host or fetching all processes that run on a given host.
The newly introduced relationship query functionality via the entitySelector allows you to follow each relationship type, incoming or outgoing, of a given entity.
Relationships are generally split into two major categories (from and to). These categories denote the direction in which a relationship applies to an entity. In most cases, the direction of the relationship comes with a specific semantic. If you query all the services that service A calls, this is a “from (service A)” relationship to other services. When you query all the services that call service A, this a “to (service A)” relationship.
The example below shows how to fetch all processes running on a given host:
entitySelector=type(PROCESS_GROUP_INSTANCE),toRelationship.isProcessOf(entityId(HOST-3052A99AAD944176))If you want to select an entity by name rather than by its unique ID, you can do so using entityName instead of the entityId query along with the type query, as shown below:
entitySelector=type(PROCESS_GROUP_INSTANCE),toRelationship.isProcessOf(type(HOST),entityName(myHost))Relationship query functionality also enables API consumers to follow a service call relationship in the same way they would query all the disks or processes of a given host.
How to find an entity within the Dynatrace Web UI
Many integrations would like to offer backlinks to dedicated entity pages in Dynatrace to save users time as they switch to and from Dynatrace. So this section of the blog post is dedicated to the related question we hear a lot from our user community: “How do you find an entity’s Dynatrace web UI page if you’ve retrieved its unique Dynatrace ID using the API?”
As Dynatrace changes and improves at a fast pace, the UI structure and navigation paths can change over time, which is cumbersome if you want to offer a consistent backlink to a given type of entity.
So instead of offering backlinks as part of the API, we’ve decided to provide a common redirection address format for all entities. You can use the common entity navigation URL within your Dynatrace environment to jump to any entity simply by using its unique ID.
<YOUR_DYNATRACE_ENVIRONMENT_URL>/ui/nav/<ENTITY_ID>To give you a concrete example, let’s assume your Dynatrace environment is https://d2334sdfssdf.live.dynatrace.com. If you want to visit the UI page of your host with the unique ID HOST-AF82014F952CF161, navigate to this URL, which is based on the standard format described above:
https://d2334sdfssdf.live.dynatrace.com/ui/nav/HOST-AF82014F952CF161The same is true for any other entity type, such as a service:
https://d2334sdfssdf.live.dynatrace.com/ui/nav/SERVICE-3282014F952CF163So, no matter how the Dynatrace UI may change in the future, your backlinks will always lead to the most appropriate Dynatrace UI pages for your entities. In case there’s no UI page, the entity navigation URL will lead you to the next closest page so you can find the entity. In the case of a disk, for example, you’ll navigate to the disk’s host page.
Summary
Modern enterprises depend more than ever on highly automated processes to drive productivity, boost efficiency, and stay competitive. Dynatrace provides all the necessary API power to further automate your toolchains and processes to help your teams handle complexity.
The newly introduced Monitored entities API version 2 offers a lot of improvements over its predecessor. It further empowers third-party integrations to use and integrate Dynatrace context information into all kinds of automation workflows such as your deployment pipeline, CI toolchain, or a simple monthly architecture-topology report.


Looking for answers?
Start a new discussion or ask for help in our Q&A forum.
Go to forum