In my last blog I covered how our Engineering Productivity (EP) and Infrastructure & Services (IAS) Teams are ensuring that our DevOps toolchain is running as expected, even while workloads have shifted as our global engineering teams are now working from home. Right after posting the blog another related story was brought to my attention which I am happy to share in this blog.
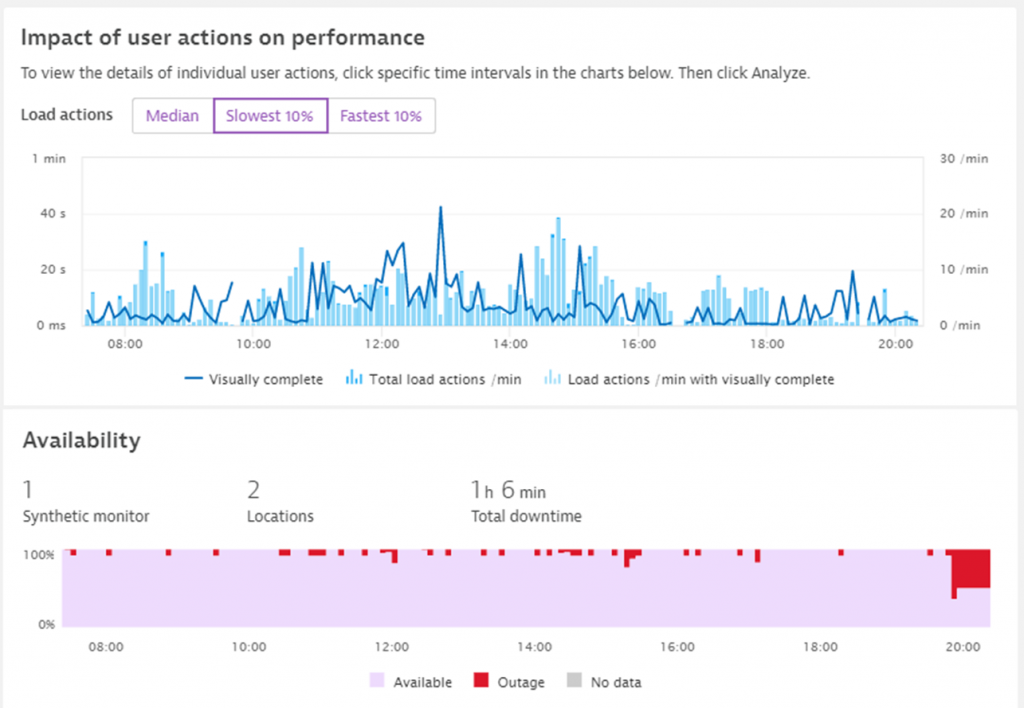
Like many organizations, Dynatrace’s Continuous Integration is largely relying on Jenkins which we also monitor using Dynatrace. On March 31st, Dynatrace alerted the EP team about unusual high page load times during the day when engineers tried to browse through their Jenkins Job results. Dynatrace also alerted on intermittent outages throughout the day and especially after 8pm when the bulk of the nightly jobs were executed:
The question put to the teams was: is this was related to changed behavior due to work-from-home or whether this was a more fundamental issue with Jenkins? Well – that question was easily answered because Dynatrace Davis® already pointed to the actual root cause: High Suspension Time caused by garbage collection:
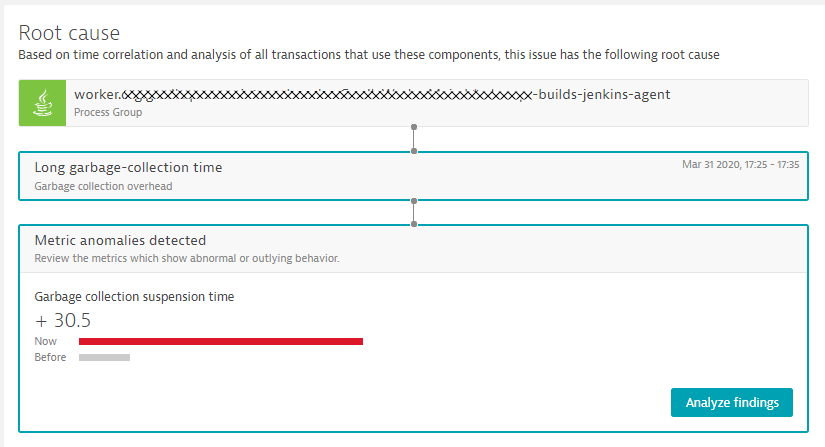
In order to identify why garbage collection went through the roof, the team decided to leverage the new Memory profiling feature in Dynatrace. This is currently available as an Early Adopter Release – find out more about the release in our latest technical blog on fixing slow or frequent garbage collection.
Further reading
Learn more about Java garbage collection in the eBook Chapter How Garbage Collection Works
In the rest of the blog I walk you through the steps that allows our teams to identify a “memory hungry” Jenkins plugin and how the removal of this no longer needed plugin resulted in an overall 3x improvement of Jenkins performance. As a positive side effect, this change reduced the pressure on CPU due to drastically decreased garbage collection activity! As a negative side effect, the team ran into a JVM bug which they could workaround though. But let’s start from the beginning:
Step #1 – Switching to Java 11
In order to leverage the new Memory Profiling feature I’s necessary that you upgrade to Java 11 as this version introduces new capabilities (JEP 331) that allow tool vendors like Dynatrace to capture memory allocation information at run-time with zero overhead.
Step #2 – Using Dynatrace Memory Profiling
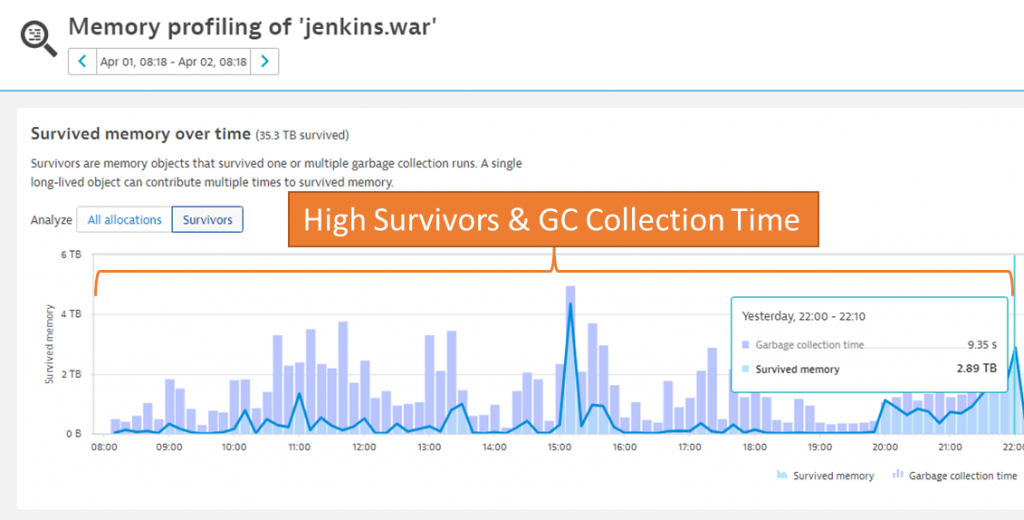
Once you’ve switched to Java 11, Dynatrace’s memory allocation hotspot analyzer view gives a great overview of memory allocations as well as objects that have survived one or many garbage collection runs. The image below is a screenshot that focuses on the timeframe from April 1 – 8:00 until 22:00 showing lots of Garbage Collection (GC) Time and high number of surviving objects:
To identify who is allocating objects that are long lived, therefore survive GC runs and allocate precious space in the higher heap regions Dynatrace comes with a built memory allocation hotspot analysis. Besides a lot of memory being allocated by core Jenkins components, there was one allocation that stuck out; over the course of the analyzed 14 hours, 557 million KXmlParser objects got initialized (call to constructor) allocating 1.62TB (yes – that is Terabyte) of memory. All these allocations came from the Jenkins Job Configuration History Plugin:
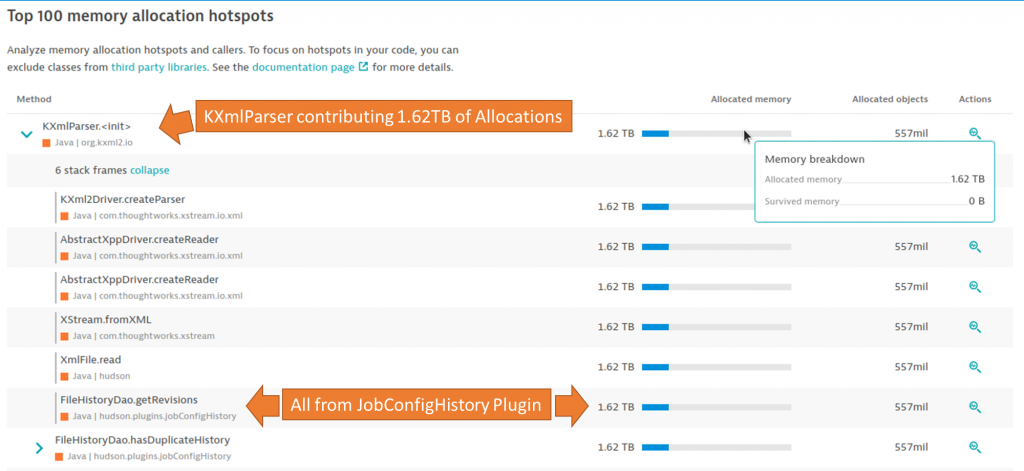
This was an interesting find as nobody assumed such a plugin would allocate that many long living objects resulting in high garbage collection. It was also interesting because the plugin – while definitely solving a good use case – wasn’t really used by our teams any longer.
Step #3 – Removing the offending plugin
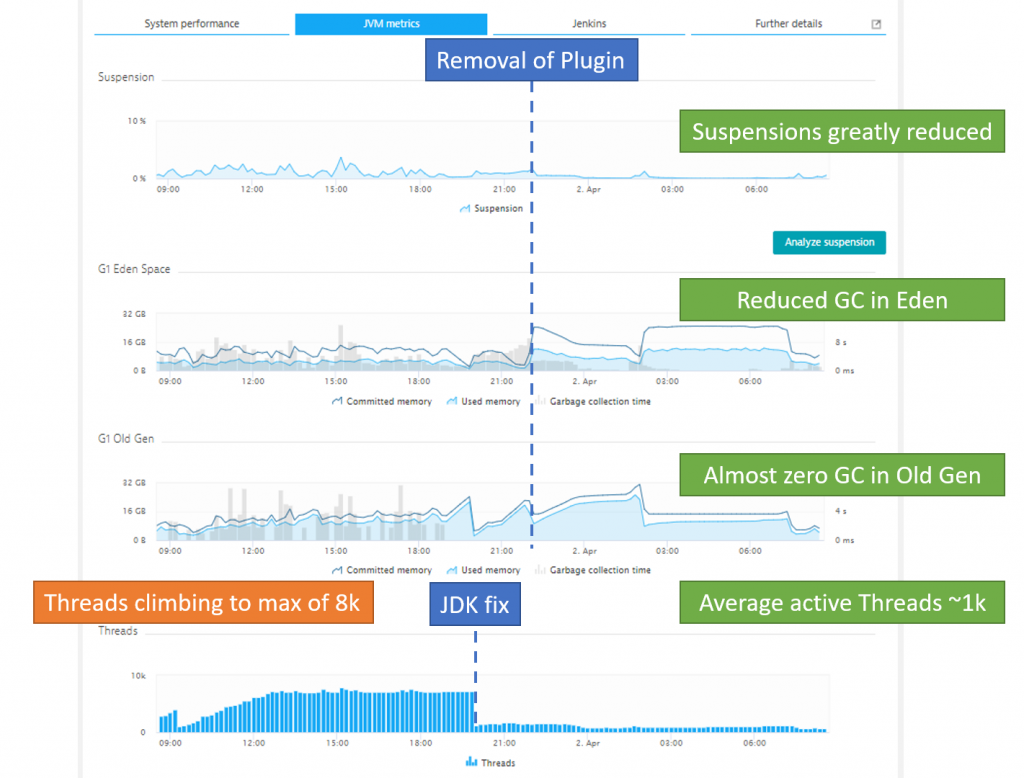
As the plugin wasn’t needed anymore, it was an easy decision to remove it. The impact was immediately visible in the Memory Profiling view:

Step #4 – JDK 11 thread leak
When the team switched over to JVM 11, Dynatrace highlighted a new issue they haven’t seen before; the threads of the JVM started climbing over the course of about four hours until they maxed out at 8k Threads – thus impacting overall performance as incoming requests had to wait for free available threads. Looked like a classical Thread Leaking issue:
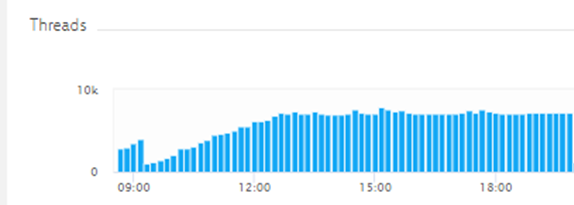
This in fact turned out to be a bug in the JDK which has already been addressed in JDK-8217606 (LdapContext#reconnect always opens a new connection)
Result: Optimized Jenkins running faster and on fewer resources
After removing the problematic Jenkins plugin – which was detected through the Dynatrace Memory Profiling capability – and addressing the JDK bug that was introduced by switching to Java 11 resource, consumption drastically improved for the Jenkins process as you can see in the following Dynatrace process view:
Our IAS team has also setup a Synthetic test to validate the performance of Jenkins and its different APIs our teams are using to automate our pipelines. These Synthetic tests also show a clear improvement of Jenkins performance:
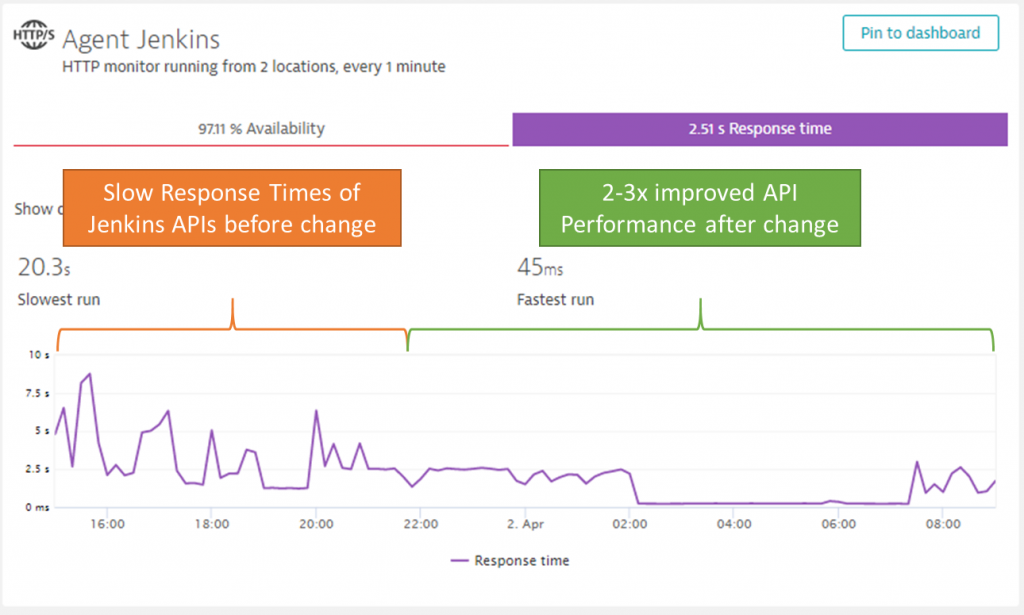
This are all great improvements, and our Jenkins now runs faster with fewer resource requirements.
Thanks as always to the Dynatrace teams who have shared this story with me. A special thanks also to our colleague Philipp Lengauer who is the mastermind behind the new Memory Profiling capability in Dynatrace. I was lucky to have him on one of my podcasts two years ago where we did a Technical Deep Dive into Java 9 – seems like I should invite him back to talk about the latest in the Java space including his work on memory profiling.
Optimize your own Java Application
The next step is for you dear reader.
I’m pretty sure you’ll have Java applications running in your environments that are critical to your business, but are running at a much higher resource cost or not optimal performance. Java memory profiling as demonstrated in this blog allows you to identify hotspots in allocations and memory survivors. It allows you to learn about what part of your application – or which plugins in your application framework – are adding to the memory and therefore cost footprint. To get started, simply try out the new Dynatrace capability. If you don’t have Dynatrace yet, simply sign up for a free Dynatrace SaaS Trial. Also leverage the fact that Dynatrace offers free access to our Software Intelligence Platform as a response to COVID and work-from-home.



Looking for answers?
Start a new discussion or ask for help in our Q&A forum.
Go to forum